. 2022 Apr 15;12(1):6341.
doi: 10.1038/s41598-022-09726-4.

An integrated systems-level model of ochratoxin A toxicity in the zebrafish (Danio rerio) embryo based on NMR metabolic profiling

Affiliations

An integrated systems-level model of ochratoxin A toxicity in the zebrafish (Danio rerio) embryo based on NMR metabolic profiling

Muhamed N H Eeza et al. Sci Rep. .

Abstract

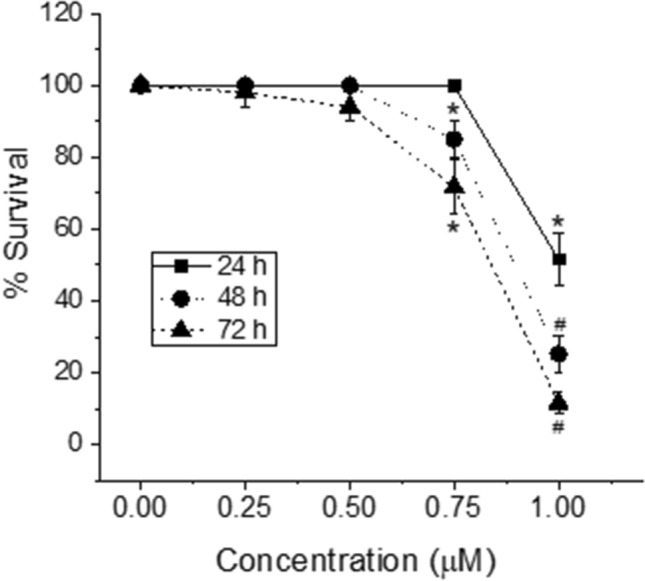
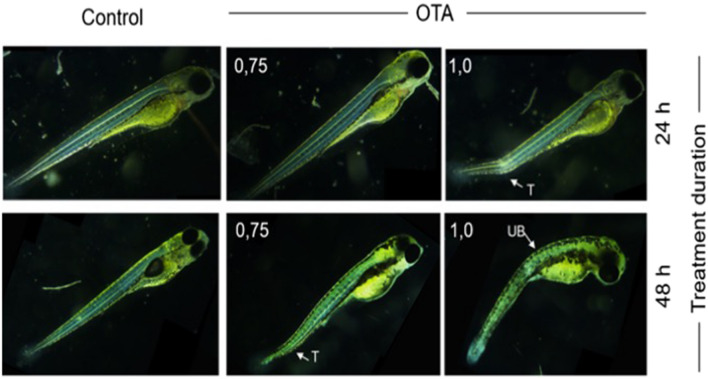
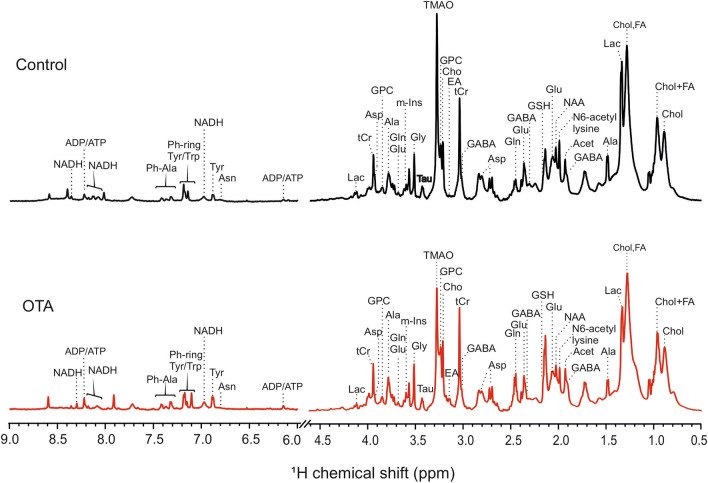
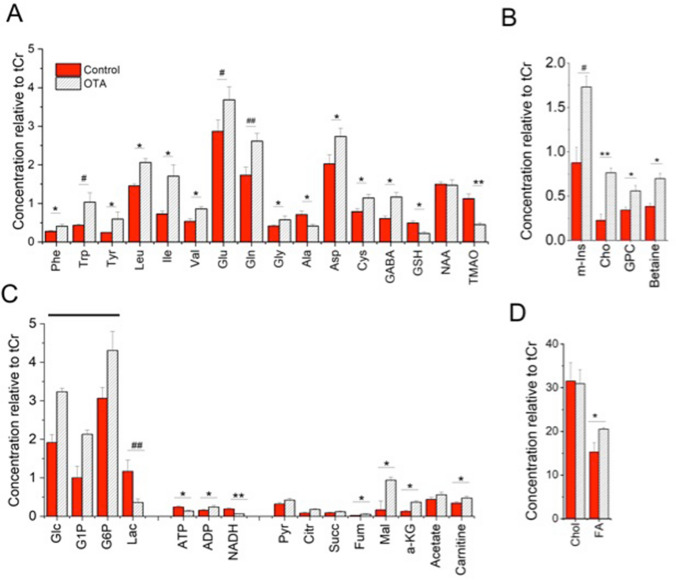
Ochratoxin A (OTA) is one of the most widespread mycotoxin contaminants of agricultural crops. Despite being associated with a range of adverse health effects, a comprehensive systems-level mechanistic understanding of the toxicity of OTA remains elusive. In the present study, metabolic profiling by high-resolution magic angle spinning (HRMAS) NMR, coupled to intact zebrafish embryos, was employed to identify metabolic pathways in relation to a systems-level model of OTA toxicity. Embryotoxicity was observed at sub-micromolar exposure concentrations of OTA. Localization of OTA, based on intrinsic fluorescence, as well as a co-localization of increased reactive oxygen species production, was observed in the liver kidney, brain and intestine of embryos. Moreover, HRMAS NMR showed significant alteration of metabolites related to targeting of the liver (i.e., hepatotoxicity), and pathways associated with detoxification and oxidative stress, and mitochondrial energy metabolism. Based on metabolic profiles, and complementary assays, an integrated model of OTA toxicity is, thus, proposed. Our model suggests that OTA hepatotoxicity compromises detoxification and antioxidant pathways, leading to mitochondrial membrane dysfunction manifested by crosstalk between pathways of energy metabolism. Interestingly, our data additionally aligns with a possible role of mitochondrial fusion as a "passive mechanism" to rescue mitochondrial integrity during OTA toxicity.


Conflict of interest statement

The authors declare no competing interests.

Figures

Figure 1
Figure 1
Concentration- and time-dependent toxicity of OTA in the zebrafish embryo model. Zebrafish embryos (72 hpf) were exposed to different concentrations of OTA (0, 0.25, 0.5, 0.75 and 1.0 µM). Percentage survival of the embryos were recorded after 24 h, 48 h and 72 h exposures. Concentration–dependent toxicity was observed, and increased with exposure time. Values shown are the mean ± standard deviation (n = 6 replicates per group, and 10 embryos per replicate). *P < 0.05 and # P < 0.01 as compared to untreated controls.
Figure 2
Figure 2
Representative images showing developmental deformities of zebrafish embryos. The embryos were exposed (at 72 hpf) to 0.75 µM or 1.0 µM OTA for a duration of 24 h or 48 h, compared to untreated (i.e., Control) embryos. Images were taken at 96 hpf (i.e., 24 h, upper) and 120 hpf (i.e., 48 h, lower). Deformities include bending of upper body (UB) and tail (T). Scale bar = 500 µm.
Figure 3
Figure 3
Distribution of ochratoxin A (OTA) visualized based on its intrinsic fluorescence. (A) The distribution of OTA is shown in the body of 120-hpf zebrafish embryos exposed to 4 µM OTA for 48 h, in comparison to untreated (i.e., “Control”) 120-hpf embryos. Left and middle columns show successive slices through the Control and OTA-treated embryos, respectively, with fluorescence (blue) overlayed on bright field images. Right column shows corresponding fluorescent images of ochratoxin-treated embryos without overlay. As indicated, OTA is accumulated in brain (a), pronephric duct/kidney (b), liver (c) and intestine (d). Images were acquired using inverted laser-scanning confocal microscope (Leica DMi8/TL LED, Leica Microsystems CMS GmbH) with an excitation wavelength of 380 nm, and emission wavelength of 460 nm. A Leica HC PL Apo CS2 (10x/0.15 Dry) objective, and Leica Application Suite X (LAS X) software package version 3.1.5, were used to capture images. (B) Quantitative analysis of OTA fluorescence in brain, liver, pronephric duct (PD)/kidney and intestine of OTA treated zebrafish embryos (red) as compared to untreated control (black) (n = 6 per group). *P < 0.05.
Figure 4
Figure 4
High-resolution magic angle spin (HRMAS) NMR based metabolic profiling. Representative HRMAS NMR spectra of (A) Control and (B) OTA (1 µM) exposed zebrafish embryos (72 hpf) treated for 24 h.
Figure 5
Figure 5
Effect of OTA treatment on the metabolic profile of intact zebrafish embryos. Zebrafish embryos (72 hpf) were exposed to 1 µM OTA or solvent vehicle (“Control”), for 24 h. Concentrations of metabolites relative to total creatine (tCr) are shown, and include (A) amino acids and related metabolites (B) polar head-groups of membrane phospholipids; (C) metabolites associated with energy metabolism; and (D) lipids, i.e., fatty acids and cholesterol. For statistical analysis, one-way ANOVA with a Tukey post-hoc correction for multiple comparisons were performed using OriginPro v. 8 (Northampton, MA, USA). Values shown are the mean ± standard deviation (n = 6). ## P < 0.0001, # P < 0.001, ** P < 0.01 and *P < 0.05. Note As indicated by line, Glc, G1P and G6P could not be unambiguously identified by HRMAS NMR, so statistical significance of differences is not given, however, all three were resolved, and relative changes (i.e., increases) were confirmed, by 2D COSY experiments (see Supplementary Fig. S1). Abbreviations: Phe = phenylalanine; Trp = tryptophan; Tyr = tyrosine; Leu = leucine, Ile = isoleucine; Val = valine; Glu = glutamate; Gln = glutamine; Gly = glycine; Ala = alanine; Asp = aspartate; Cys = cysteine; GABA = γ-aminobutyric acid; GSH = glutathione; TMAO = trimethylamine N-oxide; Glc = glucose; G1P = glucose-1-phosphate; G6P = glucose-6-phosphate; Lac = lactate; ATP = adenosine triphosphate; ADP = adenosine diphosphate; NADH/NAD +  = reduced/oxidized nicotinamide adenine dinucleotide; m-Ins = myo-inositol; Cho = choline; GPC = glycerophosphocholine; Pyr = pyruvate; Cit = citrate; Suc = succinate; Fum = fumarate; Mal = malate; a-KG = alpha ketoglutarate; Chol = cholesterol; FA = fatty acids.
Figure 6
Figure 6
Glutathione levels in extracts of zebrafish embryos (72 hpf) exposed to OTA (1 µM for 24 h) as compared to Control embryos. Glutathione (GSH) levels were analysed by using GSH assay kit from Sigma-Aldrich. Significant reduction of GSH (*P < 0.001; n = 6) in OTA-treated embryo is clearly observed.
Figure 7
Figure 7
Localization of reactive oxygen species (ROS) production in zebrafish embryos exposed to OTA. ROS production was localized in zebrafish embryos (72 hpf) exposed to OTA (1 µM for 24 h) as compared to control embryos. Successive slices are shown through embryos (at 96 hpf) incubated for 60 min in CM-H2DCFA (10 μM) in rearing medium. Green fluorescence images (columns 1 and 3), and overlay with bright-field image (columns 2 and 4), are shown. As can be seen, increased ROS was clearly observed in brain (a), pronephric duct/kidney (b), and intestine (c), as well as liver.
Figure 8
Figure 8
An integrated model of the hepatotoxicity mechanism of ochratoxin A (OTA) in relation to observed changes in metabolic alterations. In liver, OTA affects detoxification pathways (I) associated with disruption of Nrf2 that is a key transcriptional factor for regulating detoxification pathways, and the synthesis of GSH as an antioxidant (II). This is evident by a decrease in GSH, and increase in its precursors Cys, Glu and Gly. The depletion of GSH leads to impaired redox homeostasis, and an increased production of ROS, and consequently, lipid peroxidation and membrane damage especially affecting mitochondrial membrane integrity (III). Mitochondrial membrane hydrolysis is reflected by an increase in Cho, GPC, and m-Ins, as polar headgroups of membrane phospholipids (IV). The loss of membrane integrity leads to impairment of the mitochondrial membrane potential (MMP), with consequent reduction of oxidative phosphorylation as reflected by decrease in ATP. Several pathways upstream of oxidative phosphorylation are consequently affected, as seen by changes in metabolites associated with glycolysis and/or gluconeogenesis, the malate/aspartate shuttle, β-oxidation of fatty acids, glutaminolysis, and the citric acid cycle (V). The energy deficiency and hindered oxidative phosphorylation activates mitochondrial fusions, possibly via elevated levels of betaine, as a “passive mechanism” to rescue mitochondrial integrity and energy metabolism (VI). Observed increases and decreases in metabolites shown by arrows (i.e., ↑ and ↓, respectively). Abbreviations: CYP = cytochrome P450; GST = glutathione-S-transferase; TCA = Tricarboxylic acid cycle, i.e., citric acid cycle; AcCoA = acetyl CoA; OxPhos = oxidative phosphorylation; PL = phospholipids; BCAA/AAA = ratio of branched chain and aromatic amino acids; FMO3 = flavin-containing monooxygenase 3; LDH = Lactate dehydrogenase; ALT = alanine aminotransferase; TMA = trimethylamine; ARE = antioxidant response elements; OAA = oxaloacetate; cAST = cytosolic Aspartate transaminase; mAST = mitochondrial Aspartate transaminase; MFN2 = mitofusin-2; PKM2 = pyruvate kinase; PAG = phosphate-activated glutaminase; β-ox = Beta oxidation; GAD = glutamate decarboxylase; GS = glutamine synthetase; for other metabolite abbreviations, see legend for Fig. 5.

References

    1. Boutrif E, Canet C. Mycotoxin prevention and control: FAO programmes. Revue De Medecine Veterinaire. 1998;149:681–694.
    1. Binder E. Managing the risk of mycotoxins in modern feed production. Anim. Feed Sci. Technol. 2007;133:149–166. doi: 10.1016/j.anifeedsci.2006.08.008. - DOI
    1. Marin S, Ramos AJ, Cano-Sancho G, Sanchis V. Mycotoxins: occurrence, toxicology, and exposure assessment. Food Chem. Toxicol. 2013;60:218–237. doi: 10.1016/j.fct.2013.07.047. - DOI - PubMed
    1. Streit E, Naehrer K, Rodrigues I, Schatzmayr G. Mycotoxin occurrence in feed and feed raw materials worldwide: Long-term analysis with special focus on Europe and Asia. J. Sci. Food. Agric. 2013;93:2892–2899. doi: 10.1002/jsfa.6225. - DOI - PubMed
    1. Denli M, Perez JF. Ochratoxins in feed, a risk for animal and human health: control strategies. Toxins. 2010;2:1065–1077. doi: 10.3390/toxins2051065. - DOI - PMC - PubMed

Publication types