. 2022 Apr 15;12(1):6285.
doi: 10.1038/s41598-022-09690-z.

Signal voids of active cardiac implants at 3.0 T CMR

Affiliations

Signal voids of active cardiac implants at 3.0 T CMR

Theresa Reiter et al. Sci Rep. .

Abstract

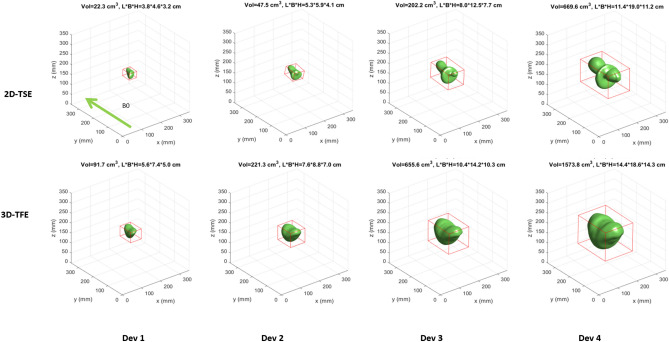
Recent technical advancements allow cardiac MRI (CMR) examinations in the presence of so-called MRI conditional active cardiac implants at 3.0 T. However, the artifact burden caused by susceptibility effects remain an obstacle. All measurements were obtained at a clinical 3.0 T scanner using an in-house designed cubic phantom and optimized sequences for artifact evaluation (3D gradient echo sequence, multi-slice 2D turbo spin echo sequence). Reference sequences according to the American Society for Testing and Materials (ASTM) were additionally applied. Four representative active cardiac devices and a generic setup were analyzed regarding volume and shape of the signal void. For analysis, a threshold operation was applied to the grey value profile of each data set. The presented approach allows the evaluation of the signal void and shape even for larger implants such as ICDs. The void shape is influenced by the orientation of the B0-field and by the chosen sequence type. The distribution of ferromagnetic material within the implants also matters. The void volume depends both on the device itself, and on the sequence type. Disturbances in the B0 and B1 fields exceed the visual signal void. This work presents a reproducible and highly defined approach to characterize both signal void artifacts at 3.0 T and their influencing factors.


Conflict of interest statement

Dr. Weiss is an employee of BIOTRONIK SE & Co. KG, Berlin, Germany, and Dr. Weber is an employee of Philips GmbH, Hamburg, Germany. Prof. Bauer is a scientific advisor for BIOTRONIK SE & Co. KG, Berlin, Germany. Also, this work has been partially funded by BIOTRONIK SE & Co. KG, Berlin, Germany. Dr. Reiter has no competing interests to declare.

Figures

Figure 1
Figure 1
The phantom consists of an acrylic canister A, closed by the lid C. The seal B ensures a water-tight closure of the phantom and prevents spills of the filling during positioning. D shows the acrylic implant holder. The implant E fits into the central space of the implant holder. F shows a scan through the phantom, showing a central section of the implant holder. The implant holder F allows three different orientations of the device relative to the B0 field (H). Changes in the orientation were achieved by turning the implant holder within the phantom. The coordinate system (G) on the phantom guided the repositioning (green arrow: Z- axis, following the direction of the B0 field, X- and Y- axis (black and blue arrows), perpendicular to the Z- axis). The asterisks mark the device header. The blue part is the implant’s main body. Orientation 1 was defined by X: left–right, Y: foot-head, Z: bottom-up. Orientation 2 was defined by X: left–right, Y: top-down, Z: foot-head. Orientation 3 was defined by X: foot-head, Y: right-left, Z: bottom-up.
Figure 2
Figure 2
(A) Active cardiac devices used for the measurements. All implants are manufactured by BIOTRONIK, Germany. Dev. 1: Cardiac loop recorder (“Biomonitor 2”), Dev.2: Pacemaker (Enticos 4 DR), Dev.3: ICD (Ilesto 7 HF-T), Dev.4: ICD (Activor 7 HF-T QP). The scale bar unit is cm. (B) Generic setups: The ferromagnetic material is either all placed in the center (configuration C) or with one half in one corner and the other half in to the opposite corner to be at the maximum distance possible in a state-of-the art ICD (configuration D).
Figure 3
Figure 3
Segmented signal voids induced by the implants Dev1-4 scanned with the 2-DTSE and the 3D-TFE sequences in orientation 1. The red box in each coordinate system represents the boundary box. The absolute values of the boundary box are given below the coordinate system. Dev 1: cardiac loop recorder. Dev 2: Pacemaker, Dev 3 and 4: ICDs. For results in orientation 2 and 3 see Supplemental Figs. 2 and 3.
Figure 4
Figure 4
Morphology of the signal voids produced by the 2D-TSE and 3D-TFE sequence as compared to reference sequences, measured in orientation 1 and with Dev 4.
Figure 5
Figure 5
Comparison of signal void volumes depending on the scan sequence and the device (phantom) orientation. Dev1: cardiac loop recorder, Dev2: pacemaker, Dev3 and Dev4: ICDs.
Figure 6
Figure 6
Generic setups and their artifacts. C describes a centric position of all ferromagnetic material, D the splitting of the ferromagnetic material into two diagonally positioned halves. All scans were performed in orientation 1. The red boxes mark the bounding box dimensions. The absolute values of the boundary box are given below the coordinate system.
Figure 7
Figure 7
B0 (upper row) and B1 (lower row) maps of a central slice within the cubic phantom. The left image of each row shows the empty phantom. The scales range from −5000 Hz to +5000 Hz for B0 and from 50 to 150% relative flip angle for B1 (with 100% indicating the nominal flip angle). The disturbances in the B1 field in the empty phantom are a standing wave effect because the edge length of the phantom is close to the ferromagnetic wave length at 3.0 T. Accordingly, disturbances in B1 in the presence of an active device are measured relatively to the empty scan. The grey circles indicate the ROIS measured on each side of the phantom. 0 Hz is exactly at the transition from green to yellow, a bright green-yellow color thus depicts an offset close to 0 Hz. Regions with an SNR below a certain threshold are shown as black.

References

    1. Eitel I, et al. Comprehensive prognosis assessment by CMR imaging after ST-segment elevation myocardial infarction. J. Am. Coll. Cardiol. 2014;64:1217–1226. doi: 10.1016/j.jacc.2014.06.1194. - DOI - PubMed
    1. Ibanez B, et al. Cardiac MRI endpoints in myocardial infarction experimental and clinical trials: JACC scientific expert panel. J. Am. Coll. Cardiol. 2019;74:238–256. doi: 10.1016/j.jacc.2019.05.024. - DOI - PMC - PubMed
    1. van Kranenburg M, et al. Prognostic value of microvascular obstruction and infarct size, as measured by CMR in STEMI patients. JACC Cardiovasc. Imaging. 2014;7:930–939. doi: 10.1016/j.jcmg.2014.05.010. - DOI - PubMed
    1. Kotanidis CP, et al. Diagnostic accuracy of cardiovascular magnetic resonance in acute myocarditis: A systematic review and meta-analysis. JACC Cardiovasc. Imag. 2018;11:1583–1590. doi: 10.1016/j.jcmg.2017.12.008. - DOI - PubMed
    1. Kramer CM, et al. Standardized cardiovascular magnetic resonance imaging (CMR) protocols: 2020 update. J. Cardiovasc. Magn. Reson. 2020;22:17. doi: 10.1186/s12968-020-00607-1. - DOI - PMC - PubMed

Publication types