. 2023 Aug;243(2):223-234.
doi: 10.1111/joa.13667. Epub 2022 Apr 15.

Structural abnormalities of retinal pigment epithelial cells in a light-inducible, rhodopsin mutant mouse

Affiliations

Structural abnormalities of retinal pigment epithelial cells in a light-inducible, rhodopsin mutant mouse

Debora Napoli et al. J Anat. 2023 Aug.

Abstract

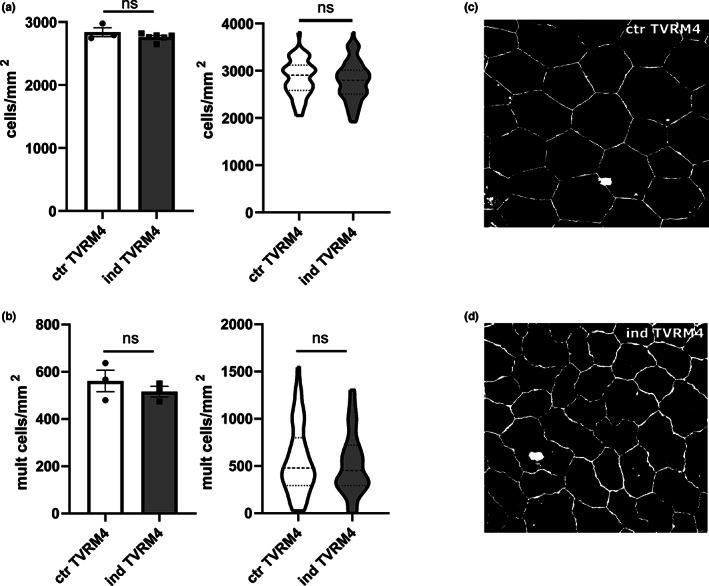
Retinal pigment epithelium (RPE) is a specialized pigmented monolayer dedicated to retinal support and protection. Given the fact that photoreceptor outer segments are the primary energy resource of RPE metabolism, it follows that, when photoreceptor function is compromised, RPE cells are impaired and vice versa. In retinitis pigmentosa (RP), genetic mutations lead to a massive degeneration of photoreceptors but only few studies have addressed systematically the consequences of rod and cone death on RPE cells, which, among others, undergo an abnormal organization of tight junctions (TJs) and a compromised barrier function. The biological mechanisms driving these barrier reorganizations are largely unknown. Studies aimed at addressing general and mutation-independent changes of the RPE in RP are relevant to reveal new pathogenic mechanisms of this heterogeneous family of diseases and prospectively develop effective therapeutic strategies. Here, we take advantage of a mouse model of RP in which retinal degeneration is spatially restricted to investigate a possible involvement of inflammatory responses in RPE remodeling. By immunostaining for Zona Occludens-1 (ZO-1), a structural and functional marker of TJs with pleiotropic functions, we found a partial rescue of TJs organization following local restoration of retinal organization, revealing that TJs structure can recover. Since lack of ZO-1 from TJs can alter cell density, we counted RPE cells without finding any differences between degenerated and controls animals, indicating preservation of RPE cells. However, we found an increased number of immune cells adhering to the RPE apical surface and a spatial correlation with areas of abnormal ZO-1 distribution. This suggests that inflammatory processes following photoreceptor degeneration can be responsible for TJs alterations during RP progression and deserve further investigation.

Keywords: electron microscopy; inflammation; retinal pigment epithelium; retinitis pigmentosa; tvrm4; vacuoles.


Figures

Figure 1
Figure 1
RPE has TJs alterations during retinal degeneration. (a) Whole‐mount image of a TVRM4 retina 1 month post light‐induction. Immunostaining for cone arrestin (red signal) highlights how the central retinal area is totally devoid of fluorescence, as most cones have degenerated (arrows). ONH: Optic nerve head. ZO‐1 staining (green signal) of whole mount RPE from central, induced ocular area (b) and from an intact, peripheral region (c). Blue signal: Nuclear counter staining. Arrows in b indicate interruptions of ZO‐1 positive profiles
Figure 2
Figure 2
TJs is altered in induced TVRM4 respect to control animals but (a) Flatmounts of RPE from TVMR4 mice, 1 month post light‐induction. ZO‐1 immunostaining (green signal). Representative images of control animals (ctr TVRM4, left) and of induced mice (ind TVRM4, right). (b) Quantification of ZO‐1 distribution. Comparison between control (n = 3) and induced mice (n = 6). Left, unpaired t‐test, p = 0.0184. Right, violin plot of data distribution. Error bars represent ±SEM. *p < 0.05, ****p < 0.0001. (c) Flatmounts of RPE, ZO‐1 immunostaining, ligh‐induced TVMR4 mice. Representative images of central (cen, ind TVRM4, left) and peripheral areas (per, ind TVRM4, right). (d) Quantification of ZO‐1 distribution and comparison between central (cen ind TVRM4, n = 6) and peripheral areas (per ind TVRM4, n = 6). Paired t‐test, p = 0.1193. Error bars represent ±SEM. Ns, not significant differences
Figure 3
Figure 3
ZO‐1 do not translocate to the nucleus. This image shows the lack of ZO‐1 staining (green signal) into nuclei (blue signal) of in both cells with normal (C) and impaired TJs (A,B). Arrow shows ZO‐1 interruption
Figure 4
Figure 4
RPE cells of induced TVRM4 have altered shape but no changes in density or nuclei distribution. (a) Comparison of RPE cell density between controls (ctr TVRM4, n = 3) and induced TVRM4 mice (ind TVRM4, n = 6). Unpaired t test (left), p = 0.217; violin plot showing data distribution (right), p = 0.2678 (b). Comparison of multinucleate cell density between controls (ctr TVRM4, n = 3) and induced TVRM4 mice (ind TVRM4, n = 3). Unpaired t test (left), p = 0.4226; violin plot showing data distribution (right), p = 0.4603 (c) binary images representing different shapes of RPE cells in (c) controls (ctr TVRM4) and (d) induced TVRM4 (ind TVRM4) mice
Figure 5
Figure 5
RPE cells of induced mice contain vacuoles with different sizes. Electromicrographs of RPE sections. TVRM4 mouse, light‐induced area. Both small and vary large vacuoles (asterisks) with apparent lack of ultrastructure fill RPE cells mostly concentrated in the proximity of Bruch's membrane (BM). Apical microvilli (AM) appear long and irregular. MV, Melanin vesicles
Figure 6
Figure 6
Accumulation of autofluorescent aggregates on the apical face of induced RPE. The central part of the image is occupied by a large leaflet of RPE from TVRM4 mouse, 1 month after light induction, stained for ZO‐1 (green signal). The central retina is on the left and the periphery on the right. CB, Ciliary body. (a) and (b) are higher magnification of central and peripheral regions respectively. Clustering of autofluorescent bodies is evident in (a)
Figure 7
Figure 7
Aggregates are iba + positive cells. Flatmounts of RPE, Iba1 immunostaining. Representative image of (a) autofluorescent aggregates, (b) Hoechst nuclear staining with ZO‐1(green signal) and (c) Iba1+ cells (red signal) overlying the RPE; (d) digital representation of c. arrows: Ameboid cells. Asterisks: Ramified cells
Figure 8
Figure 8
Distribution of Iba + cells on RPE and altered ZO‐1 profile are correlated. ZO‐1 interruptions and accumulation of Iba + cells are quantification of iba1+ cells density and comparison between control (ctr TVRM4, n = 3) and induced mice (ind TVRM4, n = 6). (a) Unpaired t test, p = 0.0007. Right, violin plot showing data distribution. (b) Comparison between central (cen ind TVRM4, n = 6) and peripheral areas (per ind TVRM4, n = 6). Paired t test, p = 0.0049. Right, violin plot showing data distribution. Error bars represent ±SEM. ***p < 0.05, ****p < 0.0001. (c) Scatter plot showing correlation between Iba1+ cells density and lack of ZO‐1 staining assessed on RPE flatmounts. (c) Analysis performed including data from all controls and induced TVRM4 cases. Pearson correlation: R = −0.514, p = 0.0002. (d) Analysis performed including only data of induced TVRM4. Pearson correlation: R = −0.593, p = 0.0036

References

    1. Aredo, B. , Zhang, K. , Chen, X. , Wang, C.X.‐Z. , Li, T. & Ufret‐Vincenty, R.L. (2015) Differences in the distribution, phenotype and gene expression of subretinal microglia/macrophages in C57BL/6N (Crb1 rd8/rd8) versus C57BL6/J (Crb1 Wt/wt) mice. Journal of Neuroinflammation, 12, 6. - PMC - PubMed
    1. Balda, M.S. , Garrett, M.D. & Matter, K. (2003) The ZO‐1‐associated Y‐box factor ZONAB regulates epithelial cell proliferation and cell density. Journal of Cell Biology, 160(3), 423–432. - PMC - PubMed
    1. Bonilha, V.L. , Rayborn, M.E. , Bhattacharya, S.K. , Xiarong, G. , Crabb, J.S. , Crabb, J.W. et al. (2006) The retinal pigment epithelium apical microvilli and retinal function. In: In retinal degenerative diseases, 519–24. US: Springer. - PMC - PubMed
    1. Brunner, J. , Ragupathy, S. & Borchard, G. (2021) Target specific tight junction modulators. Advanced Drug Delivery Reviews, 171, 266–288. - PubMed
    1. Byrne, E. M. , Llorián‐Salvador, M. , Tang, M. , Margariti, A. , Chen, M. , and Xu, H. 2021. IL‐17A damages the blood–retinal barrier through activating the Janus kinase 1 pathway. Biomedicine, 9(7), 831. - PMC - PubMed

Publication types

MeSH terms