. 2022 Jun;22(6):558-578.
doi: 10.1007/s12012-022-09738-6. Epub 2022 Apr 16.

Interplay of Obesity, Ethanol, and Contaminant Mixture on Clinical Profiles of Cardiovascular and Metabolic Diseases: Evidence from an Animal Study

Affiliations

Interplay of Obesity, Ethanol, and Contaminant Mixture on Clinical Profiles of Cardiovascular and Metabolic Diseases: Evidence from an Animal Study

Maria Florian et al. Cardiovasc Toxicol. 2022 Jun.

Abstract

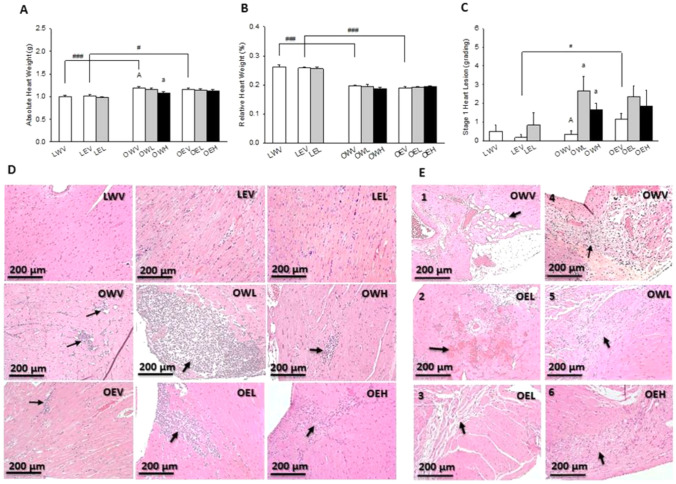
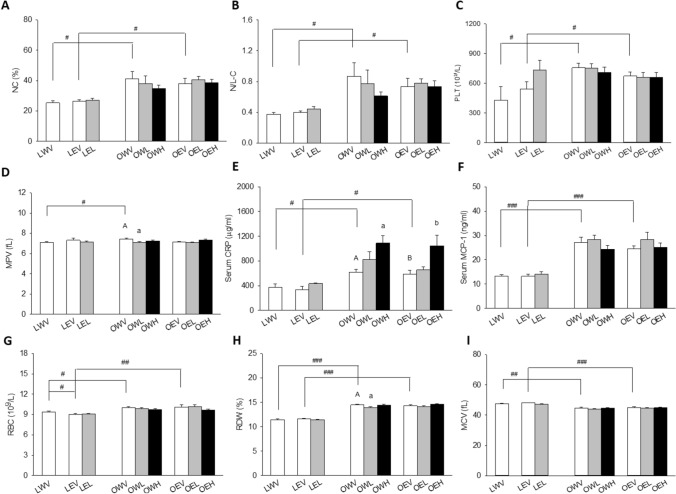
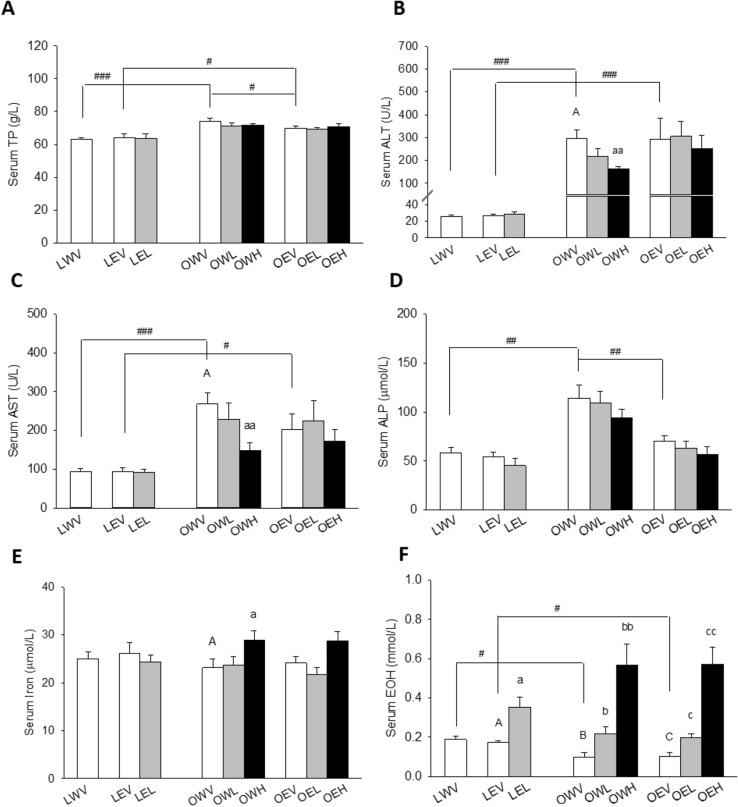
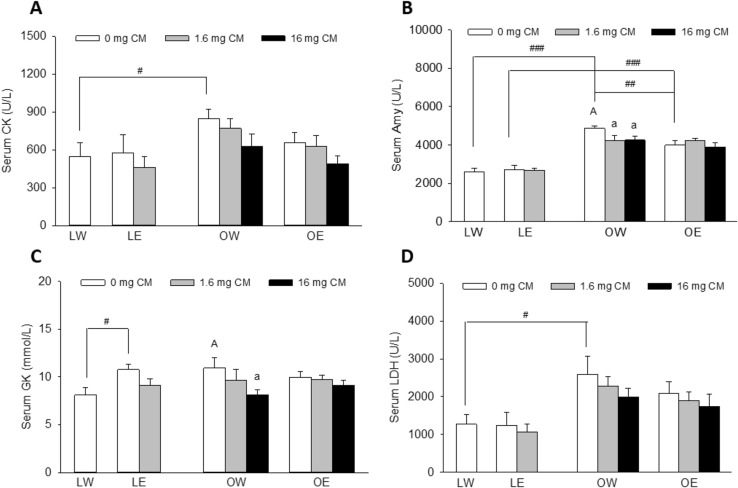
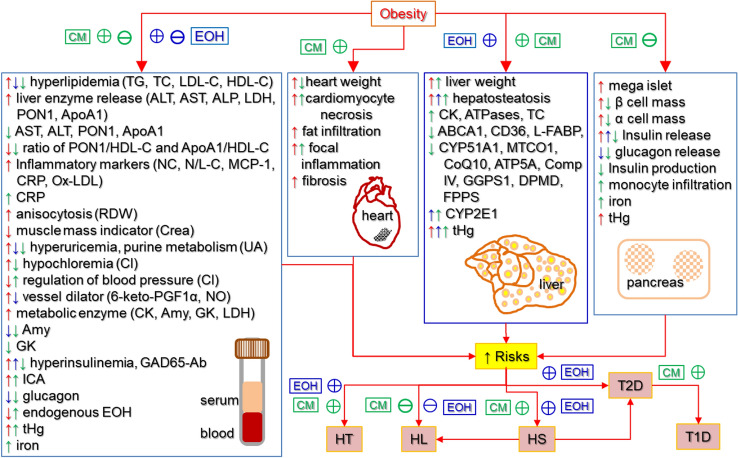
Obesity, ethanol, and contaminants are known risk factors of cardiovascular and metabolic diseases (CMD). However, their interplay on clinical profiles of these diseases remains unclear, and thus were investigated in this study. Male lean or obese JCR rats were given water or 10% ethanol and orally treated with or without a contaminant mixture (CM) dissolved in corn oil and loaded on two cookies at 0, 1.6, or 16 mg/kg BW/day dose levels for 4 weeks. The CM consisted 22 environmental contaminants found in human blood or serum of Northern populations. Over 60 parameters related to CMD were examined. The results revealed that obesity in JCR rats resembles the clinical profiles of non-alcoholic fatty liver disease in humans. Obesity was also associated with increased serum and organ retention of mercury, one of the chemical components of CM. Exposure to ethanol lightened hyperlipidemia, increased liver retention of mercury, and increased risk for hypertension in the obese rats. CM lessened hyperlipidemia and hyperenzymemia, worsened systemic inflammation and increased the risk for hypertension in the obese rats. CM markedly increased serum ethanol levels with or without ethanol exposure. Tissue total mercury contents significantly correlated with clinical parameters with altered profiles by both ethanol and obesity. These results suggest that obese individuals may be more prone to contaminant accumulation. Ethanol and CM exposure can alter clinical profiles associated with obesity, which may lead to misdiagnosis of CMD associated with obesity. CM can alter endogenous production and/or metabolism of ethanol, further complicating disease progression, diagnosis, and treatment.

Keywords: Cardiovascular and metabolic diseases; Clinical markers; Contaminants; Ethanol; Obesity.


Conflict of interest statement

There is no conflict of interest related to the work described in this manuscript.

Figures

Fig. 1
Fig. 1
Effects of obesity, EtOH and CM on physiology and pathological parameters of heart, including absolute (A) and relative (B) heart weight, stage 1 heart lesion (C) and (D), and other histological lesions (E) observed in H&E staining of paraffin sections of heart organ under ×20 objective of a microscope (D-I). In D, black arrows indicate stage 1 lesion. In E, black arrow shows fat infiltration (E1), hemorrhage (E2), fibrosis (E3), granulation (E4, and E5) and plague formation (E6). Vertical bars represent the mean values from 4–8 rats. The error bars are the standard error of the means. “A” is significantly different from “a” at p < 0.05. “#” and “###” indicate significant differences between the two treatment groups located under the vertical lines at p < 0.05 and 0.001, respectively. p values were obtained from One Way ANOVA
Fig. 2
Fig. 2
Effects of obesity, EtOH, and CM on circulating lipid and lipoprotein related markers. including serum triglycerides (TG) (A), total cholesterol (TC) (B), low-density lipoprotein cholesterol (LDL-C) (C), high-density lipoprotein cholesterol (HDL-C) (D), paraoxonase-1 (PON1) (E), apolipoprotein A1 (ApoA1) (F), ratio of PON1 to HDL cholesterol (G), ratio of ApoA1/HDL-C (H), and Ox-LDL (I). Vertical bars represent the mean values from 4–8 rats. The error bars are the standard error of the means. “A” is significantly different from “a”, “aa”, and “aaa” at p < 0.05, 0.01, and 0.001, respectively. “B” is significantly different from “b”, “bb”, and “bbb” at p < 0.05, 0.01, and 0.001, respectively. “C” is significantly different from “c”, “cc”, and “ccc” at p < 0.05, 0.01, and 0.001, respectively. “#”, “##”, and “###” indicate significant differences between the two treatment groups located under the vertical lines at p < 0.05, 0.01, and 0.001, respectively. p values were obtained from One Way ANOVA
Fig. 3
Fig. 3
Effects of obesity, EtOH, and CM on inflammatory and hematological markers including neutrophil counts (NC) (A), neutrophil to lymphocytes ratio (N/L-C) (B), platelet counts (PLT) (C), mean platelet volume (MPV) (D), C-reactive protein (CRP) (E), monocyte chemoattractant protein-1 (MCP-1) (F), red blood cell counts (RBC) (G), red cell distribution width (RDW) (H), and mean corpuscular volume (MCV) (I). Vertical bars represent the mean values from 4–8 rats. The error bars are the standard error of the means. “A” is significantly different from “a” at p < 0.05. “B” is significantly different from “b” at p < 0.05. “#”, “##”, and “###” indicate significant differences between the two treatment groups located under the vertical lines at p < 0.05, 0.01, and 0.001, respectively. p values were obtained from One Way ANOVA
Fig. 4
Fig. 4
Effects of obesity, EtOH, and CM on clinical markers related to kidney function and blood pressure regulation including serum creatinine (A), chloride (Cl) (B), blood urea nitrogen (BUN) (C), BUN/creatinine ratio (D), uric acid (UA) (E), water or EtOH consumption (W/E-C) (F), 6-keto-prostaglandian F1α (6-keto-PGF1α) (G), and nitric oxide (NO) (H). Vertical bars represent the mean values from 4–8 rats. The error bars are the standard error of the means. “A” is significantly different from “a”, “aa”, and “aaa” at p < 0.05, 0.01, and 0.001, respectively. “B” is significantly different from “b” at p < 0.05. “#”, “##”, and “###” indicate significant differences between the two treatment groups located under the vertical lines at p < 0.05, 0.01, and 0.001, respectively. p values were obtained from One Way ANOVA
Fig. 5
Fig. 5
Effects of obesity, EtOH, and CM on liver function markers including serum protein (TP) (A), alanine aminotransferase (ALT) (B), aspartate aminotransferase (AST) (C), alkaline phosphatase (ALP) (D), iron (E), and EtOH (F). LW for lean rats given water. Vertical bars represent the mean values from 4 to 8 rats. The error bars are the standard error of the means. “A” is significantly different from “a” and “aa” at p < 0.05 and 0.01, respectively. “B” is significantly different from “b” and “bb” at p < 0.05 and 0.01, respectively. “C” is significantly different from “c” and “cc” at p < 0.05 and 0.01, respectively. “#”, “##”, and “###” indicate significant differences between the two treatment groups located under the vertical lines at p < 0.05, 0.01, and 0.001, respectively. p values were obtained from One Way ANOVA
Fig. 6
Fig. 6
Effects of obesity, EtOH, and CM on markers of tissue injury and energy metabolism including serum creatine kinase (CK) (A), amylase (Amy) (B), glucokinase (GK) (C), lactate dehydrogenase (LDH) (D). Vertical bars represent the mean values from 4–8 rats. The error bars are the standard error of the means. “A” is significantly different from “a” at p < 0.05. “#”, “##”, and “###” indicate significant differences between the two treatment groups located under the vertical lines at p < 0.05, 0.01, and 0.001, respectively. p values were obtained from One Way ANOVA
Fig. 7
Fig. 7
Summary of the effects of obesity, EtOH, and CM and their interactions on organ and serum parameters. These parameters are related to risks of hyperlipidemia (HL), hypertension (HT), hepatosteatosis (HS), and diabetes (T1D, T2D) in JCR rats observed in our previous and current studies. Upward arrows indicate promoting or increasing effects. Downward arrows indicate inhibiting or decreasing effects. Red color is used for the effects of obesity. Blue color is used for the effects of EtOH. Green color is used for the effects of CM. Circles with plus symbols indicate promoting interaction or positive correlations while circles with minus symbols indicate inhibiting interaction or negative correlations. TG: triglyceride. TC total cholesterol, LDL-C low-density lipoprotein cholesterol, HDL-C high-density lipoprotein cholesterol, ALT alanine aminotransferase, AST aspartate aminotransferase, ALP alkaline phosphatase, LDH lactate dehydrogenase, PON1 paraoxonase-1, ApoA1 apolipoprotein A1, NC neutrophil counts, N/L-C ratio of neutrophil to lymphocyte counts, MCP-1 monocyte chemoattractant protein-1, CRP C-reactive protein, Ox-LDL oxidized low-density lipoprotein, RDW red cell distribution width, Crea creatinine, UA uric acid, CL chloride, 6-keto-PGF1α 6-keto-protaglandane F1 alpha, NO nitric oxide, CK creatinine kinase, Amy amylase, GK glucokinase, GAD65-Ab glutamic acid decarboxylase autoantibody, ICA islet cell antibody, ATPases adenosine triphosphatases, ABCA1 ATP-binding cassette transporter 1, CD36 fatty acid translocase or scavenger receptor class B member 3, LFABP liver fatty acid binding protein, CYP51A1 cytochrome P450 family 51 subfamily A member 1, MTCO1 mitochondrially encoded cytochrome c oxidase I, CoQ10 co-enzyme Q10, ATP5A ATP synthase lipid-binding protein, Comp IV cytochrome c oxidase or Complex IV, GGPS1 geranylgeranyl diphosphate synthase, MVD diphosphomevalonate decarboxylase, FDPS farnesyl pyrophosphate synthase, CYP2E1 cytochrome P450 family 2 subfamily E member 1

References

    1. Thomas MR, Lip GY. Novel risk markers and risk assessments for cardiovascular disease. Circulation Research. 2017;120(1):133–149. doi: 10.1161/CIRCRESAHA.116.309955. - DOI - PubMed
    1. Stegemann C, Pechlaner R, Willeit P, Langley SR, Mangino M, Mayr U, Menni C, Moayyeri A, Santer P, Rungger G, Spector TD, Willeit J, Kiechl S, Mayr M. Lipidomics profiling and risk of cardiovascular disease in the prospective population-based Bruneck study. Circulation. 2014;129(18):1821–1831. doi: 10.1161/CIRCULATIONAHA.113.002500. - DOI - PubMed
    1. Shapiro MD, Fazio S. From lipids to inflammation: New approaches to reducing atherosclerotic risk. Circulation Research. 2016;118(4):732–749. doi: 10.1161/CIRCRESAHA.115.306471. - DOI - PubMed
    1. Ruparelia N, Chai JT, Fisher EA, Choudhury RP. Inflammatory processes in cardiovascular disease: A route to targeted therapies. Nature Review of Cardiology. 2017;14(3):133–144. doi: 10.1038/nrcardio.2016.185. - DOI - PMC - PubMed
    1. Moriya J. Critical roles of inflammation in atherosclerosis. Journal of Cardiology. 2019;73(1):22–27. doi: 10.1016/j.jjcc.2018.05.010. - DOI - PubMed

Publication types