. 2022 Oct;38(10):1139-1152.
doi: 10.1007/s12264-022-00855-4. Epub 2022 Apr 16.

Excitatory Crossmodal Input to a Widespread Population of Primary Sensory Cortical Neurons

Affiliations

Excitatory Crossmodal Input to a Widespread Population of Primary Sensory Cortical Neurons

Yuan-Jie Xiao et al. Neurosci Bull. 2022 Oct.

Abstract

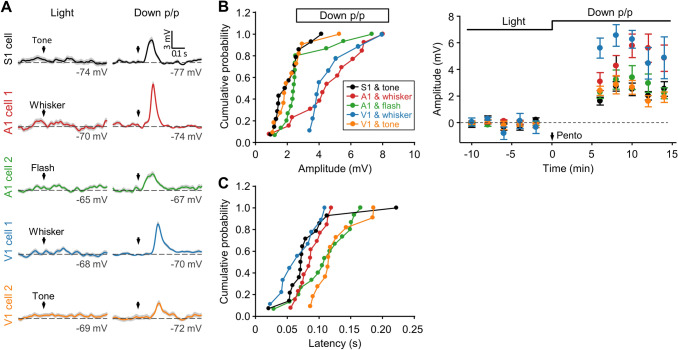
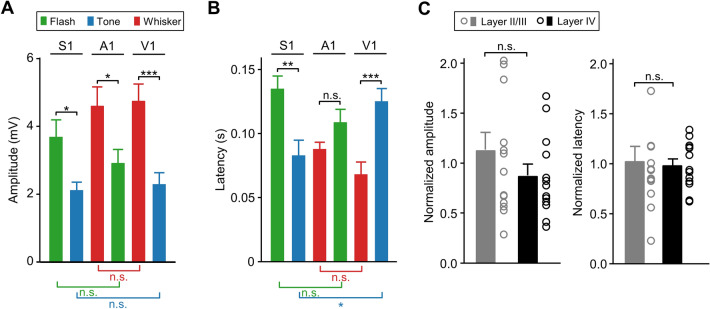
Crossmodal information processing in sensory cortices has been reported in sparsely distributed neurons under normal conditions and can undergo experience- or activity-induced plasticity. Given the potential role in brain function as indicated by previous reports, crossmodal connectivity in the sensory cortex needs to be further explored. Using perforated whole-cell recording in anesthetized adult rats, we found that almost all neurons recorded in the primary somatosensory, auditory, and visual cortices exhibited significant membrane-potential responses to crossmodal stimulation, as recorded when brain activity states were pharmacologically down-regulated in light anesthesia. These crossmodal cortical responses were excitatory and subthreshold, and further seemed to be relayed primarily by the sensory thalamus, but not the sensory cortex, of the stimulated modality. Our experiments indicate a sensory cortical presence of widespread excitatory crossmodal inputs, which might play roles in brain functions involving crossmodal information processing or plasticity.

Keywords: Crossmodal input; Crossmodal plasticity; Crossmodal response; Crossmodal task; GABAergic transmission; Sensory cortex; Sensory loss.


Conflict of interest statement

The authors declare no competing interests concerning the subject of this study.

Figures

Fig. 1
Fig. 1
Flash-evoked Vm responses in S1 neurons in Down p/p. A Schematic for visual stimulation and S1 recording. B Two representative S1 cells showing the absence of Vm responses to a flash stimulus under light pentobarbital anesthesia (left), as well as excitatory Vm responses in Down p/p (right), with experimental procedures for Down p/p (Exp. I) shown in Table S1. Traces are averages of 100 stimulation trials (shadows, ± SEM; inter-stimulus-interval, 6 s). Dashed line, baseline Vm in average traces; arrow, stimulus onset. C For the two cells in B, time course plots for response amplitudes. Dots with bars represent the mean ± SEM of 20 consecutive trials; time 0, down-regulating injection of pentobarbital (Pento). In the recordings under light anesthesia, during which no responses were detected, the amplitudes of Vm changes were measured according to the peak time of responses in Down p/p. D, E Summary for all experiments as displayed in B and C (n = 18 from 14 animals), with Vm responses in Down p/p normalized to their peak amplitudes in individual cells and indicated by the color scale (D; 0 and 1 on the color scale represent the baseline and peak amplitude in the average Vm responses, respectively; Time 0, stimulus onset), as well as the time courses of response amplitudes (E; as in C).
Fig. 2
Fig. 2
Flash-evoked Vm responses in S1 neurons during brain activity down-regulated by various drug treatments. A For S1 recordings in Down m/p, m/u, and u/u, example Vm responses to the flash stimulus (two cells for each drug treatment), and as a comparison with those in Down p/p (as in Fig. 1B), flash-evoked Vm responses in two V1 neurons in Down p/p. BD Summary of flash-evoked Vm responses in S1 neurons recorded in Down p/p (n = 18 from 14 animals), Down m/p (n = 13 from 6 animals), Down m/u (n = 21 from 7 animals), and Down u/u (n = 11 from 5 animals), with cumulative distributions of their amplitudes (B), onset latencies (C), and durations (D). Histograms in insets: mean ± SEM. *P < 0.05, **P < 0.01, ***P < 0.001; unpaired Student’s t-test. E With vehicle for muscimol infused bilaterally into the lateral ventricle under light pentobarbital anesthesia, no responses to the flash are found in S1 recordings (n = 10 from 5 animals), as shown by the Z-scores of Vm changes of all individual data (arrow, stimulus onset; gray areas, range of ±2-fold-SD in baseline noise). F With optic nerves cut and recordings performed in Down p/p [Down p/p (Exp. II) in Table S1], no responses to the flash occur in S1 recordings (n = 8 from 3 animals).
Fig. 3
Fig. 3
Effects of V1 lesion and V1-lidocaine infusion on flash-evoked S1 responses in Down p/p. A, B With mechanical lesion to the entire V1 regions, as illustrated in A (scale in mm showing the coordinates from Bregma), flash-elicited Vm responses recorded in Down p/p in S1 neurons (n = 13 from 9 animals) exhibit similar amplitudes and onset latencies, but increased durations, compared with control recordings in Down p/p (i.e., without lesion; n = 15 from 12 animals). The experimental procedures of these recordings (for both the control and lesion groups) are shown in Table S1 for Down p/p (Exp. II). Dots and histograms, individual data and mean ± SEM, respectively. C For data as in B, Vm responses averaged across population data in reference to stimulus onset (shadows, ± SEM). D Vm responses of two example S1 cells before and after lidocaine infusion into V1. E, F Summary of all the recordings as shown in D (n = 7 from 6 animals), with time course plots of the response amplitudes (E; each dot represents the average of 20 consecutive trials, which was further normalized to the value before lidocaine infusion; time 0, lidocaine infusion; error bars, SEM), as well as the amplitudes, onset latencies, and durations before and after V1-lidocaine infusion (F; data from the same cells connected by lines). ***P <0.001; n.s., not significant; unpaired Student’s t-test for B and paired t-test for F.
Fig. 4
Fig. 4
Effects of LGN-lidocaine infusion on flash-evoked S1 responses in Down p/p. A With lidocaine infusion into the LGN, two S1 cells are recorded in Down p/p showing reduced Vm responses (Cell 1) and no detectable responses (Cell 2) [experimental procedures shown in Table S1 for Down p/p (Exp. II)]. B, C Summary of the reduction of S1 responses by LGN-lidocaine infusion (n = 9 from 4 animals), including a saline control shown in B (n = 8 from 8 animals). Data are displayed as in Fig. 3E, F. Time 0 (arrow), lidocaine/saline infusion. ***P <0.001; paired Student’s t-test.
Fig. 5
Fig. 5
No flash-evoked spike responses in VPM neurons in Down p/p. A For extracellular unit recordings in the VPM during light pentobarbital anesthesia, two example data (Units 1 and 2; upper and middle) and summarized data (lower; n = 9 from 5 animals) showing spike-rate (SR) responses to whisker stimuli. For each recording, raster plots and peristimulus time histograms (PSTHs, with SRs calculated using a bin width of 50 ms) are displayed (time 0 and arrow, stimulation onset). The summary is plotted with cumulative distributions of Z-scores of SR responses (with reference to SD values of baseline noise). B, C For the example unit recordings and all unit recordings displayed in A, no SR responses to flash stimuli were recorded under light pentobarbital anesthesia (B) or in Down p/p (C). For the summary (lower), Z-scored SRs (in PSTHs) are shown (each trace representing each recording; gray areas, range of ±2-fold-SD in baseline noise). D In Down p/p, flash-evoked Vm responses in two example S1 cells that are simultaneously recorded with VPM unit recordings.
Fig. 6
Fig. 6
No retrograde labeling in the LGN with CTB infusion in S1. A Representative coronal brain section (~0.9 mm posterior to bregma) showing CTB (conjugated to mCherry, red) infusion into S1. Nuclei are stained with DAPI (blue). B Representative coronal sections from the same mouse showing retrogradely labeled (mCherry-positive) neurons in the VPM but not in the LGN, with VPM and LGN borders (white lines in middle and right panels) outlined according to a mouse brain atlas [59] (as shown in the left for the corresponding section in the middle, ~1.8 mm posterior to bregma).
Fig. 7
Fig. 7
Crossmodal responses of S1, A1, and V1 neurons by stimulating different sensory modalities. A Example cells in S1, A1, and V1 showing Vm responses to tone, whisker, or flash stimuli that were first measured during light pentobarbital anesthesia and then in Down p/p. In each cortical area, different cells were recorded when different stimuli were used. B, C Summary of response amplitudes (B, with cumulative distributions and time courses shown at left and right, respectively) and onset latencies (C) for all experiments as displayed in A (S1 and tone, n = 14 from 8 animals; A1 and whisker, n = 13 from 9 animals; A1 and flash, n = 15 from 10 animals; V1 and whisker, n = 9 from 5 animals; V1 and tone, n = 11 from 9 animals). Data are plotted as in Figs. 1E and 2B, C.
Fig. 8
Fig. 8
Comparison of different groups of crossmodal responses in Down p/p. A, B Amplitudes (A) and onset latencies (B) for different groups of crossmodal responses in Down p/p evoked by flash, tone, or whisker stimuli in S1, A1, or V1 (experiments in Figs. 1 and 7). C Amplitudes and onset latencies of flash- and tone-evoked S1 responses (in the experiments summarized in A and B) measured at cortical depths of 195–400 µm (337 ± 55 µm; assumed to be layers II/III; n = 10 and 4 from flash- and tone- stimulation groups, respectively) and 410–620 µm (482 ± 58 µm; assumed to be layer IV; n = 7 and 6 from flash- and tone- stimulation groups, respectively). In each stimulation group, data are normalized by the corresponding averaged values as presented in A and B (for S1 and tone and S1 and flash). Dots and histograms, individual normalized data, and mean ± SEM, respectively. *P <0.05; **P <0.01; ***P <0.001; n.s., not significant; unpaired Student’s t-test.

Similar articles

Cited by

References

    1. Ghazanfar AA, Schroeder CE. Is neocortex essentially multisensory? Trends Cogn Sci. 2006;10:278–285. doi: 10.1016/j.tics.2006.04.008. - DOI - PubMed
    1. Wallace MT, Ramachandran R, Stein BE. A revised view of sensory cortical parcellation. Proc Natl Acad Sci U S A. 2004;101:2167–2172. doi: 10.1073/pnas.0305697101. - DOI - PMC - PubMed
    1. Shimojo S, Shams L. Sensory modalities are not separate modalities: Plasticity and interactions. Curr Opin Neurobiol. 2001;11:505–509. doi: 10.1016/S0959-4388(00)00241-5. - DOI - PubMed
    1. Olcese U, Iurilli G, Medini P. Cellular and synaptic architecture of multisensory integration in the mouse neocortex. Neuron. 2013;79:579–593. doi: 10.1016/j.neuron.2013.06.010. - DOI - PubMed
    1. Sathian K, Zangaladze A. Feeling with the mind's eye: Contribution of visual cortex to tactile perception. Behav Brain Res. 2002;135:127–132. doi: 10.1016/S0166-4328(02)00141-9. - DOI - PubMed

LinkOut - more resources