Meta-Analysis
. 2022 Apr 16;19(1):96.
doi: 10.1186/s12974-022-02441-x.

The cytokines interleukin-6 and interferon-α induce distinct microglia phenotypes

Affiliations
Meta-Analysis

The cytokines interleukin-6 and interferon-α induce distinct microglia phenotypes

Phillip K West et al. J Neuroinflammation. .

Abstract

Background: Elevated production of the cytokines interleukin (IL)-6 or interferon (IFN)-α in the central nervous system (CNS) is implicated in the pathogenesis of neurological diseases such as neuromyelitis optica spectrum disorders or cerebral interferonopathies, respectively. Transgenic mice with CNS-targeted chronic production of IL-6 (GFAP-IL6) or IFN-α (GFAP-IFN) recapitulate important clinical and pathological features of these human diseases. The activation of microglia is a prominent manifestation found both in the human diseases and in the transgenic mice, yet little is known about how this contributes to disease pathology.

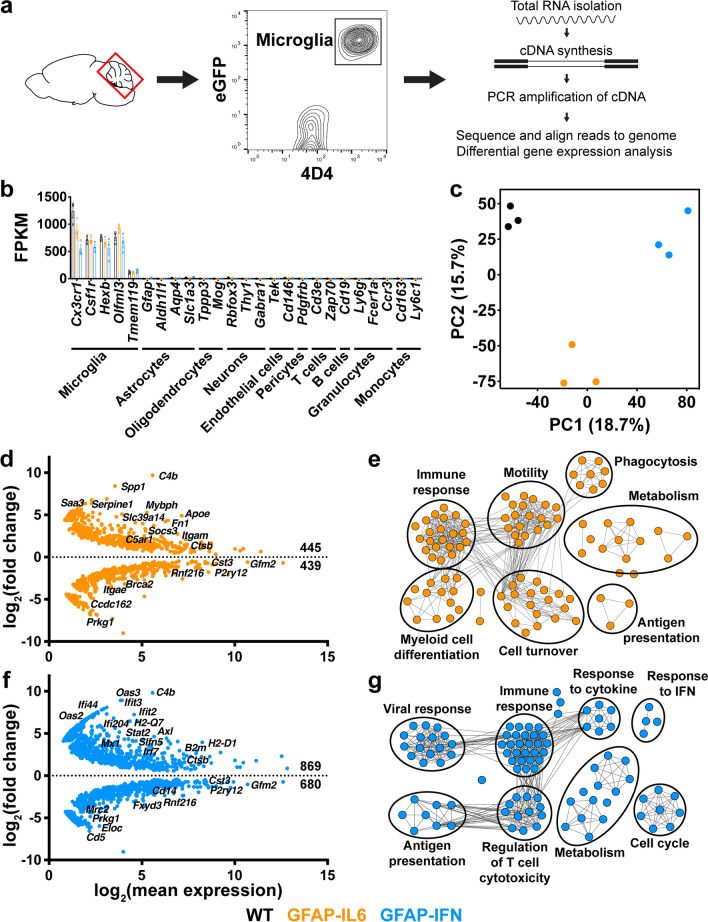
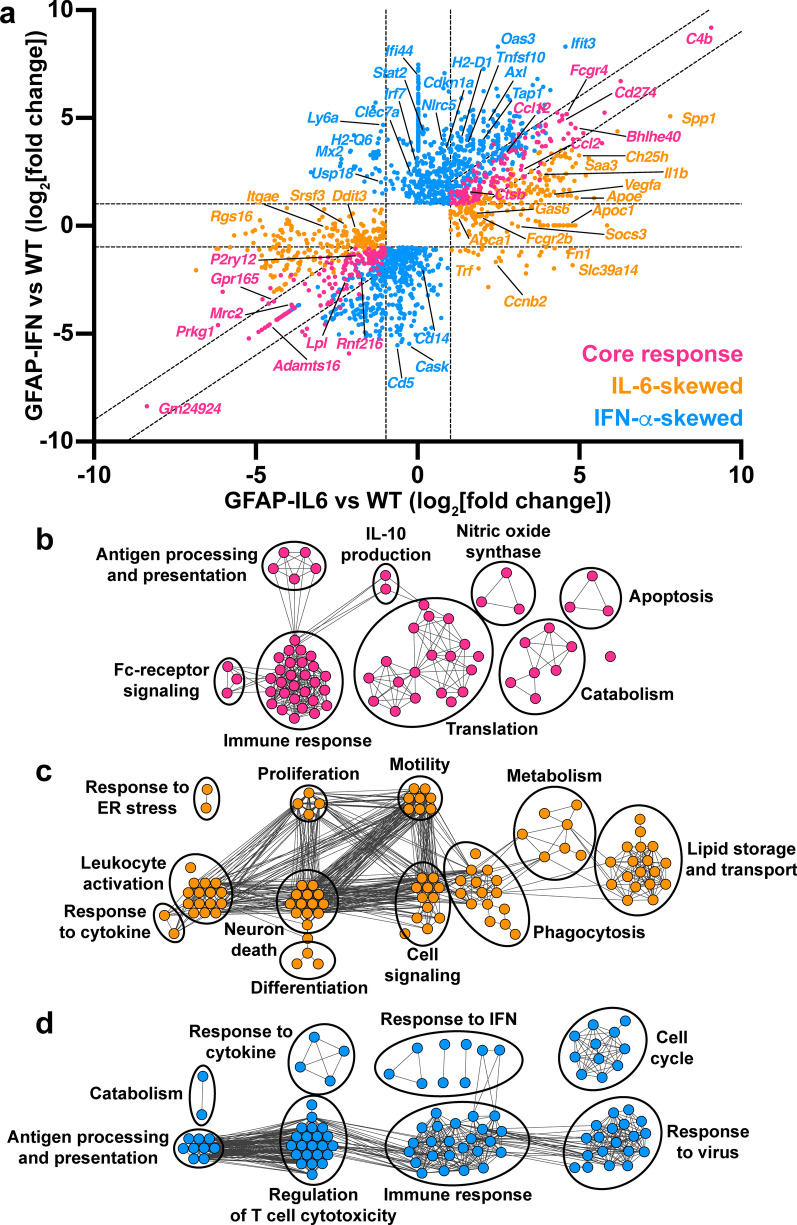
Methods: Here, we used a combination of ex vivo and in situ techniques to characterize the molecular, cellular and transcriptomic phenotypes of microglia in GFAP-IL6 versus GFAP-IFN mice. In addition, a transcriptomic meta-analysis was performed to compare the microglia response from GFAP-IL6 and GFAP-IFN mice to the response of microglia in a range of neurodegenerative and neuroinflammatory disorders.

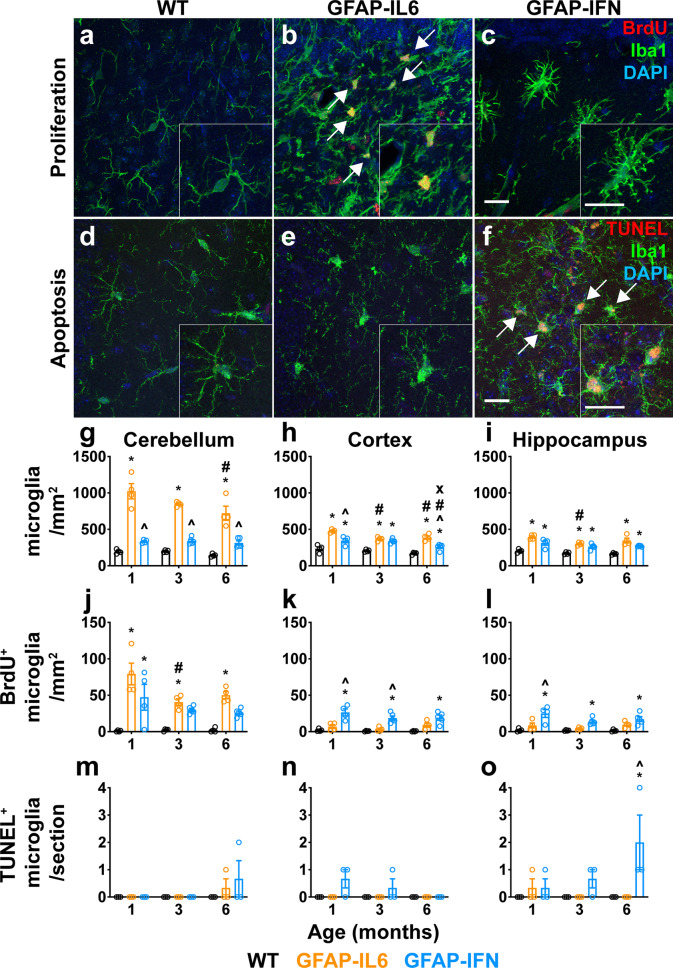
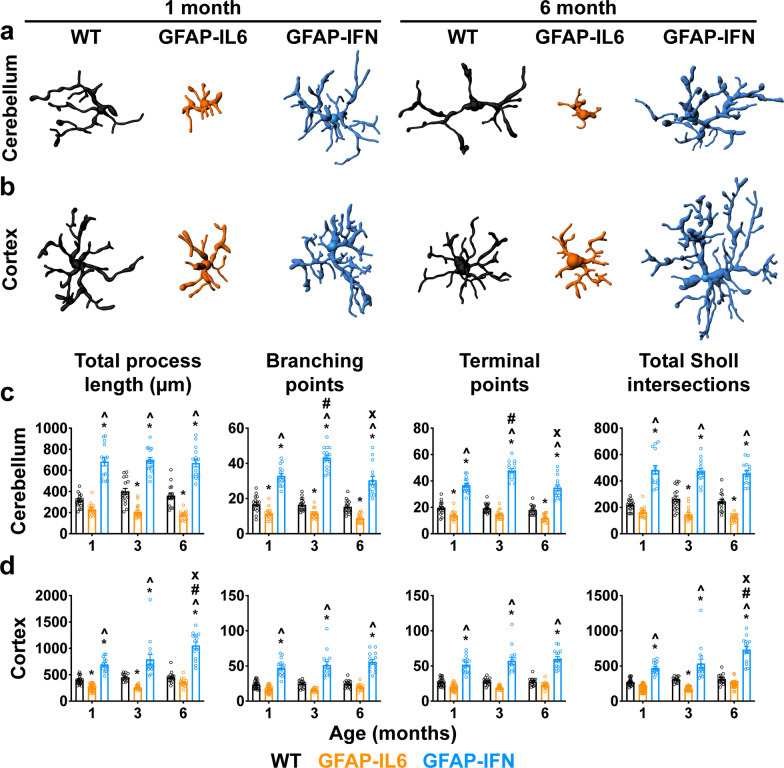
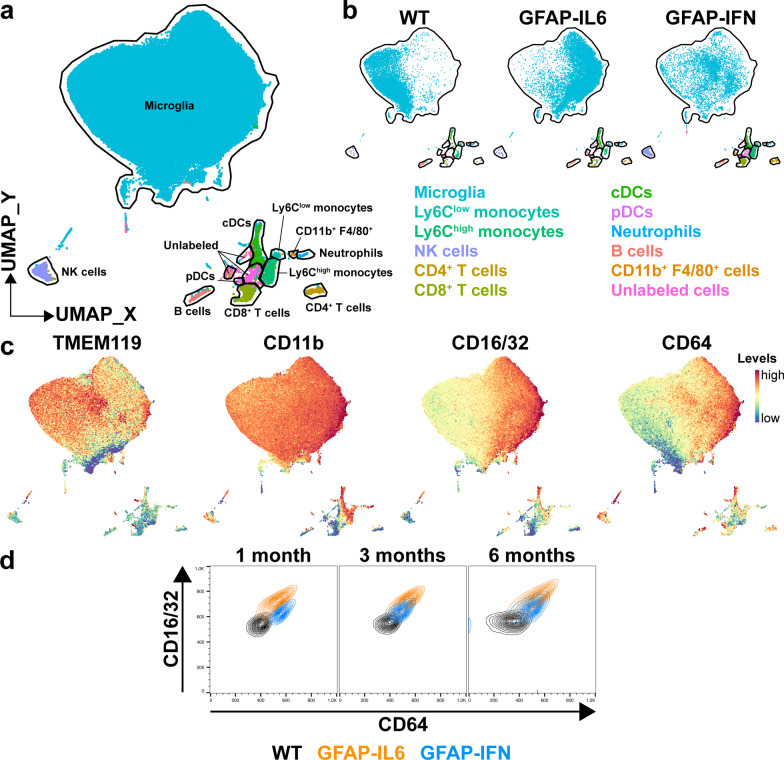
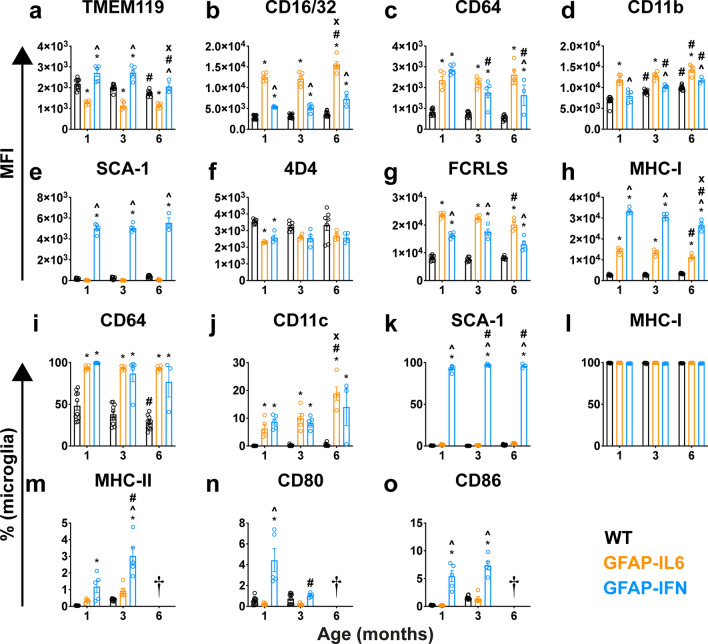
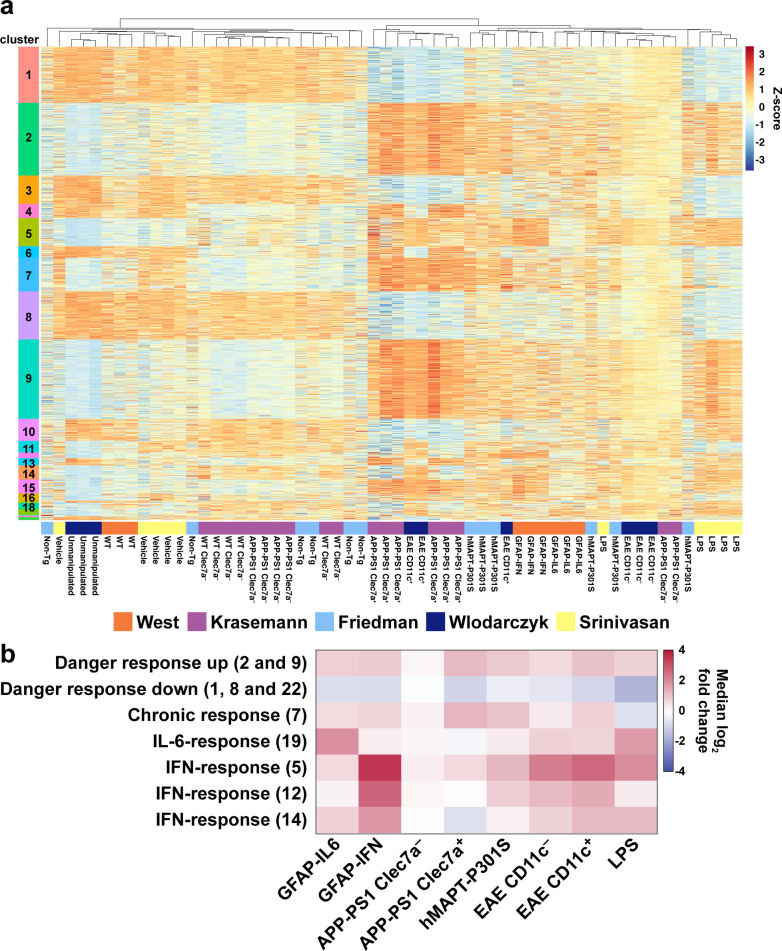
Results: We demonstrated that microglia show stimulus-specific responses to IL-6 versus IFN-α in the brain resulting in unique and extensive molecular and cellular adaptations. In GFAP-IL6 mice, microglia proliferated, had shortened, less branched processes and elicited transcriptomic and molecular changes associated with phagocytosis and lipid processing. In comparison, microglia in the brain of GFAP-IFN mice exhibited increased proliferation and apoptosis, had larger, hyper-ramified processes and showed transcriptomic and surface marker changes associated with antigen presentation and antiviral response. Further, a transcriptomic meta-analysis revealed that IL-6 and IFN-α both contribute to the formation of a core microglia response in animal models of neurodegenerative and neuroinflammatory disorders, such as Alzheimer's disease, tauopathy, multiple sclerosis and lipopolysaccharide-induced endotoxemia.

Conclusions: Our findings demonstrate that microglia responses to IL-6 and IFN-α are highly stimulus-specific, wide-ranging and give rise to divergent phenotypes that modulate microglia responses in neuroinflammatory and neurodegenerative diseases.

Keywords: Central nervous system; Cytokine; Interferon-alpha; Interleukin-6; Microglia; Neuroinflammation; Phenotype.


Conflict of interest statement

B.G. is a director of Pacific Analytics PTY LTD & SMRTR PTY LTD, Australia, which had no role in the design, execution, analysis or preparation of the manuscript. O.B. has collaborations with Sanofi, GSK, Regulus Therapeutics; research funding from Sanofi, GSK, miRagen Therapeutics, honoraria for lectures, consultancy: Camp4. The other authors declare no other competing interests.

Figures

Fig. 1
Fig. 1
Microglia in the brain of GFAP-IL6 versus GFAP-IFN mice have unique turnover patterns. a–c Representative immunofluorescence images (Iba1+ microglia, green; BrdU+, red; DAPI, blue) from the cerebellum of 1-month-old WT (a), GFAP-IL6 (b) and GFAP-IFN (c) mice. d–f Representative images (Iba1+ microglia, green; TUNEL+, red; DAPI, blue) from the hippocampus of 6-month-old WT (d), GFAP-IL6 (e) and GFAP-IFN (f) mice. Scale bars, 20 μm. g–o Quantification of the total number of Iba1+ microglia per mm2 (g-i), the number of Iba1+BrdU+ microglia per mm2 (j–l) and the number of Iba1+TUNEL+ apoptotic microglia per section (m–o) in the cerebellum (g, j, m), cortex (h, k, n) and hippocampus (i, l, o) at 1, 3 and 6 months of age. n = 3–5 mice/group. Graphs show individual values per mouse and mean ± SEM. *, p < 0.05 compared with WT of the same age; ^, p < 0.05 compared with GFAP-IL6 of the same age; #, p < 0.05 compared with 1-month-old of the same genotype; x, p < 0.05 compared with 3-month-old of the same genotype using two-way ANOVA with Tukey’s post-test
Fig. 2
Fig. 2
Microglia have distinct morphologies in GFAP-IL6 versus GFAP-IFN mice. a-b Representative three-dimensional reconstructions of Iba1+ microglia from the cerebellum (a) and cortex (b) of 1- and 6-month-old WT, GFAP-IL6 and GFAP-IFN mice. c-d Imaris automated quantification of the total process length, branching points, terminal points and total Sholl intersections of cerebellar (c) and cortical (d) microglia. n = 2–3 mice/group, n = 15–31 cells/genotype. Graphs show individual values per cell and mean ± SEM. *, p < 0.05 compared with WT of the same age; ^, p < 0.05 compared with GFAP-IL6 of the same age; #, p < 0.05 compared with 1-month-old of the same genotype; x, p < 0.05 compared with 3-month-old of the same genotype using two-way ANOVA with Tukey’s post-test
Fig. 3
Fig. 3
Cerebellar microglia regulate distinct subsets of genes in response to the cytokine environments induced by chronic IL-6 versus IFN-α signaling. a Microglia were isolated from the cerebellum of 1-month-old MacGreen-WT, -GFAP-IL6 and -GFAP-IFN mice and purified by FACS of live eGFP+ 4D4+ cells. RNA was isolated and reverse transcribed into cDNA, which was then amplified by PCR and sequenced. b Fragments per kilobase of transcript per million mapped reads (FPKM) of cell type-specific genes for microglia, other CNS-resident cells and peripheral leukocytes. c PCA of RNA-seq datasets of cerebellar microglia from WT, GFAP-IL6 and GFAP-IFN mice. d MA plot (representing log-ratio (M) on the y-axis and mean average (A) on the x-axis) showing transcripts differentially expressed by GFAP-IL6 cerebellar microglia compared with WT microglia. e Enrichment map of enriched GO biological processes by WebGestalt generated from the IL-6-regulated DEGs. f MA plot showing transcripts differentially expressed by GFAP-IFN cerebellar microglia compared with WT microglia. g Enrichment map of enriched GO biological processes by WebGestalt generated from the IFN-α-regulated DEGs. For d, f, the number of significantly (FDR < 0.05) upregulated and downregulated genes are indicated. For e, g, nodes in enrichment maps are significantly enriched in GO lists (FDR < 0.05) and were used to name clusters. n = 3 mice/group
Fig. 4
Fig. 4
Microglia in GFAP-IL6 versus GFAP-IFN mice acquire unique transcriptional programs in addition to a common set of core response genes. a Two-way fold-change plot of differentially expressed genes in GFAP-IL6 versus WT microglia and GFAP-IFN versus WT microglia to identify core response genes (pink), as well as IL-6-skewed (orange) and IFN-α-skewed (blue) genes. b Enrichment map of top 100 significantly enriched GO biological processes by WebGestalt generated from the DEGs that are commonly upregulated by IL-6 and IFN-α. c Enrichment map of top 100 significantly enriched GO biological processes by WebGestalt generated from the DEGs that are upregulated and IL-6-skewed. d Enrichment map of top 100 enriched GO biological processes by WebGestalt generated from the DEGs that are upregulated and IFN-α-skewed. For b–d, nodes in enrichment maps are significantly enriched in GO lists (FDR < 0.05) and were used to name clusters
Fig. 5
Fig. 5
Distinct global leukocyte landscapes in the brain of GFAP-IL6 versus GFAP-IFN mice. a UMAP plot of entire dataset (brains of MacGreen-WT, -GFAP-IL6 and -GFAP-IFN mice at 1, 3 and 6 months of age) labeled with FlowSOM cluster identities. b UMAP plots of the 6-month-old dataset split into WT, GFAP-IL6 and GFAP-IFN mice. c UMAP plots of the same dataset colored by the expression of TMEM119, CD11b, CD16/32 or CD64. d Cluster overlay of CD16/32 versus CD64 levels on the surface of microglia from the brains of WT, GFAP-IL6 and GFAP-IFN mice at 1, 3 and 6 months of age. n = 3–5 mice/group
Fig. 6
Fig. 6
Microglia in the brain of GFAP-IL6 versus GFAP-IFN mice have unique surface marker expression profiles. a–e From 1-, 3- and 6-month-old MacGreen-WT, -GFAP-IL6 and -GFAP-IFN mice, microglia were gated (live eGFP+ CD45low CD11b+ Ly6C TMEM119+ cells) and the median fluorescence intensity (MFI) was quantified for a TMEM119, b CD16/32, c CD64, d CD11b and e SCA-1 levels. f–h In a separate experiment, microglia were gated (live eGFP+ CD11b+ 4D4+ cells or live eGFP+ CD11b+ FCRLS+ cells) and the MFI was quantified for f 4D4, g FCRLS and h MHC-I levels. i-o Percentages of microglia positive for i CD64, j CD11c, k SCA-1, l MHC-I, m MHC-II, n CD80 and o CD86. n = 3–5 mice/group. Graphs show individual values per mouse and mean ± SEM. *, p < 0.05 compared with WT; ^, p < 0.05 compared with GFAP-IL6; #, p < 0.05 compared with 1-month-old of same genotype; x, p < 0.05 compared with 3-month-old of same genotype using two-way ANOVA with Tukey’s post-test. † N.B. The results for 6-month-old microglia are not shown due to high autofluorescence interference and are therefore not reliable
Fig. 7
Fig. 7
Meta-analysis of microglia gene expression datasets identified core and cytokine-specific co-regulated gene clusters. a Heatmap of z-scores (within-study-normalized) for 1,759 genes differentially expressed in at least 4 comparisons. Hierarchical clustering identified 22 clusters of co-regulated genes. b Summary of gene set changes from the meta-analysis, which identified upregulated danger response genes (clusters 2 and 9), downregulated danger response genes (clusters 1, 8 and 22), chronic response genes (cluster 7), IL-6-response genes (cluster 19) and IFN-response genes (clusters 5, 12 and 14). Differential expression was calculated by comparing each condition with its respective control. The median log2-fold change for each gene cluster is shown

References

    1. Hofer MJ, Campbell IL. Immunoinflammatory diseases of the central nervous system - the tale of two cytokines. Br J Pharmacol. 2016;173(4):716–728. doi: 10.1111/bph.13175. - DOI - PMC - PubMed
    1. West PK, Viengkhou B, Campbell IL, Hofer MJ. Microglia responses to interleukin-6 and type I interferons in neuroinflammatory disease. Glia. 2019;67(10):1821–1841. - PubMed
    1. Wallach AI, Tremblay M, Kister I. Advances in the treatment of neuromyelitis optica spectrum disorder. Neurol Clin. 2021;39(1):35–49. doi: 10.1016/j.ncl.2020.09.003. - DOI - PubMed
    1. Crow YJ, Neven B, Frémond ML. JAK inhibition in the type I interferonopathies. J Allergy Clin Immunol. 2021;148(4):991–993. doi: 10.1016/j.jaci.2021.07.028. - DOI - PubMed
    1. Ma X, Kermode AG, Hu X, Qiu W. NMOSD acute attack: Understanding, treatment and innovative treatment prospect. J Neuroimmunol. 2020;348:577387. doi: 10.1016/j.jneuroim.2020.577387. - DOI - PubMed

Publication types

LinkOut - more resources