. 2022 Jul;16(7):1853-1863.
doi: 10.1038/s41396-022-01232-9. Epub 2022 Apr 16.

Ecological and genomic responses of soil microbiomes to high-severity wildfire: linking community assembly to functional potential

Affiliations

Ecological and genomic responses of soil microbiomes to high-severity wildfire: linking community assembly to functional potential

Nicholas C Dove et al. ISME J. 2022 Jul.

Abstract

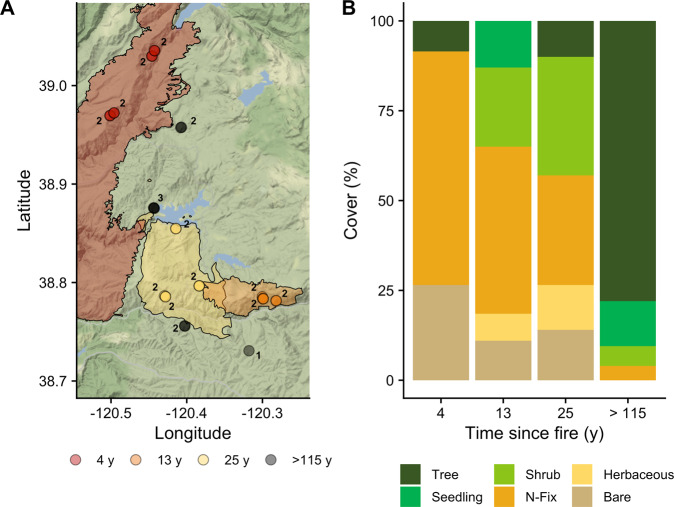
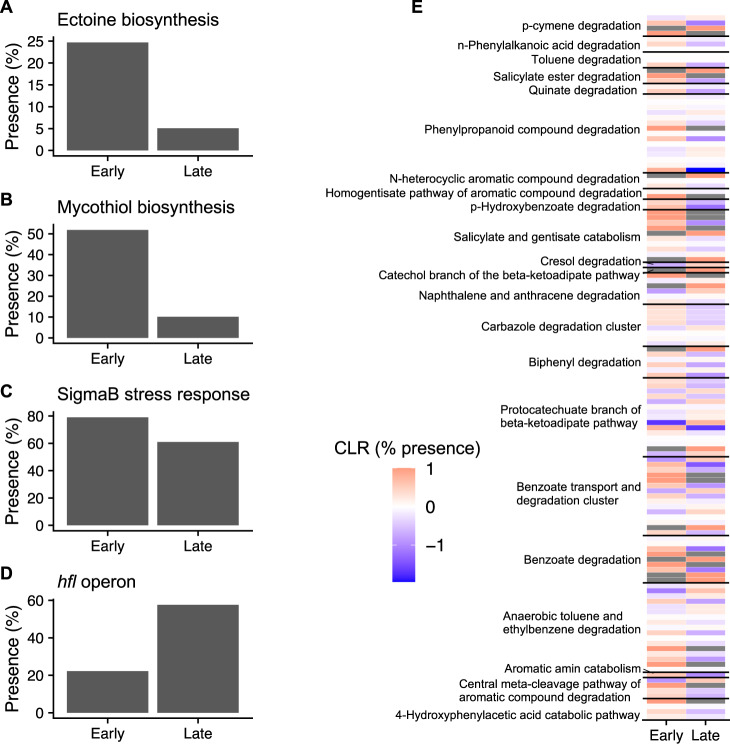
Increasing wildfire severity, which is common throughout the western United States, can have deleterious effects on plant regeneration and large impacts on carbon (C) and nitrogen (N) cycling rates. Soil microbes are pivotal in facilitating these elemental cycles, so understanding the impact of increasing fire severity on soil microbial communities is critical. Here, we assess the long-term impact of high-severity fires on the soil microbiome. We find that high-severity wildfires result in a multi-decadal (>25 y) recovery of the soil microbiome mediated by concomitant differences in aboveground vegetation, soil chemistry, and microbial assembly processes. Our results depict a distinct taxonomic and functional successional pattern of increasing selection in post-fire soil microbial communities. Changes in microbiome composition corresponded with changes in microbial functional potential, specifically altered C metabolism and enhanced N cycling potential, which related to rates of potential decomposition and inorganic N availability, respectively. Based on metagenome-assembled genomes, we show that bacterial genomes enriched in our earliest site (4 y since fire) harbor distinct traits such as a robust stress response and a high potential to degrade pyrogenic, polyaromatic C that allow them to thrive in post-fire environments. Taken together, these results provide a biological basis for previously reported process rate measurements and explain the temporal dynamics of post-fire biogeochemistry, which ultimately constrains ecosystem recovery.


Conflict of interest statement

The authors declare no competing interests.

Figures

Fig. 1
Fig. 1. Map of the Central Sierra Nevada Fire Chronosequence (adapted from Dove et al. [13]).
A Symbols denote approximate locations of plots and polygons show fire perimeters. Plots are at least 150 m apart and may not be visibly distinguishable at the spatial scale. Numbers next to points indicate how many plots are in the general location indicated by the points. B Mean percent plant cover types for each chronosequence site. Cover types are tree (Abies concolor, Pinus ponderosa, Quercus spp.), tree seedling (Pinus ponderosa), shrub (Arctostaphylos spp., Salix spp.), nitrogen-fixing plant (N-Fix; Ceanothus spp., Chamaebatia foliolosa), herbaceous (Carex spp., Poaceae), and bare soil.
Fig. 2
Fig. 2. Controls on microbial community composition in the Sierra Nevada Fire Chronosequence.
Distance-based redundancy analysis (dbRDA) ordination of prokaryote (A) and fungal (B) community composition along the variables: soil total carbon (C), total nitrogen (N), resin-available nitrate, resin-available ammonium, resin-available phosphate (PO43−), soil pH (1:2 w/v 0.01 M CaCl2), and water holding capacity (WHC). Only significant (p < 0.05) edaphic variables are plotted. Soil measurements are from Dove et al. [13] using the same samples used for molecular analyses. Points represent individual samples and are coded by time since fire and cover type based on color and shape, respectively. Vectors represent the direction and magnitude (indicated by vector length) of correlations of environmental variables with the first two axes of the dbRDA. Percentage in parentheses quantifies the variance explained by each axis. Note different axis scales. C Mean (and standard error, 4-y: n = 13, 13-y: n = 23, 25-y: n = 34, >115-y: n = 20) of whole-community prokaryote β-nearest taxon index (βNTI) within each time point, which quantifies the magnitude and direction of deviation between the observed null phylogenetic turnover distribution, plotted as a function of time since fire. Greater homogenous selection is indicated by decreasing βNTI. D The relative dominance of assembly processes calculated with the phylogenetic bin approach [37] for prokaryotes within each time point (variable selection is difficult to view at the scale of the figure).
Fig. 3
Fig. 3. Distribution and composition of carbohydrate-active enzymes (CAZy) genes across the fire chronosequence.
A Total abundance of CAZy genes, corrected by amino acid (AA) coding reads, are represented by boxplots, as a function of time since fire. B Differences in the composition of CAZy genes are represented using Principal Coordinates Analysis (PCoA) on proportionally normalized data with Bray-Curtis dissimilarities, and percentage in parentheses quantifies the variance explained by each axis. C Boxplots representing the normalized abundance of functionally classified CAZy genes as a function of time since fire. The orange lines represent the best-fit linear regressions where significant (Spearman correlation: p < 0.05, n = 4) relationships occur. Note different Y-axis scales.
Fig. 4
Fig. 4. Genetic capacity for carbon degradation correlates with carbon dioxide (CO2) emissions.
A Correlation between total abundance of carbohydrate-active enzymes (CAZy) genes, corrected by amino acid (AA) coding reads and multiplied by microbial biomass (MBC) with time since fire. B Correlation between cumulative CO2 emissions during a 28-day laboratory incubation with normalized CAZy abundance. The orange lines represent the best-fit linear regressions where significant (Spearman correlation: p < 0.05, n = 4) relationships occur.
Fig. 5
Fig. 5. Nitrogen (N) cycling potential of the Central Sierra Nevada Fire Chronosequence.
For each pathway, colored circles represent average log2(fold change) among sites relative to the >115 y site (A). Key: amo—ammonium monooxygenase (EC 1.14.99.39), nap—nitrate reductase (EC 1.7.1.2), nar—nitrate reductase (EC 1.7.99.4), nif—nitrogenase (EC 1.18.6.1), nirB/D—nitrite reductase large/small subunit (EC 1.7.1.15), nirK/S, nor—nitrite reductase precursor (EC 1.7.2.1), nos—nitric oxide synthase (EC 1.14.13.39), nrf—cytochrome c nitrite reductase (EC (1.7.2.2), nxr—nitrite oxidoreductase (EC 1.7.5.1). Conceptual model of N cycling as a function of time since fire (B). Lines represent relative differences in inorganic N, the relative genetic potential for nitrification, and the relative genetic potential for denitrification with time since fire. The absolute value at each point on these lines is inconsequential, and as such, meaning is derived from the relative pattern with time since fire.
Fig. 6
Fig. 6. Taxonomy and estimated growth rates of early and late successional metagenome-assembled genomes (MAGs).
AThe MAGs were classified into early or late-successional groups indicated by their center log-ratio (CLR) transformed abundance with time since fire. B Mean (±standard error, n = 4) growth rate index of MAGs as a function of time since fire. C Mean (±standard error) growth rate index across all time points of MAGs classified as either early or late-successional (early: n = 82, late: n = 59).
Fig. 7
Fig. 7. Traits of early and late successional metagenome-assembled genomes (MAGs).
A–D Percent presence of stress-related genes. E Heatmap of differentially present genes (χ2 test—p < 0.05, early: n = 82, late: n = 59) within major pathways of aromatic carbon degradation. Colors represent center log ratio (CLR) of percent presence for each gene; gray tiles represent genes that were absent in a specific successional group (i.e., CLR = undefined). Genes within major pathways of aromatic carbon degradation are described in Table S5.

References

    1. Bond WJ, Woodward FI, Midgley GF. The global distribution of ecosystems in a world without fire. N Phytol. 2005;165:525–38. doi: 10.1111/j.1469-8137.2004.01252.x. - DOI - PubMed
    1. Stephens SL, Burrows N, Buyantuyev A, Gray RW, Keane RE, Kubian R, et al. Temperate and boreal forest mega-fires: characteristics and challenges. Front Ecol Environ. 2014;12:115–22. doi: 10.1890/120332. - DOI
    1. Adams MA. Mega-fires, tipping points and ecosystem services: managing forests and woodlands in an uncertain future. Ecol Manag. 2013;294:250–61. doi: 10.1016/j.foreco.2012.11.039. - DOI
    1. McLauchlan KK, Higuera PE, Miesel J, Rogers BM, Schweitzer J, Shuman JK, et al. Fire as a fundamental ecological process: research advances and frontiers. J Ecol. 2020;108:2047–69. doi: 10.1111/1365-2745.13403. - DOI
    1. Whitman T, Whitman E, Woolet J, Flannigan MD, Thompson DK, Parisien M-A. Soil bacterial and fungal response to wildfires in the Canadian boreal forest across a burn severity gradient. Soil Biol Biochem. 2019;138:107571. doi: 10.1016/j.soilbio.2019.107571. - DOI

Publication types