. 2022 Apr 17;10(1):62.
doi: 10.1186/s40168-022-01255-6.

The microbiota-gut-brain axis participates in chronic cerebral hypoperfusion by disrupting the metabolism of short-chain fatty acids

Affiliations

The microbiota-gut-brain axis participates in chronic cerebral hypoperfusion by disrupting the metabolism of short-chain fatty acids

Weiping Xiao et al. Microbiome. .

Erratum in

Abstract

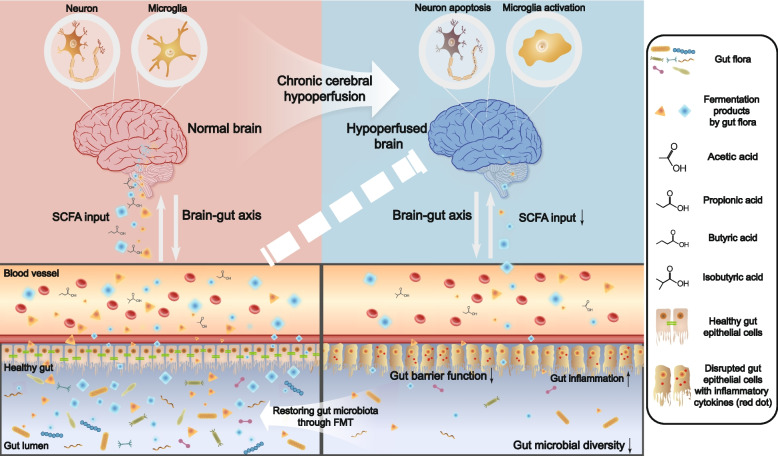
Background: Chronic cerebral hypoperfusion (CCH) underlies secondary brain injury following certain metabolic disorders and central nervous system (CNS) diseases. Dysregulation of the microbiota-gut-brain axis can exacerbate various CNS disorders through aberrantly expressed metabolites such as short-chain fatty acids (SCFAs). Yet, its relationship with CCH remains to be demonstrated. And if so, it is of interest to explore whether restoring gut microbiota to maintain SCFA metabolism could protect against CCH.

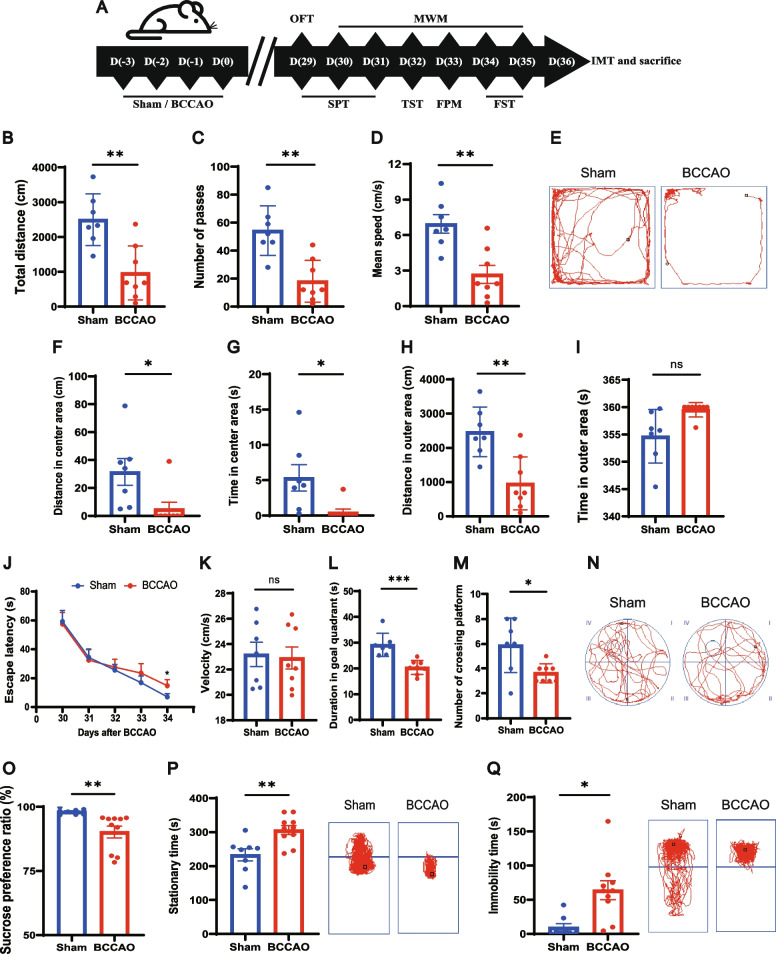
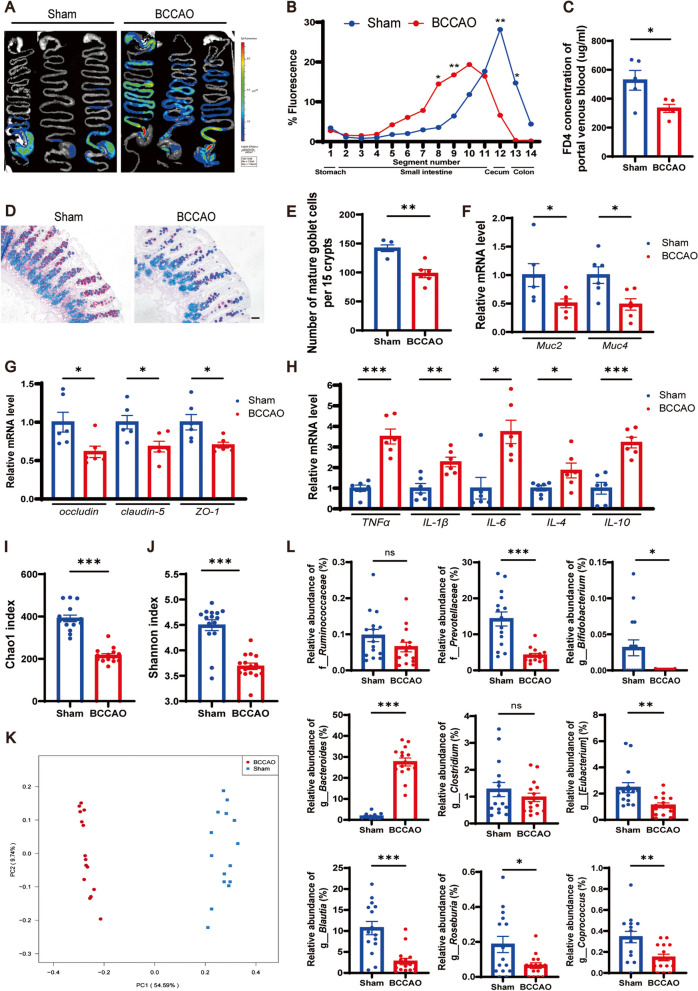
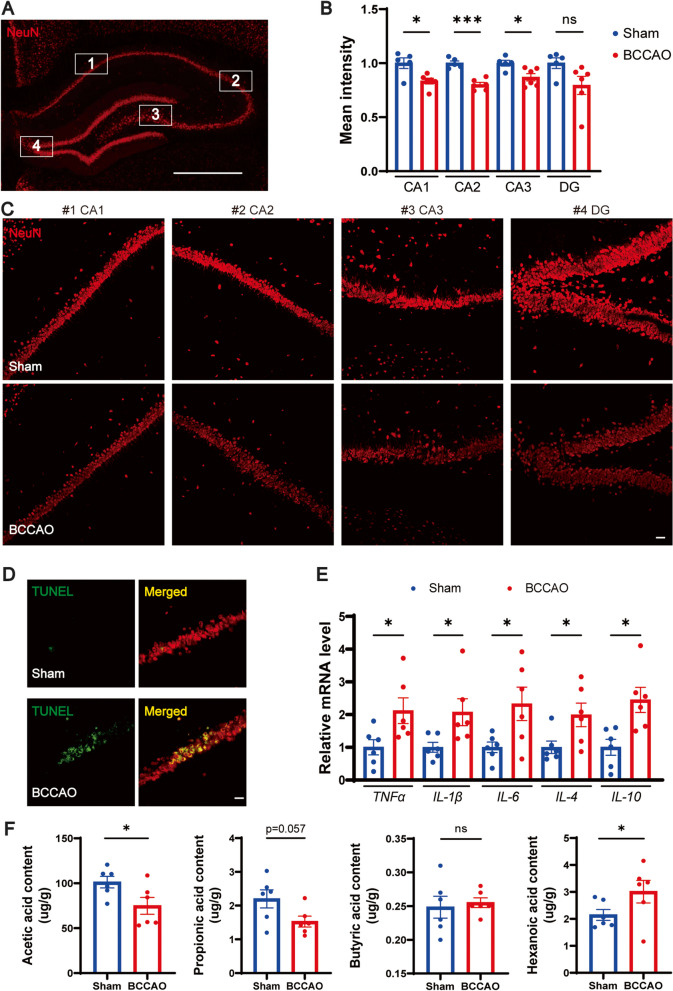
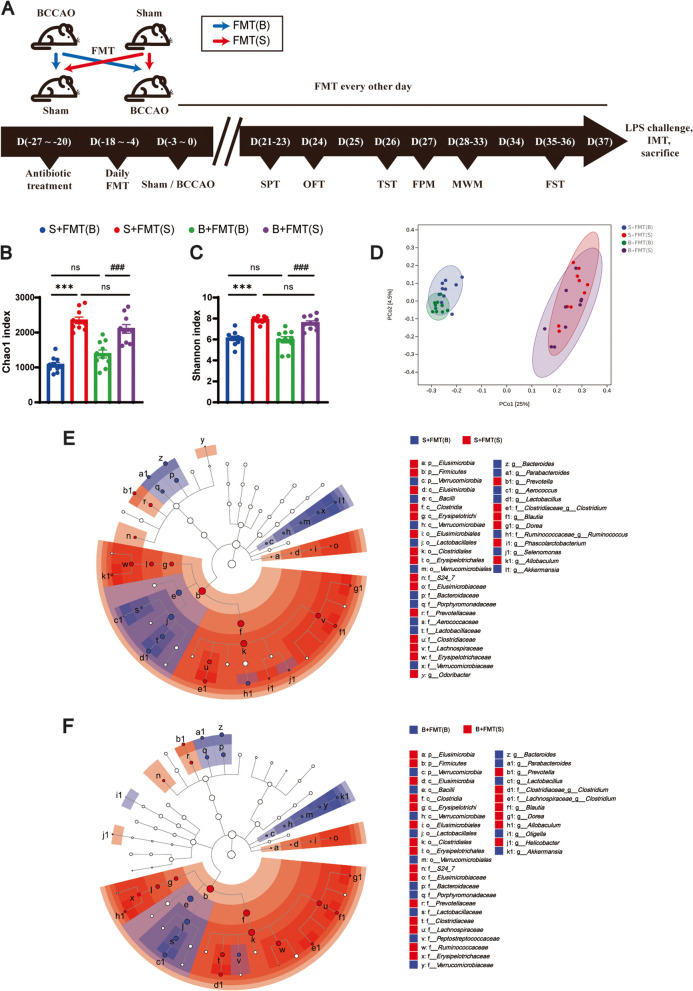
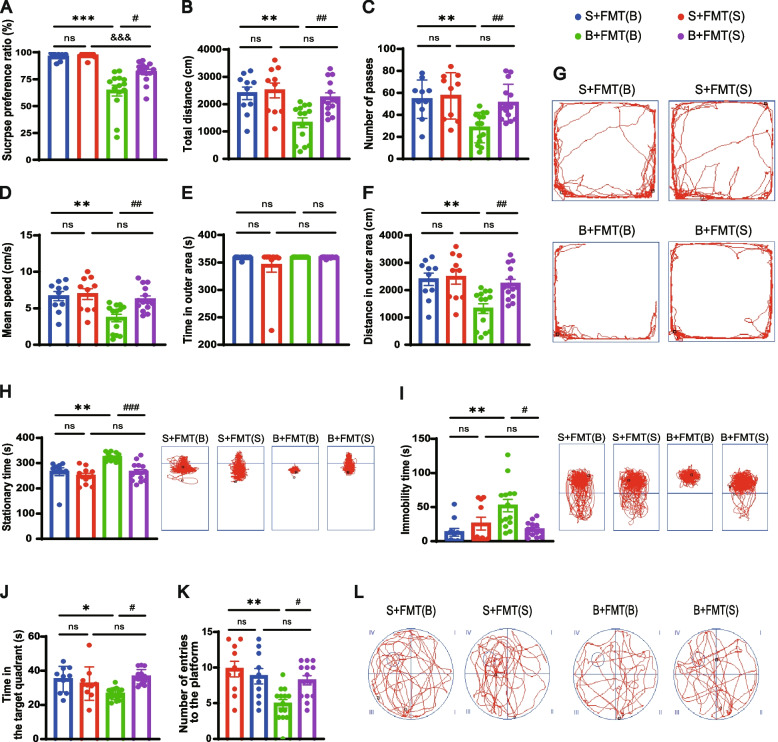
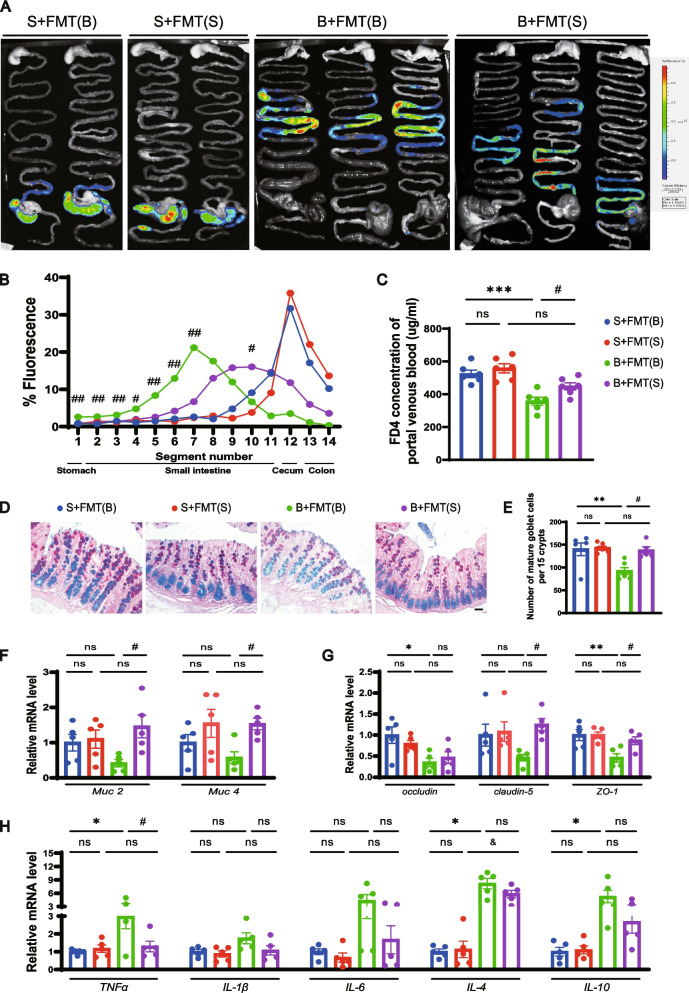
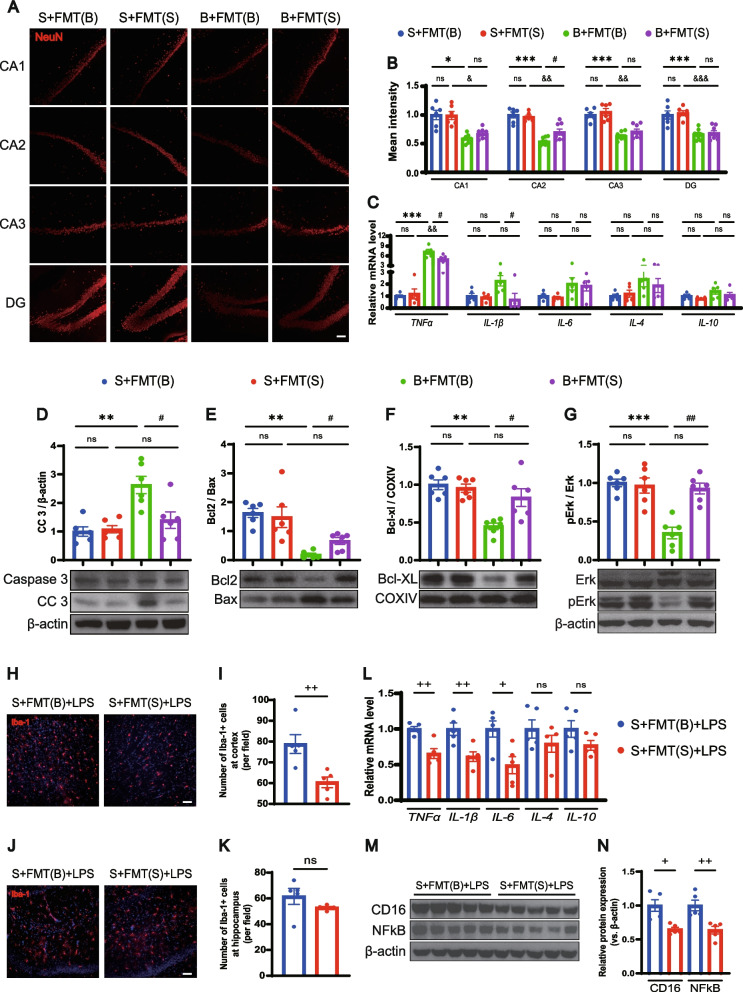
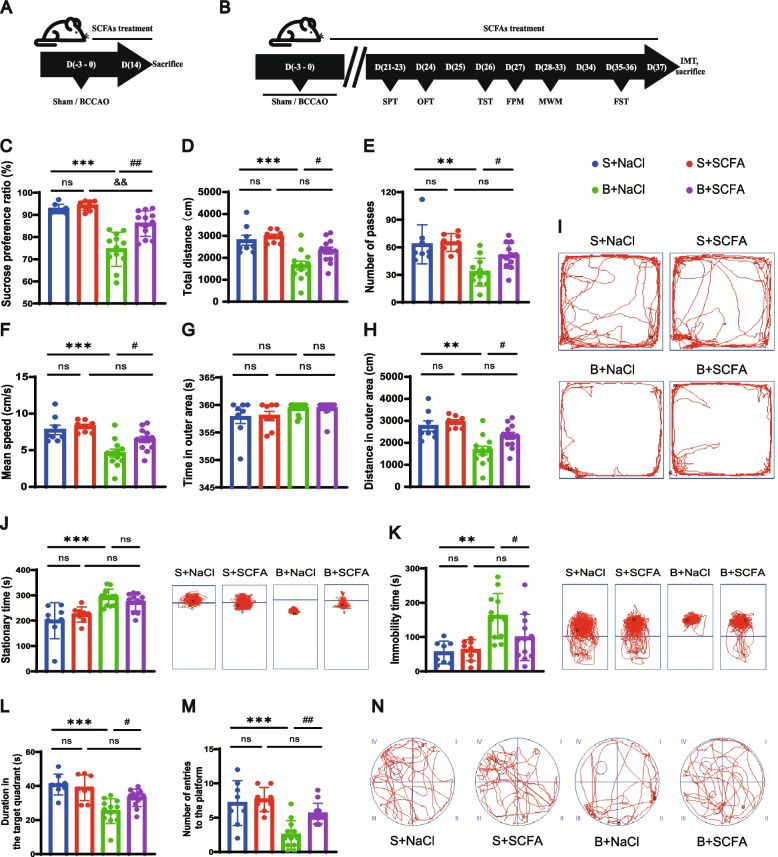
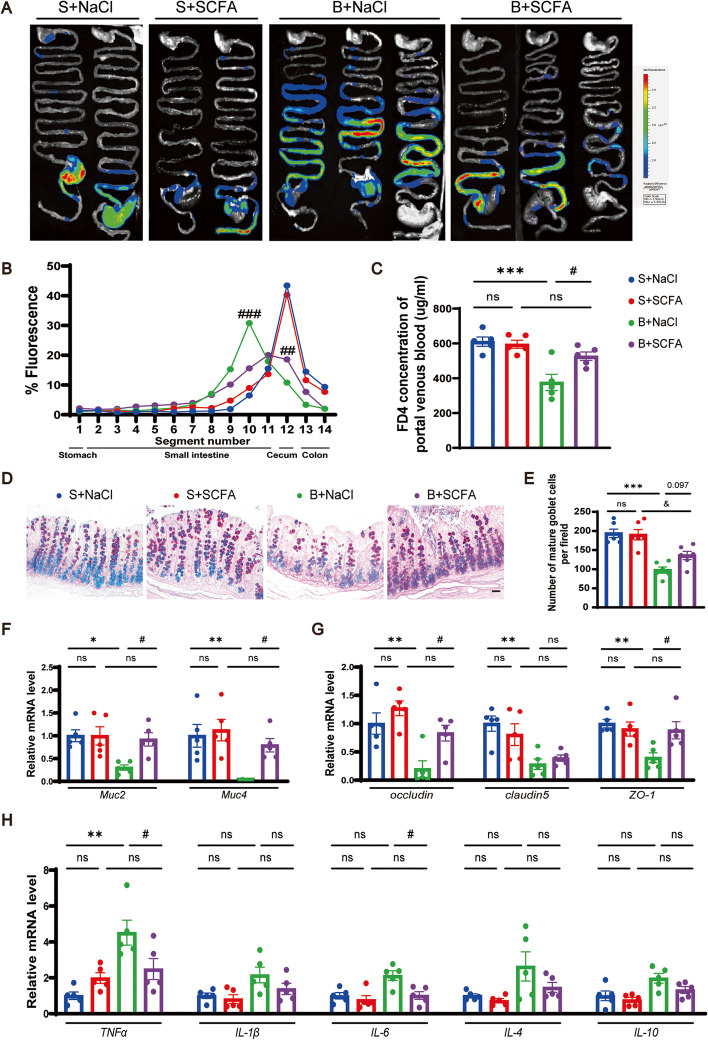
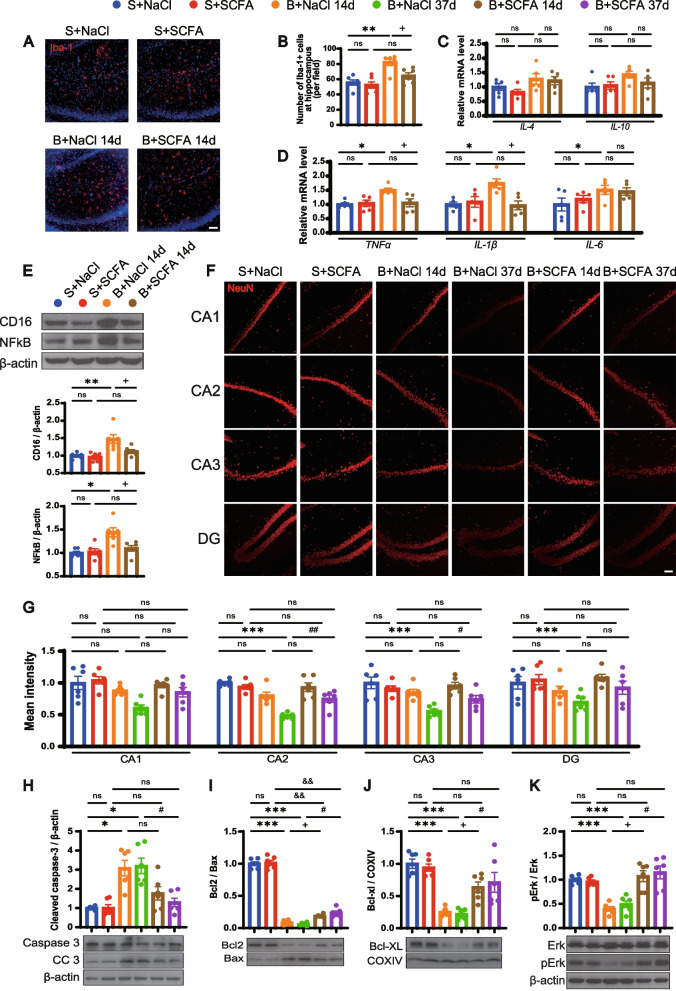
Results: Rats subjected to bilateral common carotid artery occlusion (BCCAO) as a model of CCH exhibited cognitive impairment, depressive-like behaviors, decreased gut motility, and compromised gut barrier functions. The 16S ribosomal RNA gene sequencing revealed an abnormal gut microbiota profile and decreased relative abundance of some representative SCFA producers, with the decreased hippocampal SCFAs as the further evidence. Using fecal microbiota transplantation (FMT), rats recolonized with a balanced gut microbiome acquired a higher level of hippocampal SCFAs, as well as decreased neuroinflammation when exposed to lipopolysaccharide. Healthy FMT promoted gut motility and gut barrier functions, and improved cognitive decline and depressive-like behaviors by inhibiting hippocampal neuronal apoptosis in BCCAO rats. Long-term SCFA supplementation further confirmed its neuroprotective effect in terms of relieving inflammatory response and hippocampal neuronal apoptosis following BCCAO.

Conclusion: Our results demonstrate that modulating the gut microbiome via FMT can ameliorate BCCAO-induced gut dysbiosis, cognitive decline, and depressive-like behaviors, possibly by enhancing the relative abundance of SCFA-producing floras and subsequently increasing SCFA levels. Video abstract.

Keywords: Chronic cerebral hypoperfusion; Fecal microbiota transplantation; Gut dysbiosis; Gut microbiota; Short-chain fatty acids.


Conflict of interest statement

The authors declare that they have no competing interests.

Figures

Fig. 1
Fig. 1
BCCAO induces spatial learning and memory impairments and depressive-like behaviors. A Timeline of the experiment (BCCAO, bilateral common carotid artery occlusion. OFT, open-field test. MWM, Morris water maze test. SPT, sucrose preference test. TST, tail suspension test. FPM, fecal paraments measurement. FST, forced swim test. IMT, intestinal motility test). BI Open-field test (n = 7 Sham, n = 8 BCCAO): B The total distance traveled by rats in the open field. C The frequency of grid-crossing. D The mean traveling speed. E Representative traces in the open-field test. Circle dot: start position; square dot: end position. F Distance traveled in the center area. G Time spent in the center area. H Distance traveled in the outer area. I Time spent in the outer area. J-N Morris water maze test (n = 7 Sham, n = 8 BCCAO): J Escape latency during the 5-day training period. K Mean speed in water in the spatial probe test. L Time spent in and M frequency of visits to the quadrant where the platform had previously been located. N Representative traces in the spatial probe test (the platform was previously located in the center of quadrant IV). Circle dot: start position; square dot: end position. O Sucrose preference test (n = 8 Sham, n = 10 BCCAO): percentage of sucrose water intake. P, Q Duration of immobility and representative traces in the tail suspension test (P) and forced swim test (Q) (n = 8 Sham, n = 10 BCCAO). The data represent the mean ± SEM, p < 0.05 was set as the threshold for significance. * p < 0.05, ** p < 0.01, *** p < 0.001 compared to the sham group
Fig. 2
Fig. 2
BCCAO disrupts gut function and microbial ecology. AC Intestinal motility test (n = 5/group): A Representative images and B quantitative analysis showing the distribution of fluorescein isothiocyanate-dextran in gastrointestinal segments. C Concentration of fluorescein isothiocyanate-dextran in portal venous blood. D Alcian blue and periodic acid-Schiff (AB-PAS)-stained mature goblet cells from colon sections, and E calculation of mature goblet cells per 15 upper crypts/rat (n = 5 Sham, n = 6 BCCAO). Scale bar, 20 μm. F-H mRNA levels of mucins (Muc2, Muc4), tight junction proteins (occludin, claudin-5, and ZO-1), and inflammatory cytokines (TNF-α, IL-1β, IL-6, IL-4, and IL-10) in colon cells (n = 6/group). I, J Comparison of Chao1 index (I) and Shannon index (J) between the groups (n = 15/group). K Principal coordinate analysis (PCoA) plot established based on unweighted UniFrac distance (n = 15/group). L Bar plots of the relative abundance of f_Ruminococcaceae and f_Prevotellaceae and g_Bifidobacterium, g_Bacteroides, g_Clostridium, g_[Eubacterium], g_Blautia, g_Roseburia, and g_Coprococcus (n = 15/group). The data represent the mean ± SEM, p < 0.05 was set as the threshold for significance. * p < 0.05, ** p < 0.01, *** p < 0.001 compared to the sham group
Fig. 3
Fig. 3
BCCAO causes hippocampal injury, neuroinflammation, and SCFA metabolic disorder. AC Quantitative analysis of hippocampal neurons via immunofluorescence staining: A Immunofluorescence staining of hippocampal neuron. Scale bar, 1 mm. B Bar plots showing the mean fluorescence intensity (n = 5 Sham, n = 6 BCCAO) and C representative images of the cornu ammonis (CA) 1, CA2, CA3, and dentate gyrus (DG) zones. Scale bar, 50 μm. D TUNEL staining of hippocampal neurons. Scale bar, 30 μm. E mRNA levels of inflammatory cytokines (TNF-α, IL-1β, IL-6, IL-4, and IL-10) in the hippocampus (n = 6/group). F Bar plots showing hippocampal levels of acetic acid, propionic acid, butyric acid, and hexanoic acid (n = 6/group). The data represent the mean ± SEM, p < 0.05 was set as the threshold for significance. * p < 0.05, *** p < 0.001 compared to the sham group
Fig. 4
Fig. 4
Fecal microbiota transplantation successfully establishes a varied gut microbiota profile. A Timeline of fecal microbiota transplantation (FMT) from BCCAO or sham animals to recipient rats (Blue arrows, FMT using fecal supernatant from BCCAO rats. Red arrows, healthy FMT using fecal supernatant from sham rats). B, C Comparison of the Chao1 index (B) and Shannon index (C) among the four groups (n = 10/group). D PCoA plot established based on the unweighted UniFrac distance (n = 10/group). E, F Representation of bacterial profiles in sham (E) and BCCAO (F) rats after receiving FMT by linear discriminant analysis coupled with effect size (n = 10/group). S+FMT(B), sham rats received BCCAO-rat-derived fecal microbiota transplantation. S+FMT(S), sham rats received sham-rat-derived fecal microbiota transplantation. B+FMT(B), BCCAO rats received BCCAO-rat-derived fecal microbiota transplantation. B+FMT(S), BCCAO rats received sham-rat-derived fecal microbiota transplantation. The data represent the mean ± SEM. p < 0.05 was set as the threshold for significance. *** p < 0.001 compared to the S+FMT(B) group. ###p < 0.001 compared to the B+FMT(B) group
Fig. 5
Fig. 5
FMT alleviates depressive-like behaviors and cognitive decline post BCCAO. A Sucrose preference test. BG Open-field test: B The total distance traveled by rats in the open-field test. C The frequency of grid-crossing. D The mean traveling speed. E Time spent in the outer area. F Distance traveled in the outer area. G Representative traces in the open-field test. Circle dot: start position; square dot: end position. H, I Duration of immobility and representative traces in the tail suspension test (H) and forced swim test (I). J-L Morris water maze test: J Time spent in and K frequency of visits to the quadrant where the platform was previously located. L Representative traces in the spatial probe test (the platform was previously located in the center of quadrant IV). Circle dot: start position; square dot: end position. The data represent the mean ± SEM (n = 10 S+FMT(B) and S+FMT(S), n = 14 B+FMT(B) and B+FMT(S)). p < 0.05 was set as the threshold for significance. * p < 0.05, ** p < 0.01, *** p < 0.001 compared to the S+FMT(B) group. &&&p < 0.001 compared to the S+FMT(S) group. #p < 0.05, ##p < 0.01, ###p < 0.001 compared to the B+FMT(B) group
Fig. 6
Fig. 6
FMT improves gut motility and barrier functions in BCCAO rats. AC Intestinal motility test (n = 6/group): A Representative images and B quantitative analysis showing the distribution of fluorescein isothiocyanate-dextran in gastrointestinal segments. C Concentration of fluorescein isothiocyanate-dextran in portal venous blood. D AB-PAS-stained mature goblet cells from colon sections, and E calculation of mature goblet cells per 15 upper crypts/rat (n = 5-6/group). Scale bar, 20 μm. FH mRNA levels of mucins (Muc2, Muc4), tight junction proteins (occludin, claudin-5, and ZO-1), and inflammatory cytokines (TNF-α, IL-1β, IL-6, IL-4, and IL-10) in colon cells (n = 5/group). The data represent the mean ± SEM. p < 0.05 was set as the threshold for significance. * p < 0.05, ** p < 0.01, *** p < 0.001 compared to the S+FMT(B) group. &p < 0.05 compared to the S+FMT(S) group. #p < 0.05 compared to the B+FMT(B) group
Fig. 7
Fig. 7
FMT ameliorates BCCAO-induced hippocampal neuronal apoptosis and LPS-stimulated neuroinflammation. A Representative immunofluorescence images of hippocampal neurons in CA1, CA2, CA3, and DG zones. Scale bar, 50 μm. B Bar plots of the mean fluorescence intensity in the different groups (n = 6 S+FMT(B) and S+FMT(S), n = 8 B+FMT(B) and B+FMT(S)). C mRNA levels of inflammatory cytokines (TNF-α, IL-1β, IL-6, IL-4, and IL-10) in the hippocampus (n = 5/group). DG Western blot analysis for protein levels of caspase 3, cleaved caspase 3, Bcl2, Bax, Bcl-XL, Erk, and pErk and their quantification (band intensity normalized to β-actin or COXIV) in the hippocampus (n = 6/group). HK Representative immunofluorescence images showing Iba-1+ cells in the cortex (H) and hippocampus (J), and the quantification analysis (I, K) (n = 5/group). Scale bar, 50 μm. L mRNA levels of inflammatory cytokines (TNF-α, IL-1β, IL-6, IL-4, and IL-10) in the cortex (n = 5/group). M, N Protein levels of CD16 and NF-κB and their quantification (band intensity normalized to β-actin) in the cortex (n = 5/group). S+FMT(B)+LPS, sham rats treated with LPS after receiving BCCAO-rat-derived fecal microbiota transplantation. S+FMT(S)+LPS, sham rats treated with LPS after receiving sham-rat-derived fecal microbiota transplantation. The data represent the mean ± SEM. p < 0.05 was set as the threshold for significance. * p < 0.05, ** p < 0.01, *** p < 0.001 compared to the S+FMT(B) group. &p < 0.05, && p < 0.01, &&& p < 0.001 compared to the S+FMT(S) group. # p < 0.05, ##p < 0.01 compared to the B+FMT(B) group. +p < 0.05, ++p < 0.01 compared to the S+FMT(B)+LPS group
Fig. 8
Fig. 8
Long-term SCFA supplementation improves depressive-like behaviors and spatial memory after BCCAO. A, B Timeline of the experiment. C Sucrose preference test. DI Open-field test: D The total distance traveled by rats in the open field. E The frequency of grid-crossing. F The mean traveling speed. G Time spent in the outer area. H Distance traveled in the outer area. I Representative traces in the open-field test (Circle dot: start position; square dot: end position). J, K Duration of immobility and representative traces in the tail suspension test (J) and forced swim test (K). LN Morris water maze test: L Time spent in and M frequency of entries into the quadrant where the platform was previously located. N Representative traces in the spatial probe test (the platform was previously located in the center of quadrant IV). Circle dot: start position; square dot: end position). S+NaCl, sham rats treated with sodium chloride (NaCl). S+SCFA, sham rats that received short-chain fatty acids (SCFAs) (acetate, propionate, and butyrate) supplementation. B+NaCl, BCCAO rats treated with NaCl. B+SCFA, BCCAO rats received SCFAs supplementation. The data represent the mean ± SEM (n = 8 S+NaCl and S+SCFA, n = 12 B+NaCl and B+SCFA). p < 0.05 was set as the threshold for significance. ** p < 0.01, *** p < 0.001 compared to the S+NaCl group. &&p < 0.01 compared to the S+SCFA group. #p < 0.05, ##p < 0.01 compared to the B+NaCl group
Fig. 9
Fig. 9
Long-term SCFA supplementation ameliorates compromised gut motility and barrier functions in BCCAO rats. AC Intestinal motility test (n = 5/group): A Representative images and B quantitative analysis showing the distribution of fluorescein isothiocyanate-dextran in gastrointestinal segments. C Concentration of fluorescein isothiocyanate-dextran in portal venous blood. D AB-PAS-stained mature goblet cells from colon sections, and E calculation of mature goblet cells per 15 upper crypts/rat (n = 6/group). Scale bar, 20 μm. F-H mRNA levels of mucins (Muc2, Muc4), tight junction proteins (occludin, claudin-5, and ZO-1), and inflammatory cytokines (TNF-α, IL-1β, IL-6, IL-4, and IL-10) in colon cells (n = 5/group). The data represent the mean ± SEM. p < 0.05 was set as the threshold for significance. * p < 0.05, ** p < 0.01, *** p < 0.001 compared to the S+NaCl group. &p < 0.05 compared to the S+SCFA group. #p < 0.05 compared to the B+NaCl group
Fig. 10
Fig. 10
SCFA supplementation mitigates neuroinflammation and promotes neuronal survival in the hippocampus post BCCAO. A, B Representative immunofluorescence images showing Iba-1+ cells in the hippocampus at day 14 post BCCAO (A) and the quantification analysis (B) (n = 6/group). Scale bar, 50 μm. C, D mRNA levels of inflammatory cytokines (IL-4, IL-10, TNF-α, IL-1β, and IL-6) in the hippocampus at day 14 post BCCAO (n = 5/group). E Protein levels of CD16 and NF-κB and their quantification in the hippocampus at day 14 post BCCAO (band intensity normalized to β-actin) (n = 6/group). F, G Representative immunofluorescence images (F) and mean fluorescence intensity (G) of hippocampal neurons in CA1, CA2, CA3, and DG in the different groups. (n = 6/group). Scale bar, 50 μm. HK Western blot analysis for protein levels of caspase 3, cleaved caspase 3, Bcl2, Bax, Bcl-XL, Erk, and pErk and their quantification (band intensity normalized to β-actin or COXIV) in the hippocampus (n = 6/group). The data represent the mean ± SEM. p < 0.05 was set as the threshold for significance. * p < 0.05, ** p < 0.01, *** p < 0.001 compared to S+NaCl group. &&p < 0.01 compared to the S+SCFA group. +p < 0.05 compared to the B+NaCl 14d group. #p < 0.05, ##p < 0.01 compared to the B+NaCl 37d group
Fig. 11
Fig. 11
A schematic diagram for this study. Bidirectional communications exist between the brain and the gut, with the involvement of gut microbiota through fermented metabolites such as short-chain fatty acids (SCFAs). Brain injury caused by chronic hypoperfusion induces gut dysbiosis, accompanied with decreased fermentation products. Restoring gut microbiota through fecal microbiota transplantation (FMT) alleviates disrupted gut function, neuronal apoptosis, and neuroinflammation

References

    1. Iadecola C. The pathobiology of vascular dementia. Neuron. 2013;80(4):844–866. doi: 10.1016/j.neuron.2013.10.008. - DOI - PMC - PubMed
    1. van der Flier WM, Skoog I, Schneider JA, Pantoni L, Mok V, Chen CLH, et al. Vascular cognitive impairment. Nat Rev Dis Primers. 2018;4:18003. doi: 10.1038/nrdp.2018.3. - DOI - PubMed
    1. Khan A, Kalaria RN, Corbett A, Ballard C. Update on vascular dementia. J Geriatr Psychiatry Neurol. 2016;29(5):281–301. doi: 10.1177/0891988716654987. - DOI - PubMed
    1. Wolters FJ, Ikram MA. Epidemiology of vascular dementia. Arterioscler Thromb Vasc Biol. 2019;39(8):1542–1549. doi: 10.1161/atvbaha.119.311908. - DOI - PubMed
    1. Lobo A, Launer LJ, Fratiglioni L, Andersen K, Di Carlo A, Breteler MM, et al. Prevalence of dementia and major subtypes in Europe: a collaborative study of population-based cohorts. Neurologic Diseases in the Elderly Research Group. Neurology. 2000;54(11 Suppl 5):S4–S9. - PubMed

Publication types

Substances

LinkOut - more resources