

Temporal Trends in the Remaining Lifetime Risk of Cardiovascular Disease Among Middle-Aged Adults Across 6 Decades: The Framingham Study
- PMID: 35430874
- PMCID: PMC9038688
- DOI: 10.1161/CIRCULATIONAHA.121.057889
Temporal Trends in the Remaining Lifetime Risk of Cardiovascular Disease Among Middle-Aged Adults Across 6 Decades: The Framingham Study
Abstract
Background: The remaining lifetime risk (RLR) is the probability of developing an outcome over the remainder of one's lifespan at any given age. The RLR for atherosclerotic cardiovascular disease (ASCVD) in three 20-year periods were assessed using data from a single community-based cohort study of predominantly White participants.
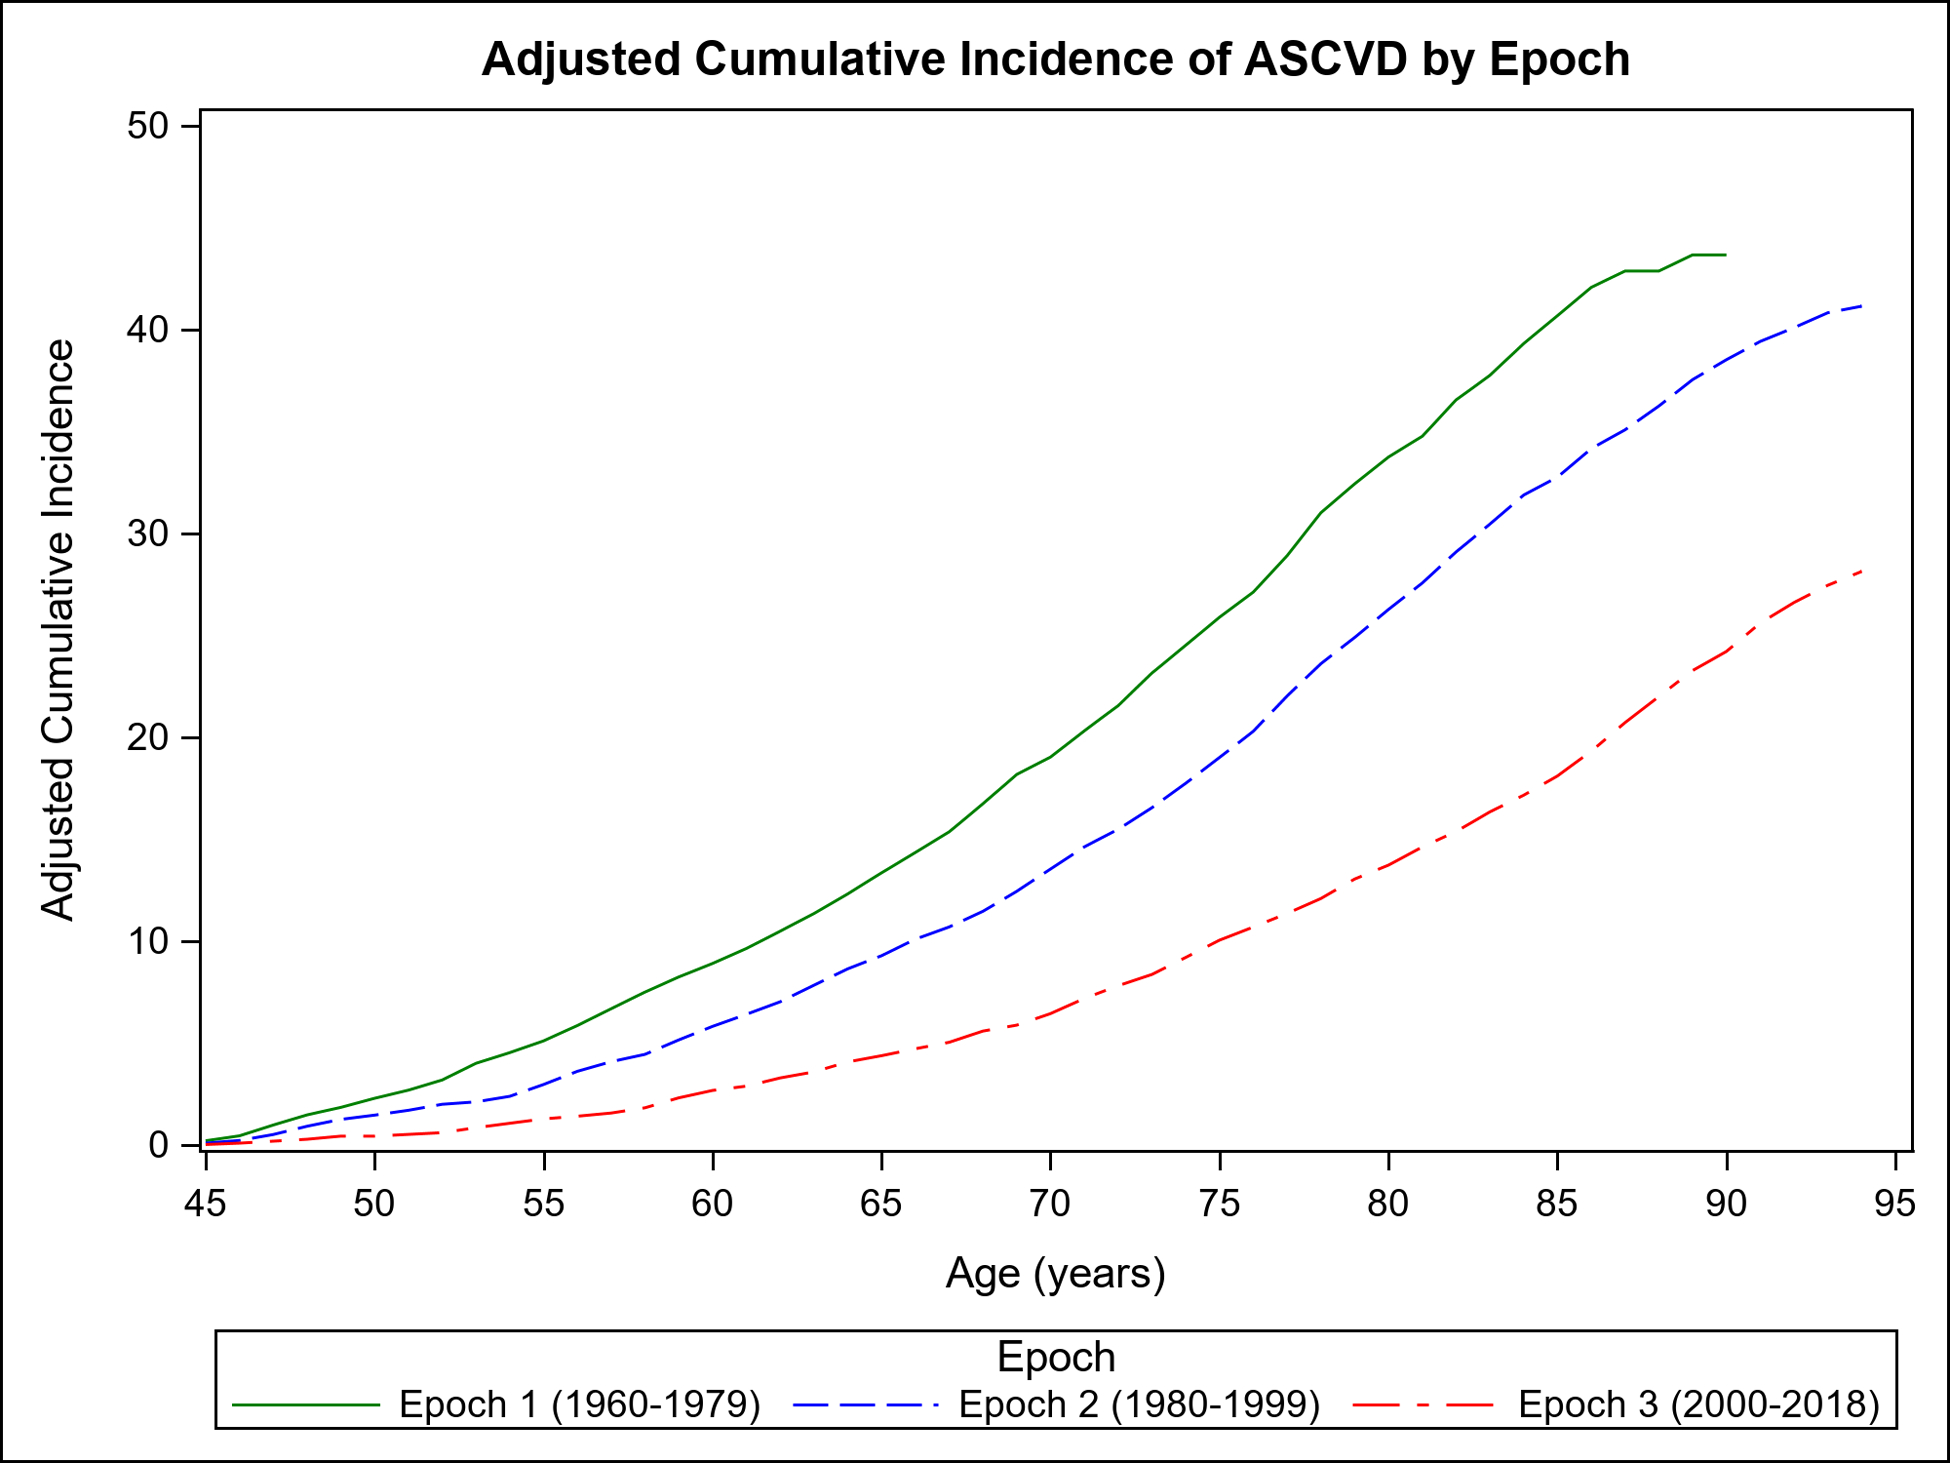
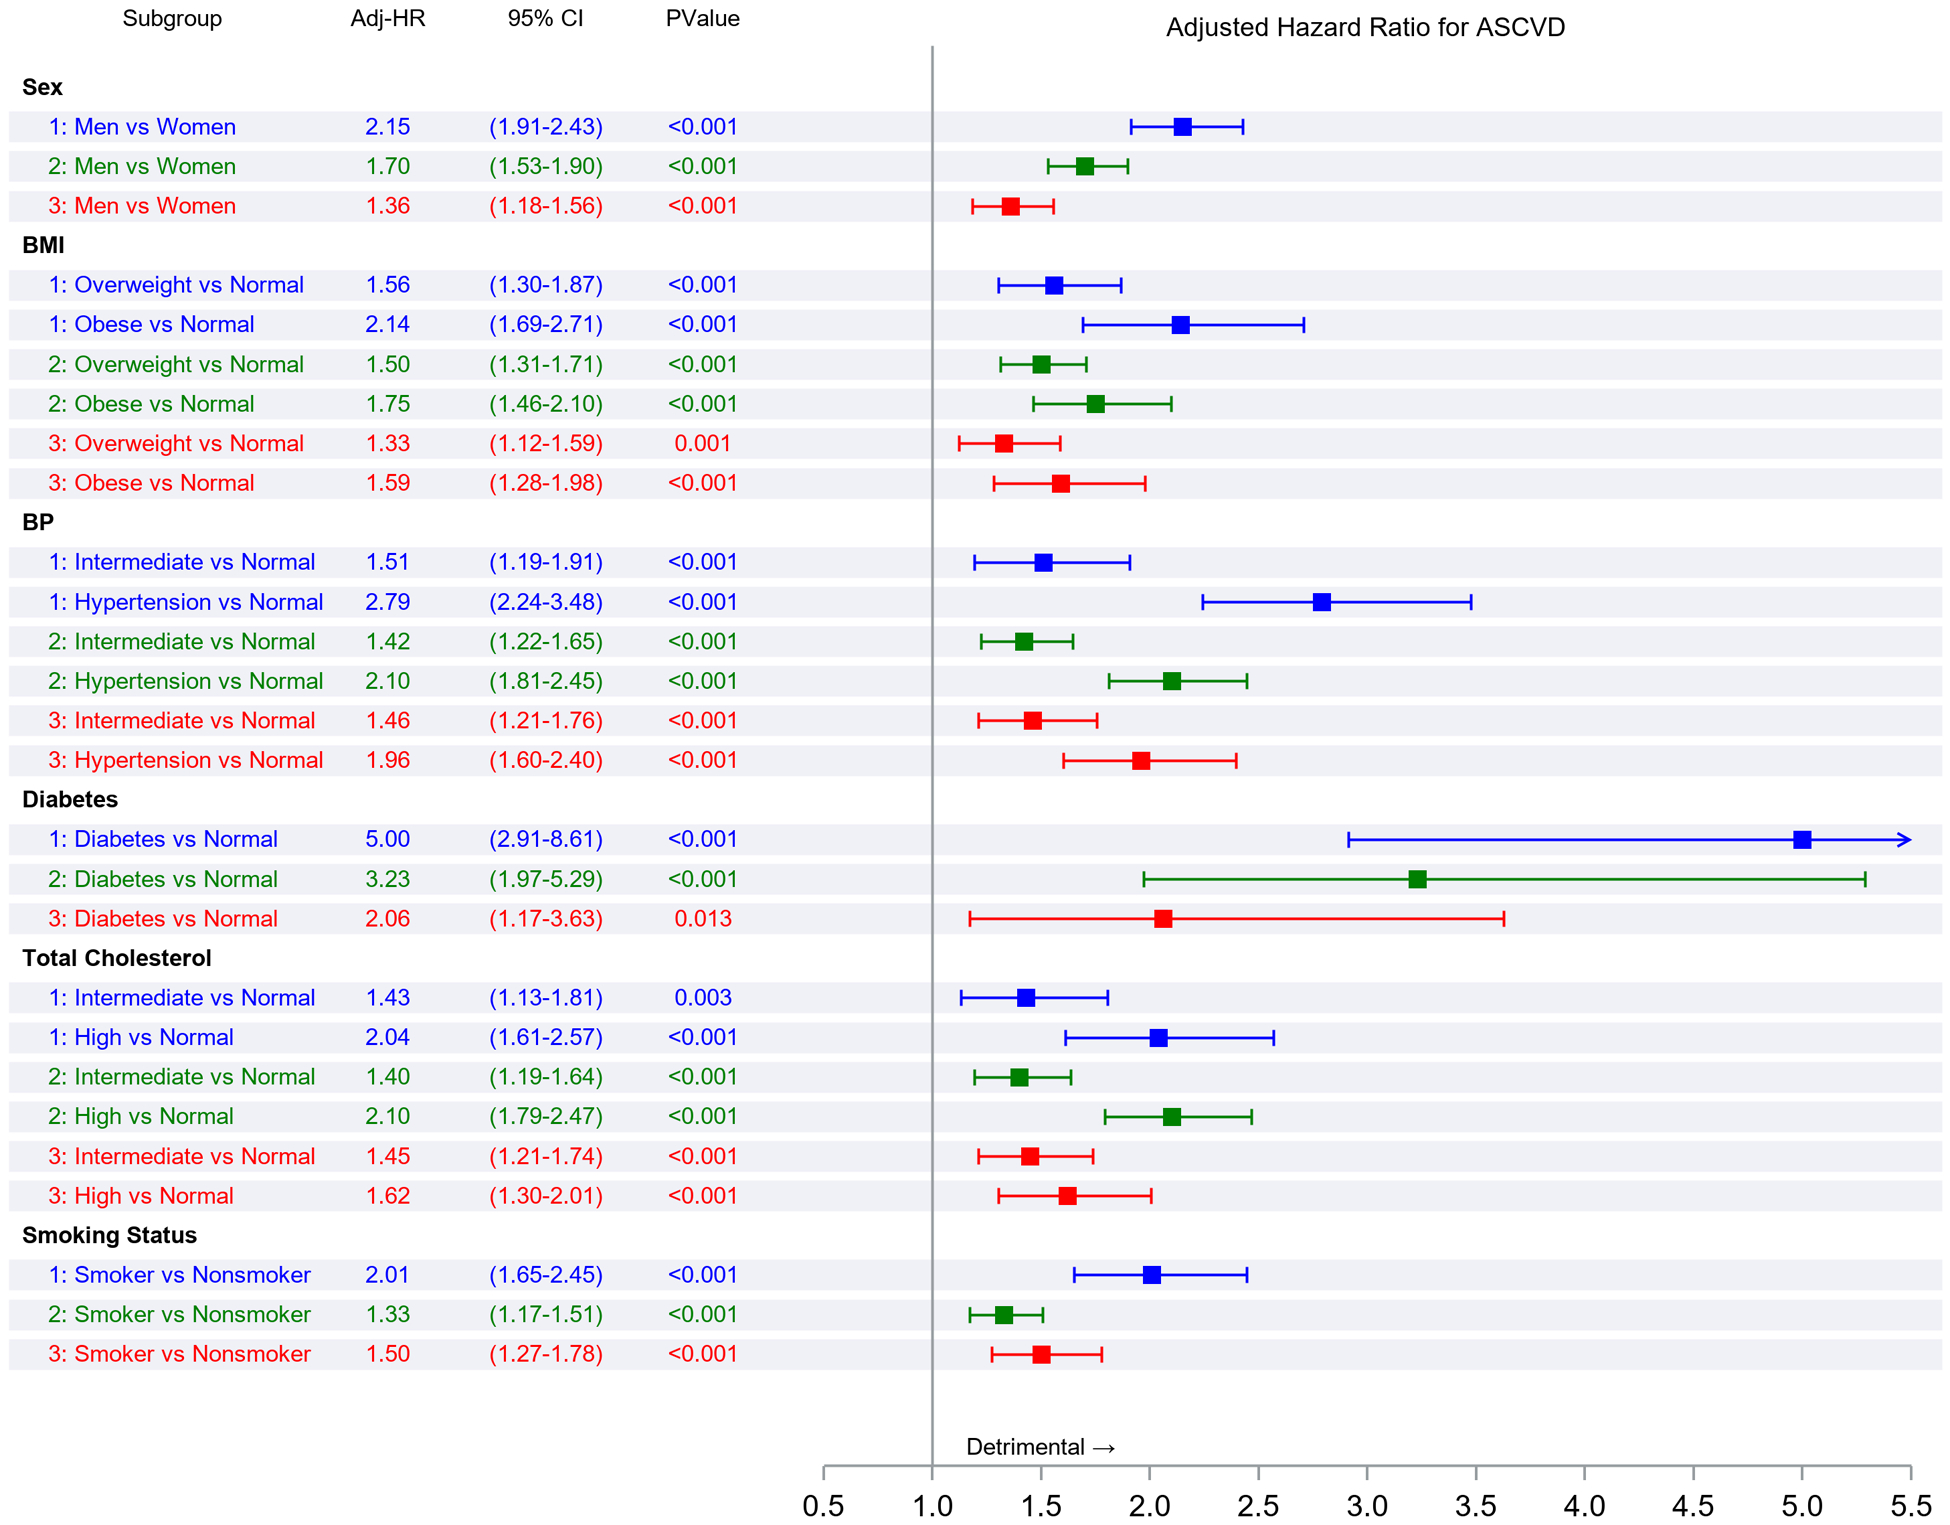
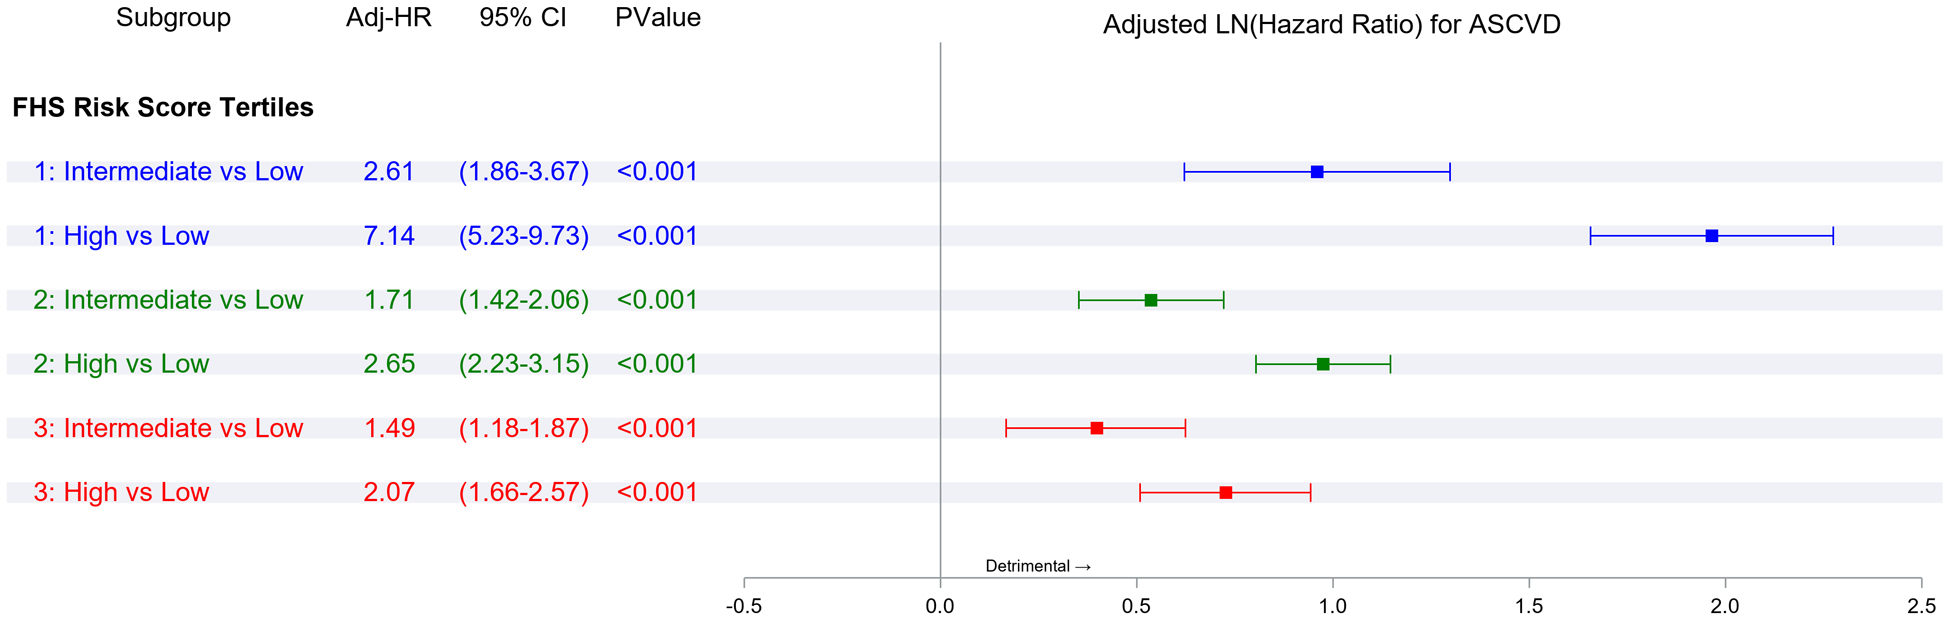
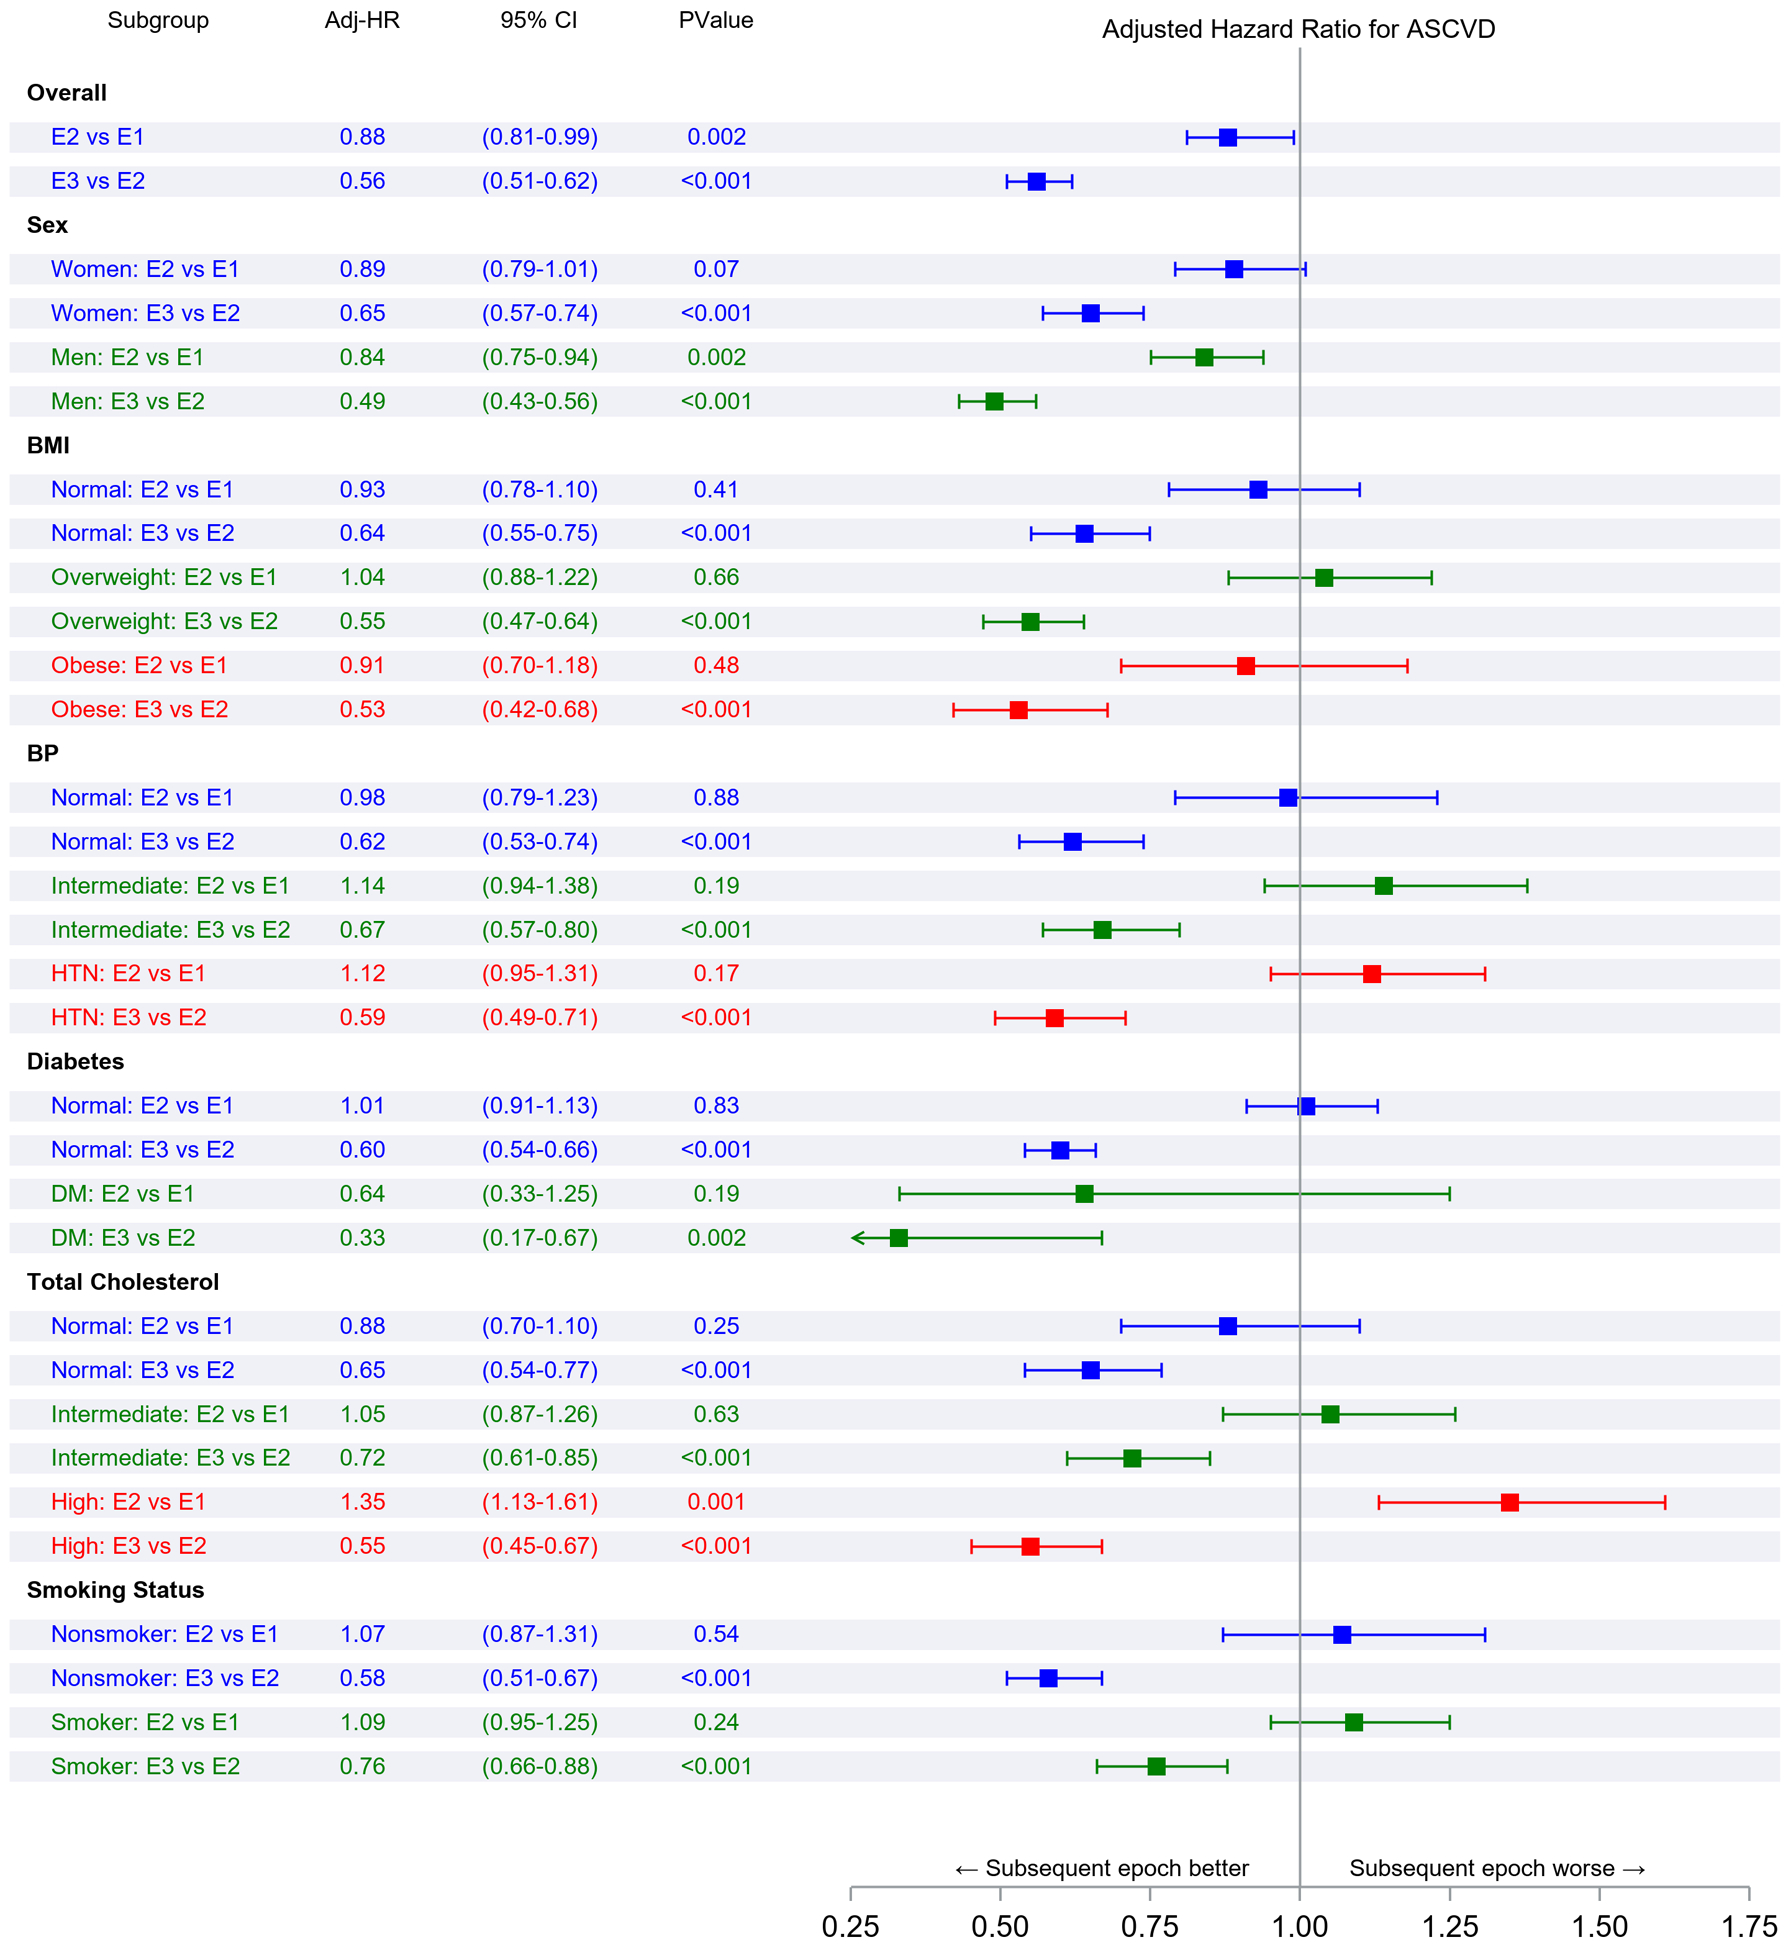
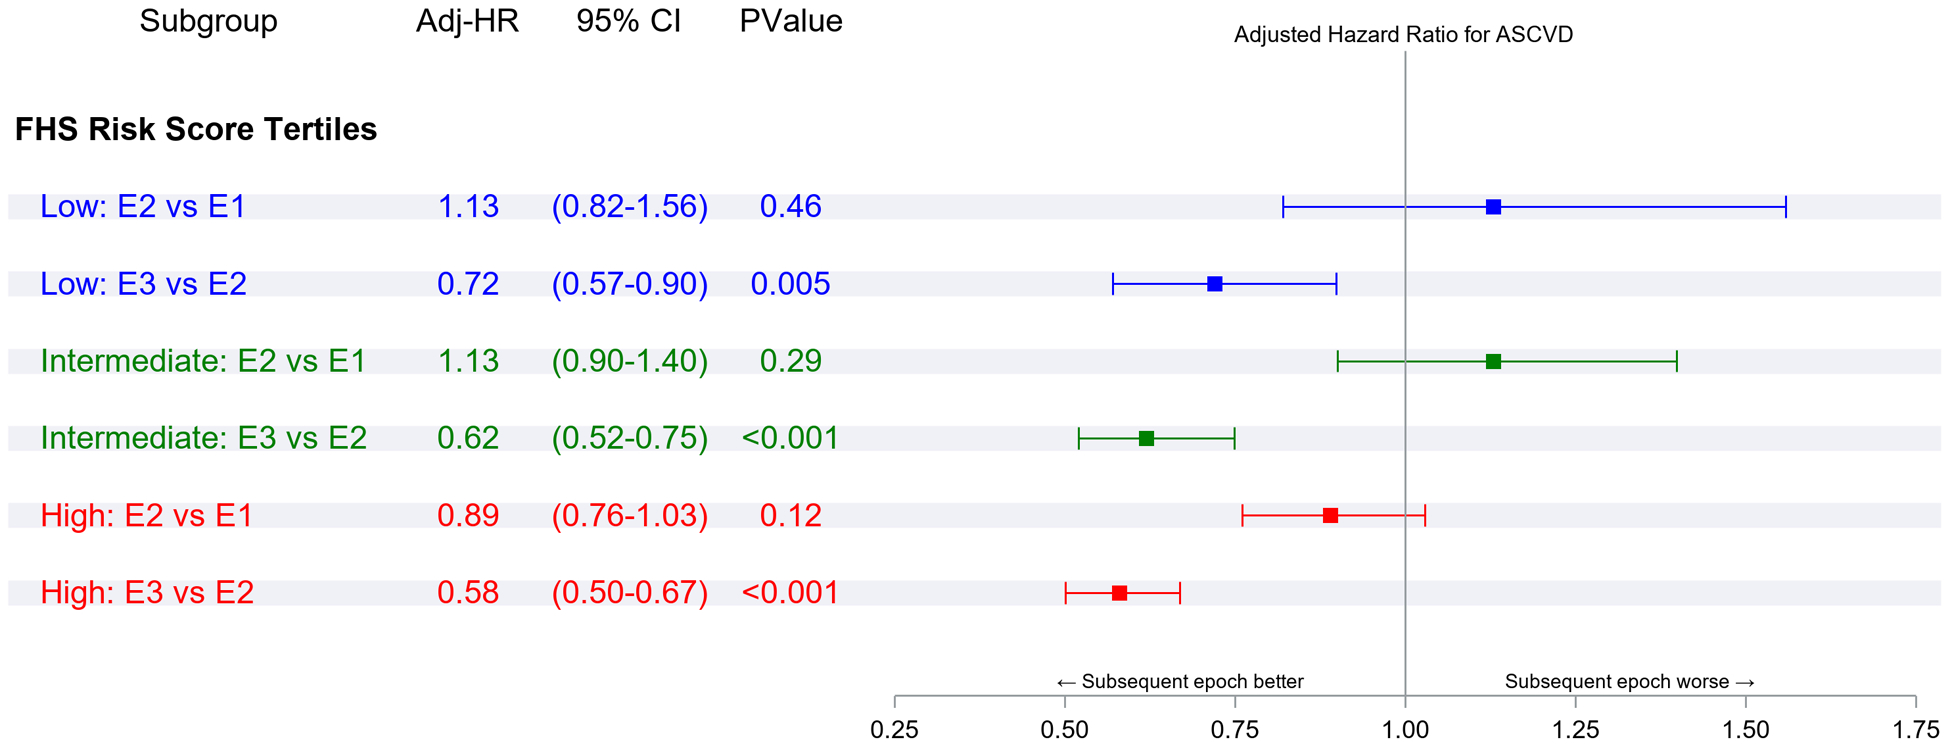
Methods: Longitudinal data from the Framingham study in 3 epochs (epoch 1, 1960-1979; epoch 2, 1980-1999; epoch 3, 2000-2018) were evaluated. The RLR of a first ASCVD event (myocardial infarction, coronary heart disease death, or stroke) from 45 years of age (adjusting for competing risk of death) in the 3 epochs were compared overall, and according to the following strata: sex, body mass index, blood pressure and cholesterol categories, diabetes, smoking, and Framingham risk score groups.
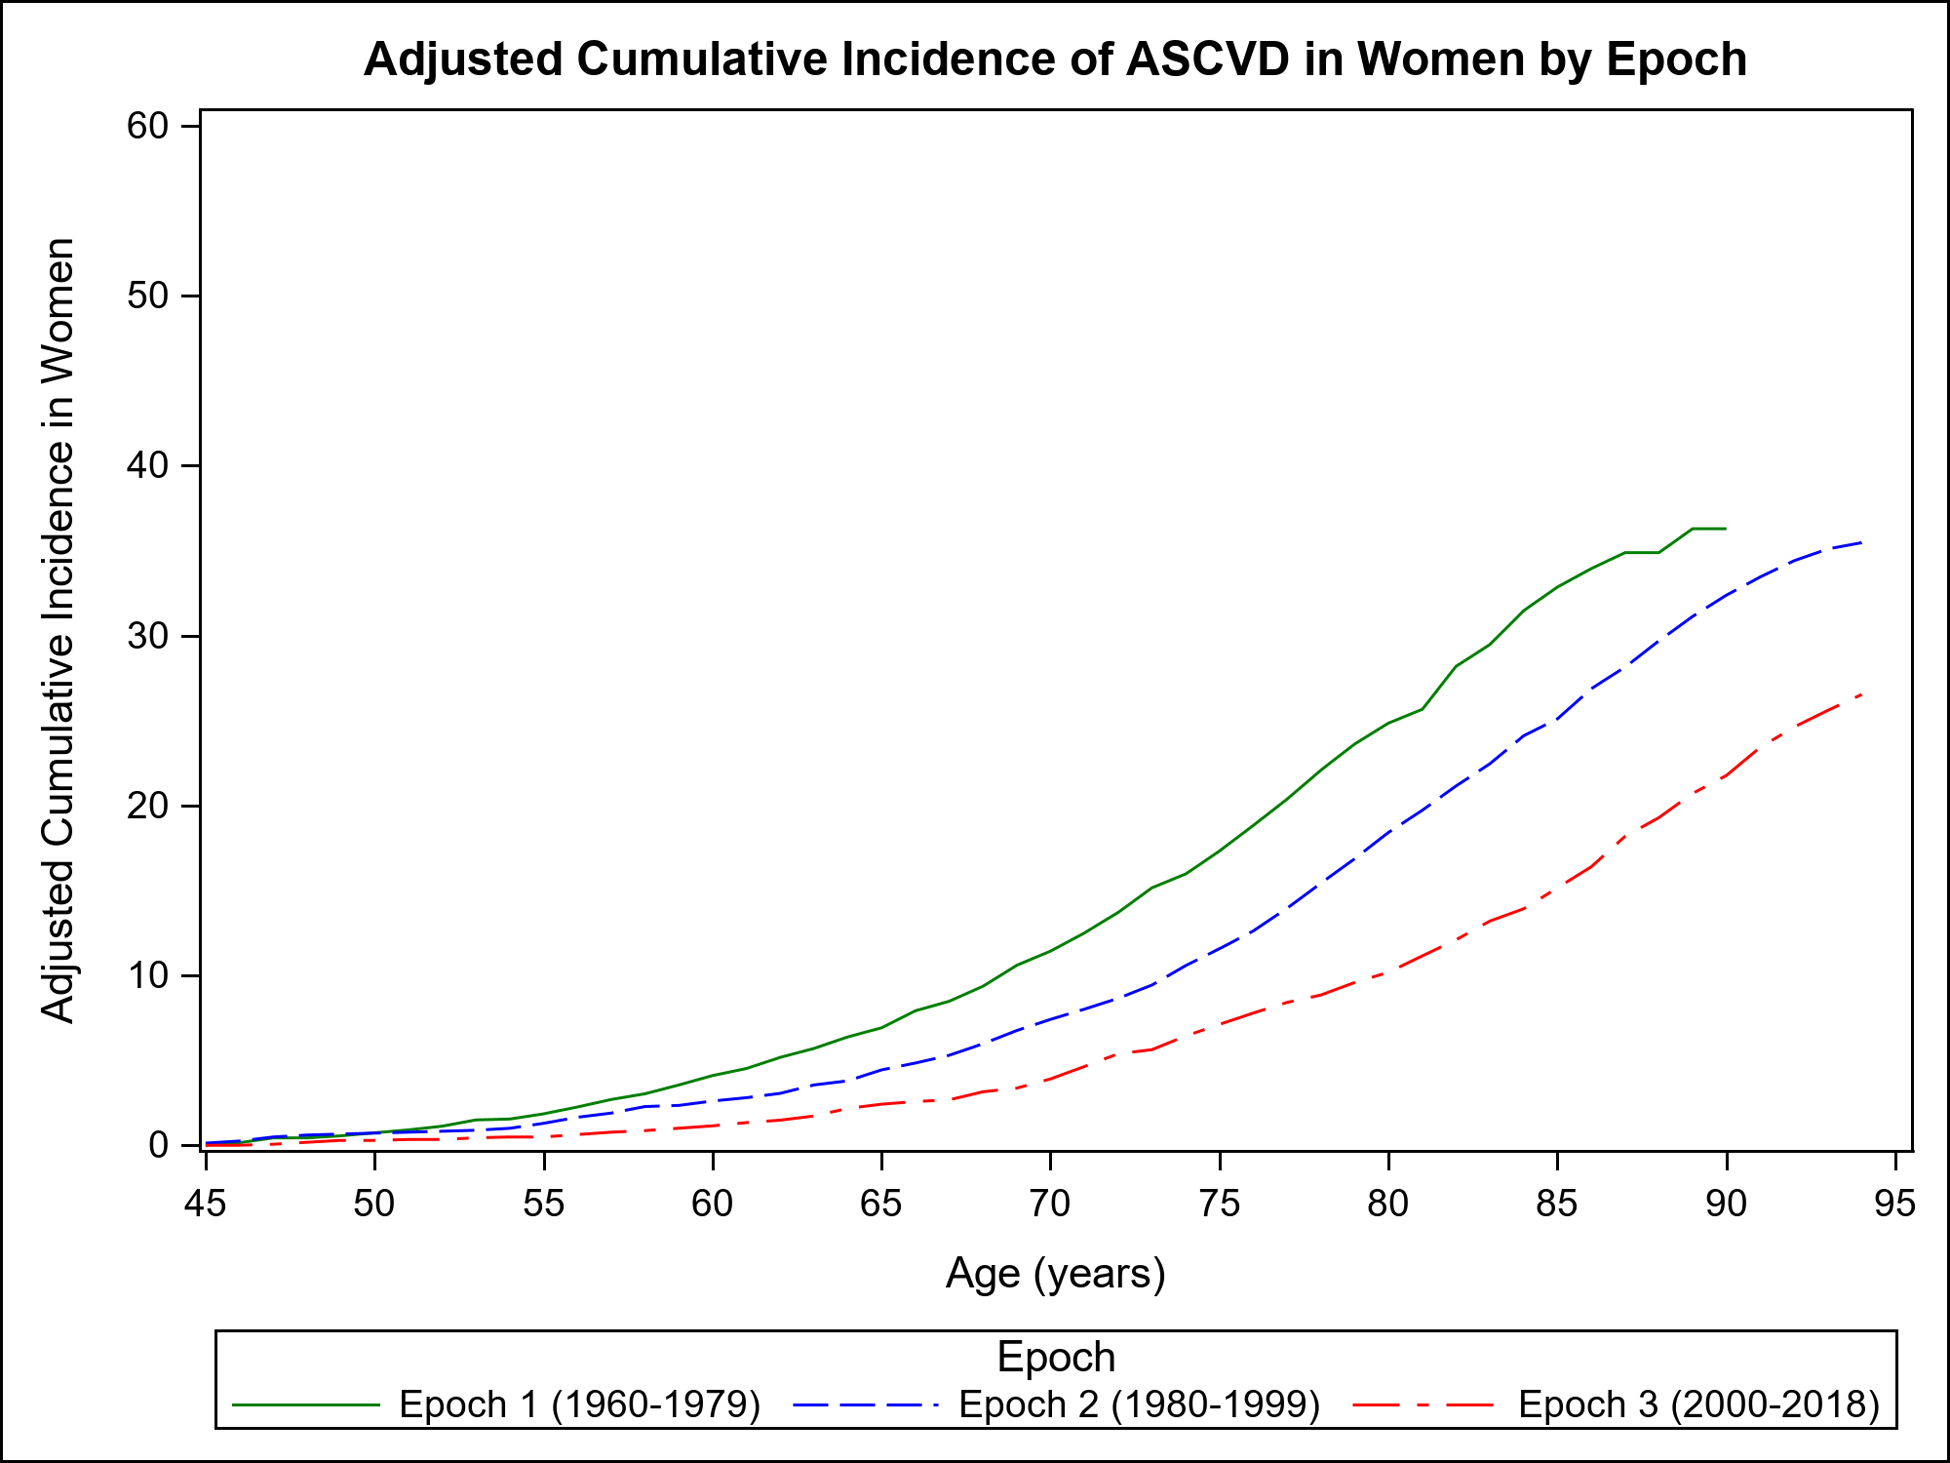
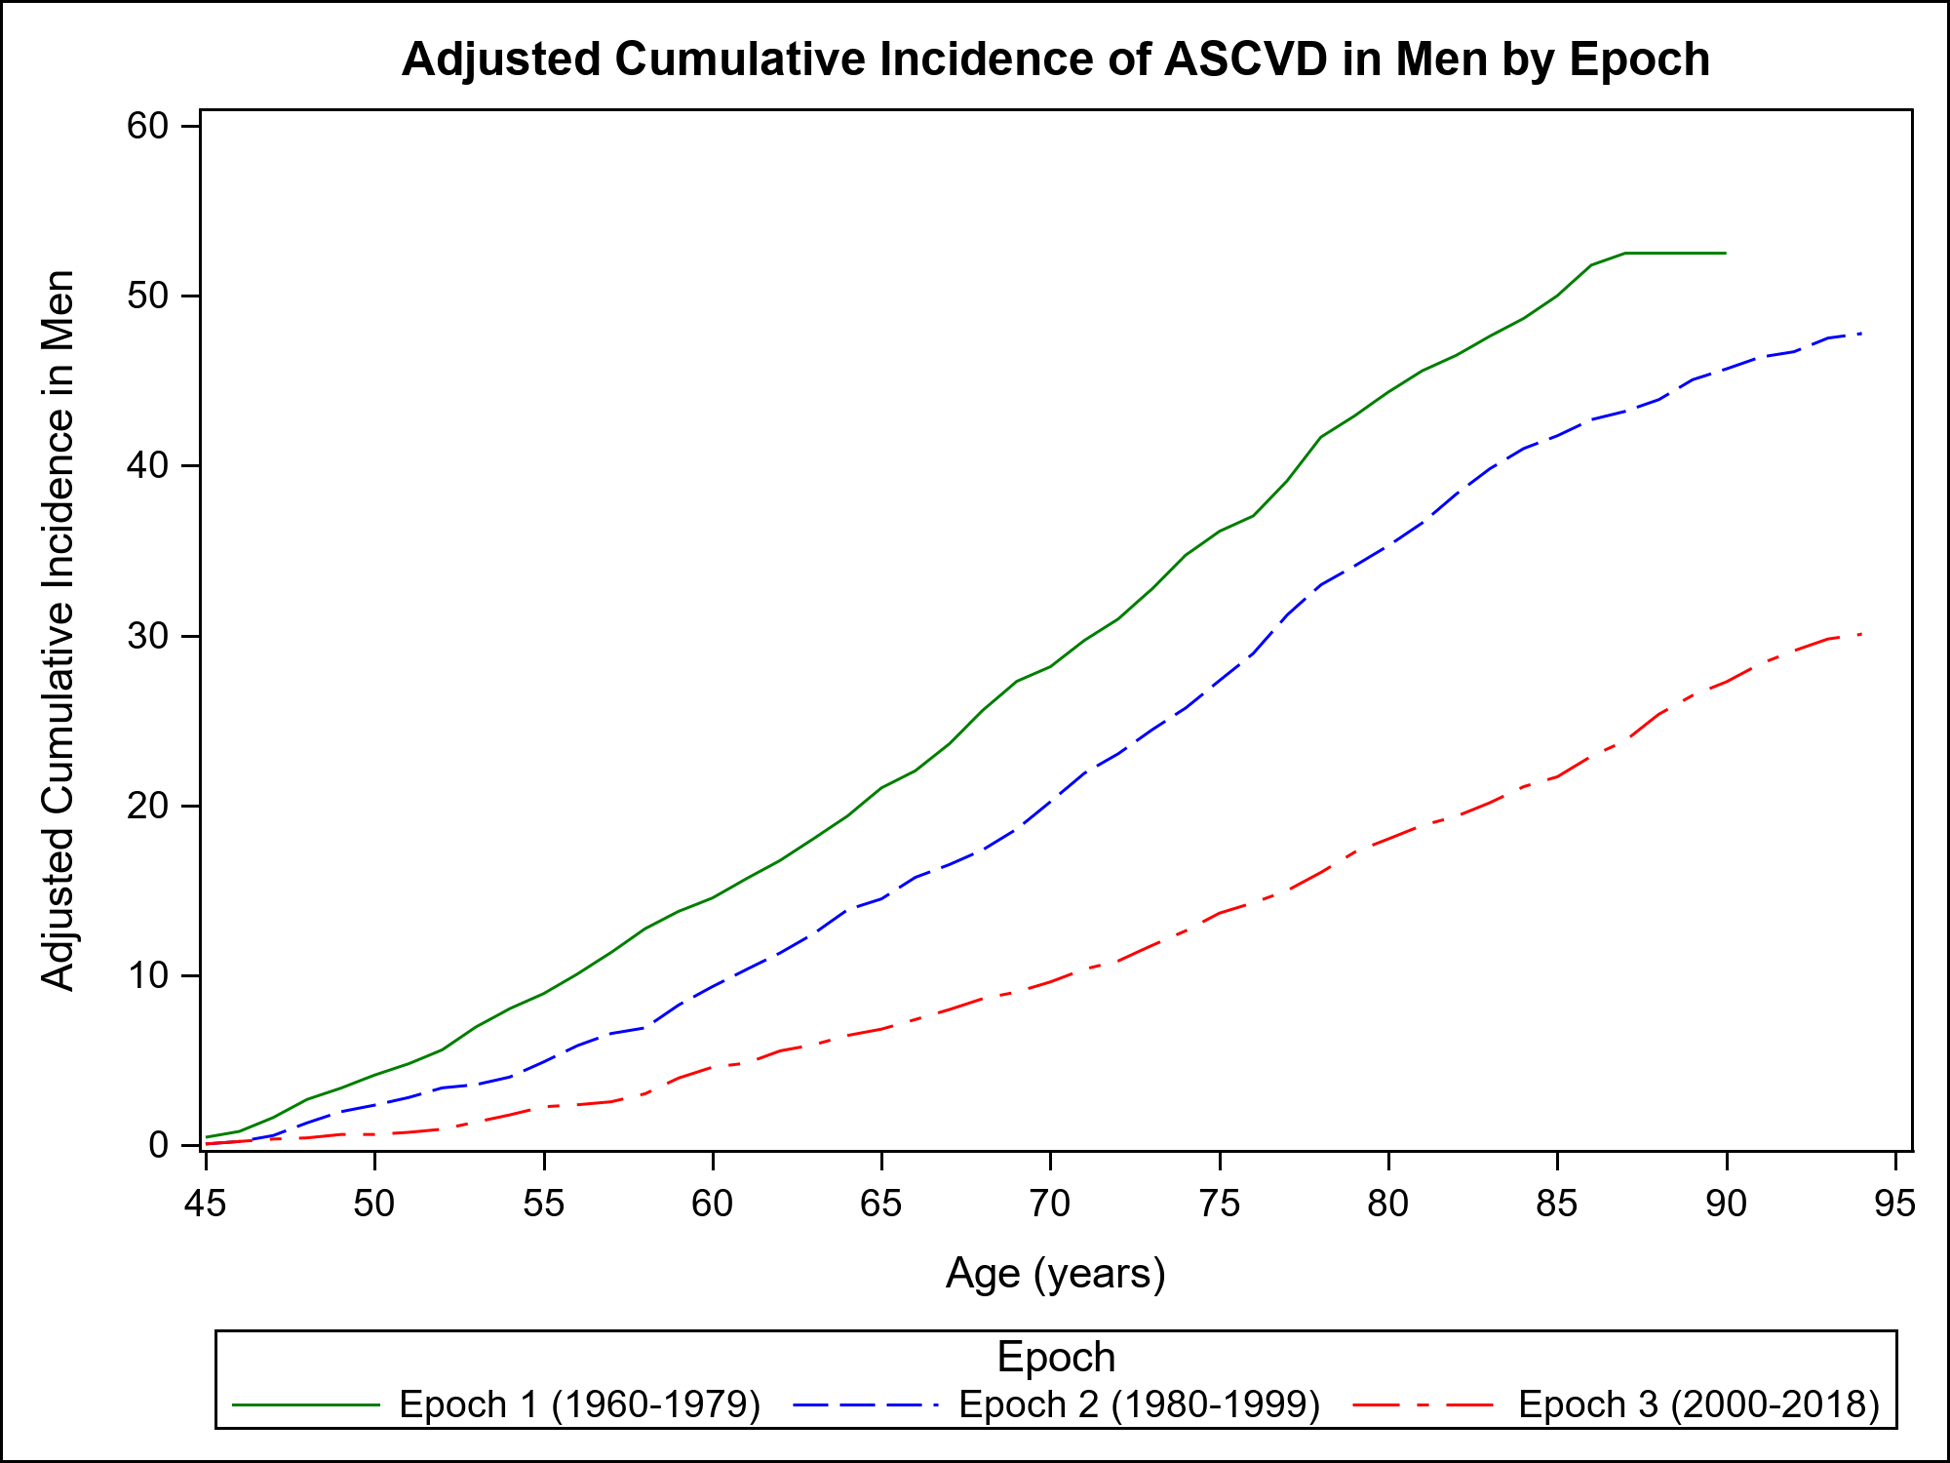
Results: There were 317 849 person-years of observations during the 3 epochs (56% women; 94% White) and 4855 deaths occurred. Life expectancy rose by 10.1 years (men) to 11.9 years (women) across the 3 epochs. There were 1085 ASCVD events over the course of 91 330 person-years in epoch 1, 1330 ASCVD events over the course of 107 450 person-years in epoch 2, and 775 ASCVD events over the course of 119 069 person-years in epoch 3. The mean age at onset of first ASCVD event was greater in the third epoch by 8.1 years (men) to 10.3 years (women) compared with the first epoch. The RLR of ASCVD from 45 years of age declined from 43.7% in epoch 1 to 28.1% in epoch 3 (P<0.0001), a finding that was consistent in both sexes (RLR [epoch 1 versus epoch 3], 36.3% versus 26.5% [women]; 52.5% versus 30.1% [men]; P<0.001 for both). The lower RLR of ASCVD in the last 2 epochs was observed consistently across body mass index, blood pressure, cholesterol, diabetes, smoking, and Framingham risk score strata (P<0.001 for all). The RLR of coronary heart disease events and stroke declined in both sexes (P<0.001).
Conclusions: Over the past 6 decades, mean life expectancy increased and the RLR of ASCVD decreased in the community-based, predominantly White Framingham study. The residual burden of ASCVD underscores the importance of continued and effective primary prevention efforts with better screening for risk factors and their effective treatment.
Keywords: atherosclerosis; cardiovascular diseases; cohort studies; epidemiology; risk factors.
Figures
References
-
- Kassebaum NJ, Arora M, Barber RM, Bhutta ZA, Brown J, Carter A, Casey DC, Charlson FJ, Coates MM, Coggeshall M, et al. Global, regional, and national disability-adjusted life-years (DALYs) for 315 diseases and injuries and healthy life expectancy (HALE), 1990–2015: a systematic analysis for the Global Burden of Disease Study 2015. Lancet. 2016;388:1603–1658. - PMC - PubMed
-
- Wang H, Naghavi M, Allen C, Barber RM, Bhutta ZA, Carter A, Casey DC, Charlson FJ, Chen AZ, Coates MM, et al. Global, regional, and national life expectancy, all-cause mortality, and cause-specific mortality for 249 causes of death, 1980–2015: a systematic analysis for the Global Burden of Disease Study 2015. Lancet. 2016;388:1459–1544. - PMC - PubMed
-
- Vos T, Lim S, Abbafati C, Abbas K, Abbasi M and Abbasifard M. GBD 2019 Diseases and Injuries Collaborators. Global burden of 369 diseases and injuries in 204 countries and territories, 1990–2019: a systematic analysis for the Global Burden of Disease Study 2019. Lancet. 2020;396:1204–1222 - PMC - PubMed
-
- Virani SS, Alonso A, Aparicio HJ, Benjamin EJ, Bittencourt MS, Callaway CW, Carson AP, Chamberlain AM, Cheng S, Delling FN, et al. Heart Disease and Stroke Statistics;2021 Update. Circulation. 2021;143:e254–e743 - PubMed
Publication types
MeSH terms
Substances
Grants and funding
LinkOut - more resources
Full Text Sources
Medical
Miscellaneous
