. 2022 May 13;130(10):1510-1530.
doi: 10.1161/CIRCRESAHA.121.320090. Epub 2022 Apr 18.

Human Coronary Plaque T Cells Are Clonal and Cross-React to Virus and Self

Affiliations

Human Coronary Plaque T Cells Are Clonal and Cross-React to Virus and Self

Roshni Roy Chowdhury et al. Circ Res. .

Abstract

Background: Coronary artery disease is an incurable, life-threatening disease that was once considered primarily a disorder of lipid deposition. Coronary artery disease is now also characterized by chronic inflammation' notable for the buildup of atherosclerotic plaques containing immune cells in various states of activation and differentiation. Understanding how these immune cells contribute to disease progression may lead to the development of novel therapeutic strategies.

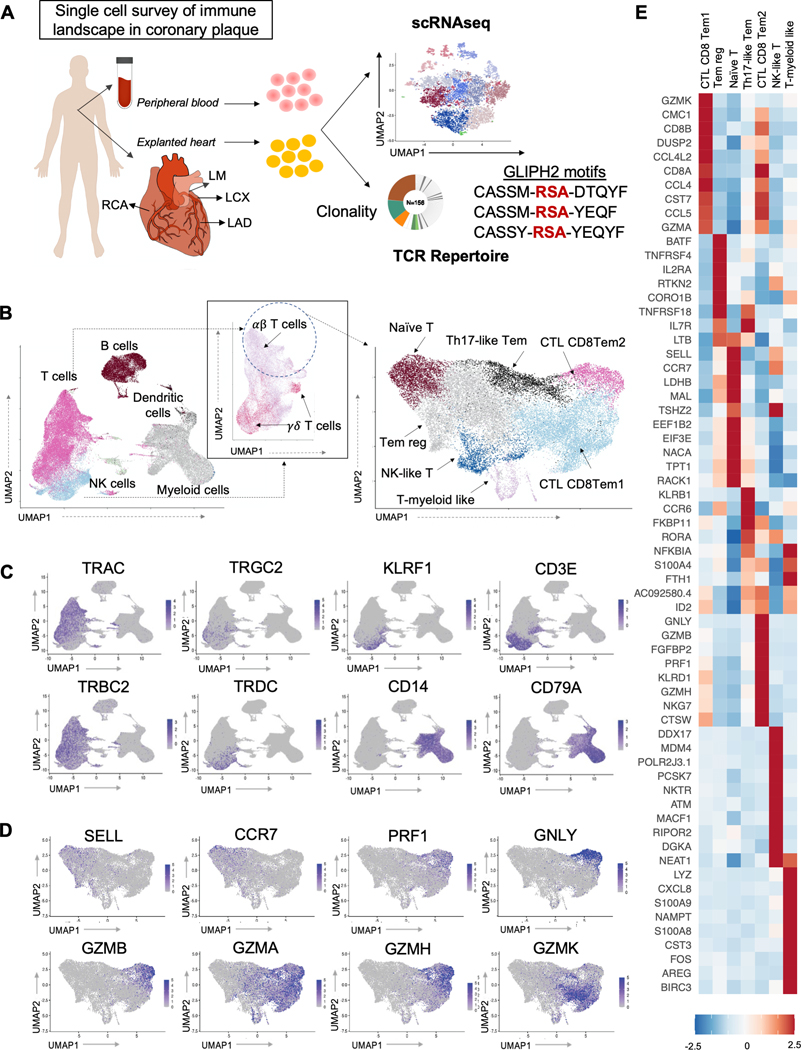
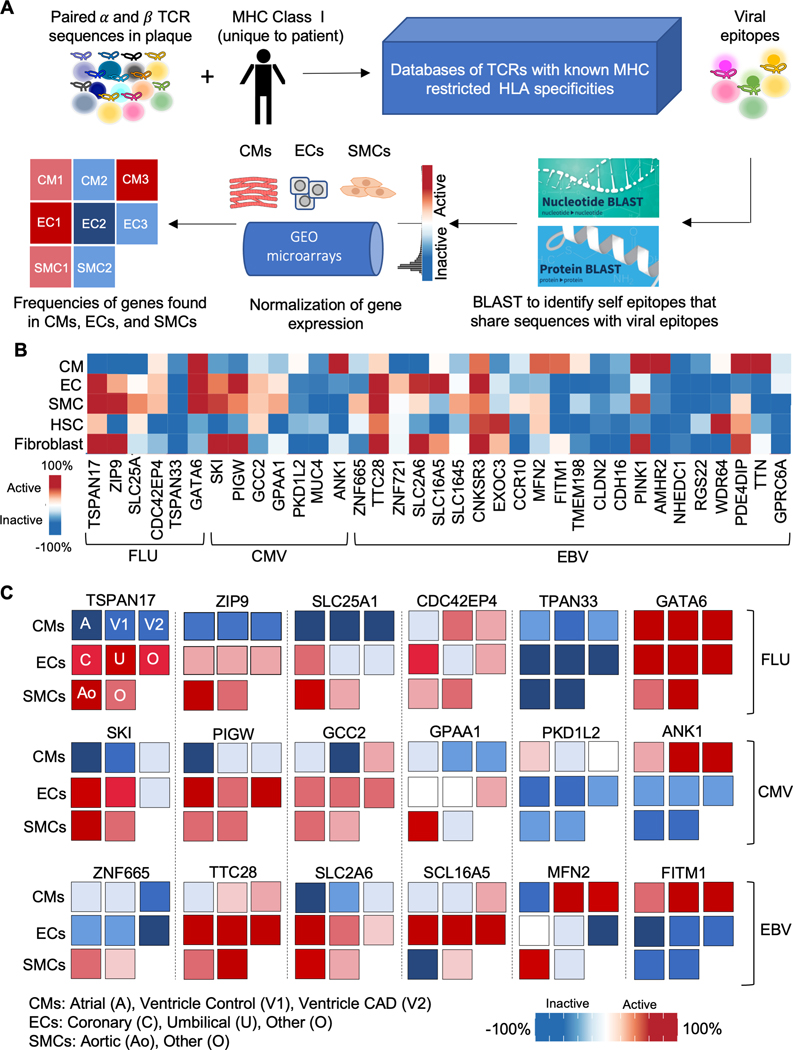
Methods: We used single-cell technology and in vitro assays to interrogate the immune microenvironment of human coronary atherosclerotic plaque at different stages of maturity.

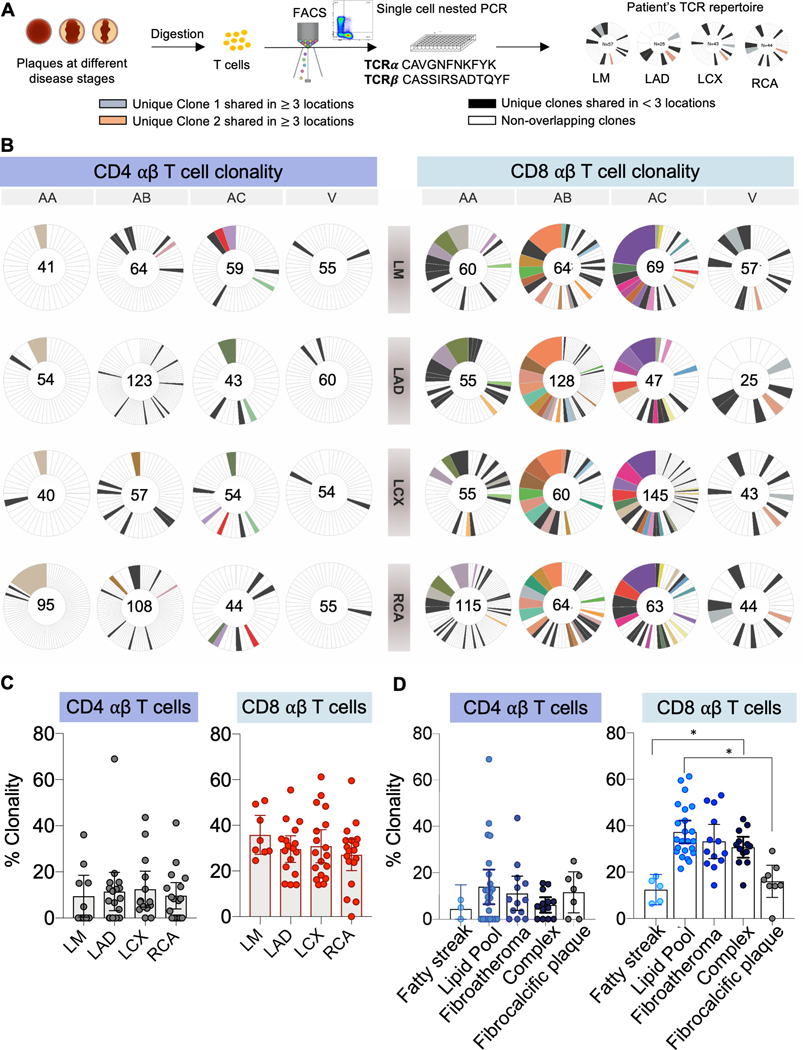
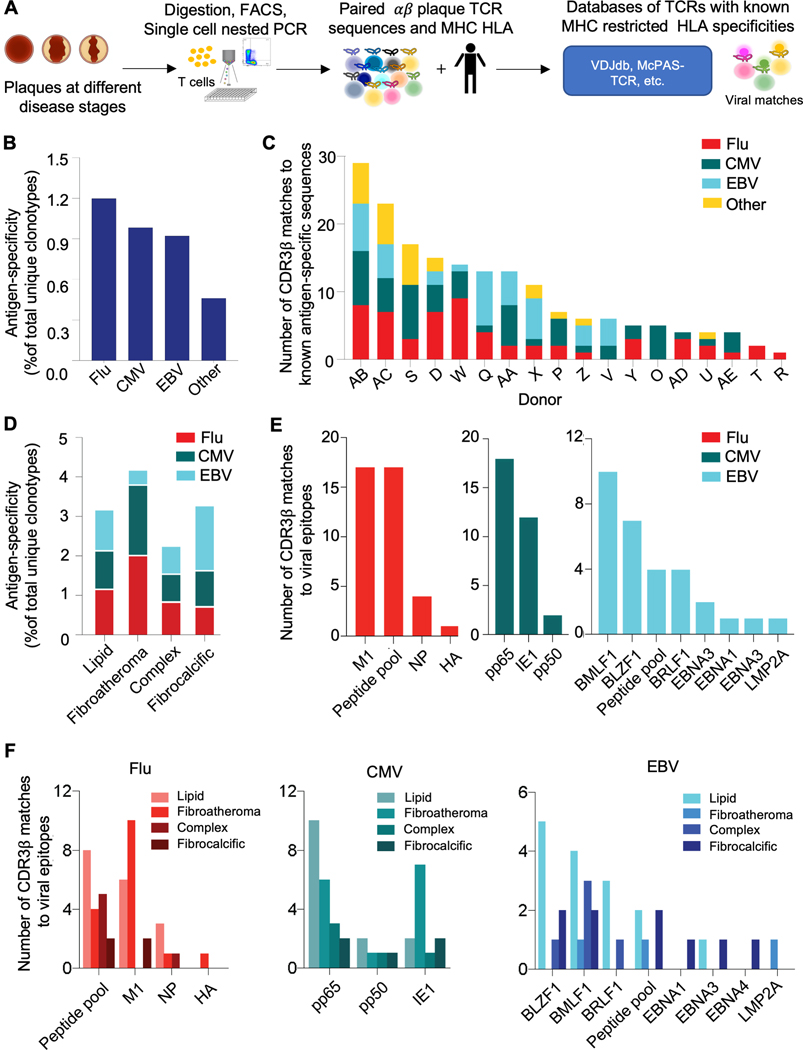
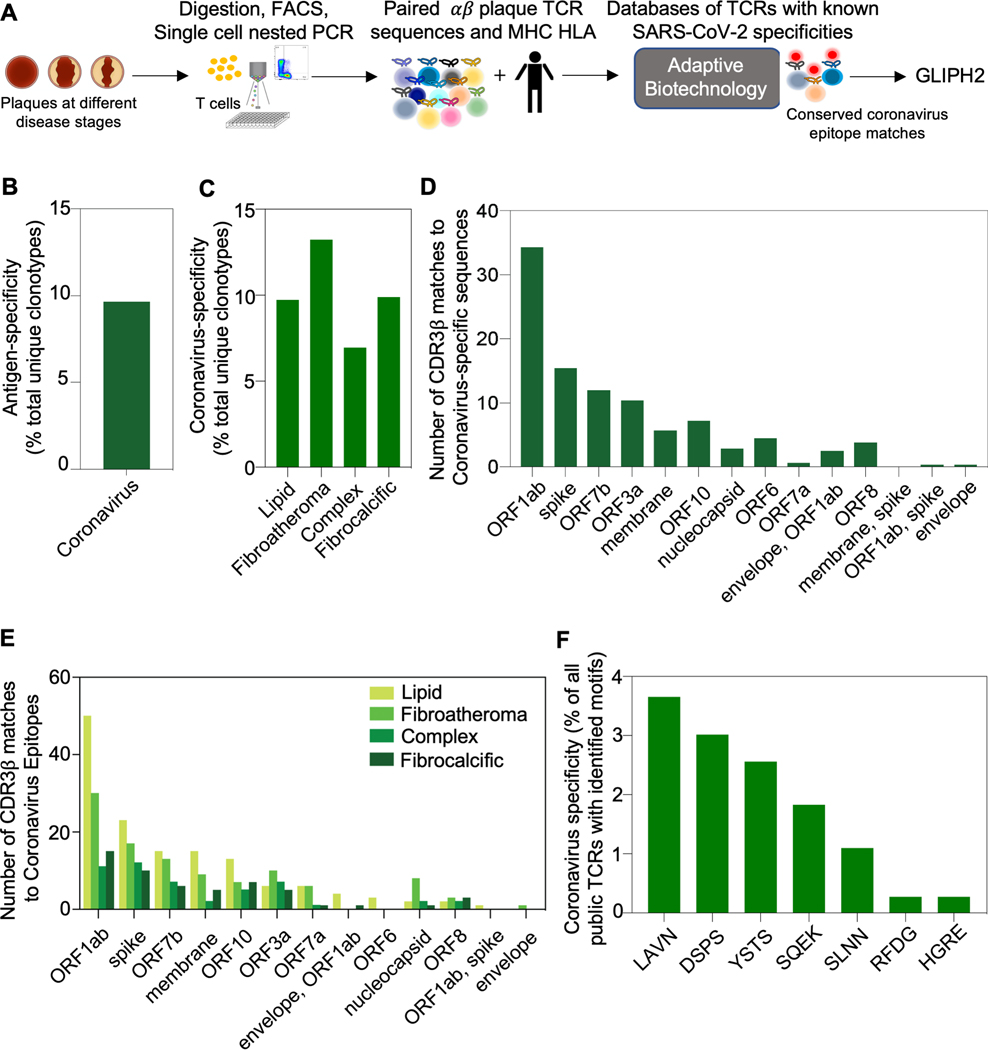
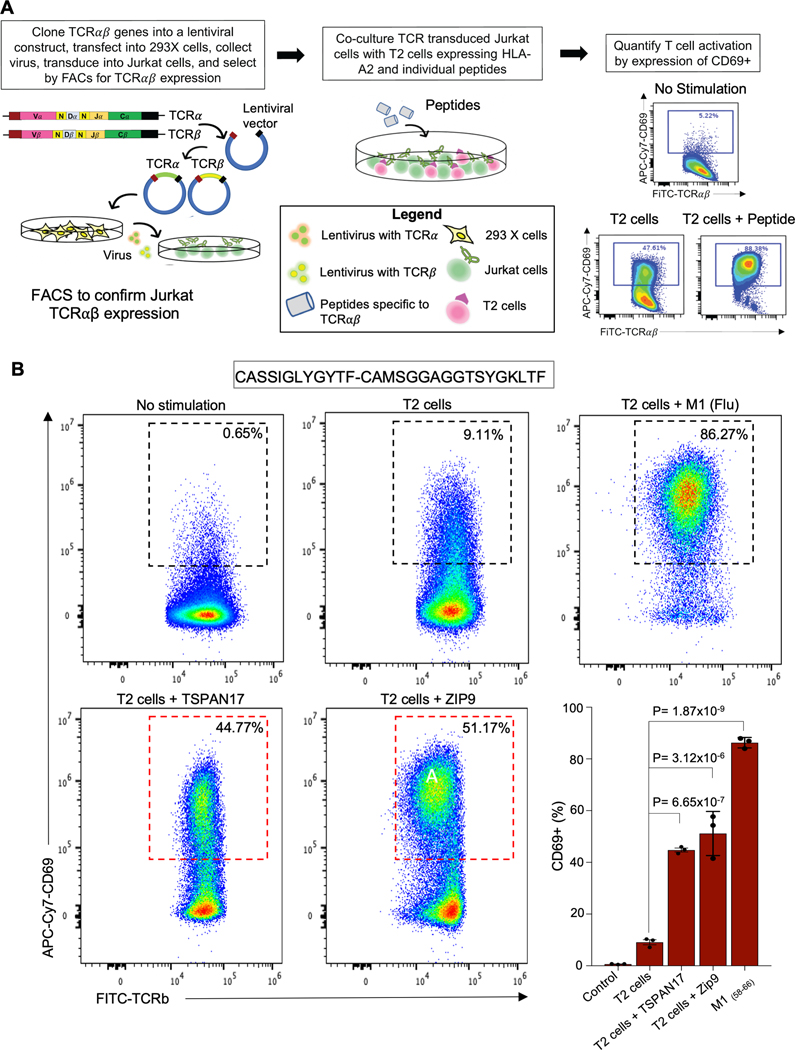
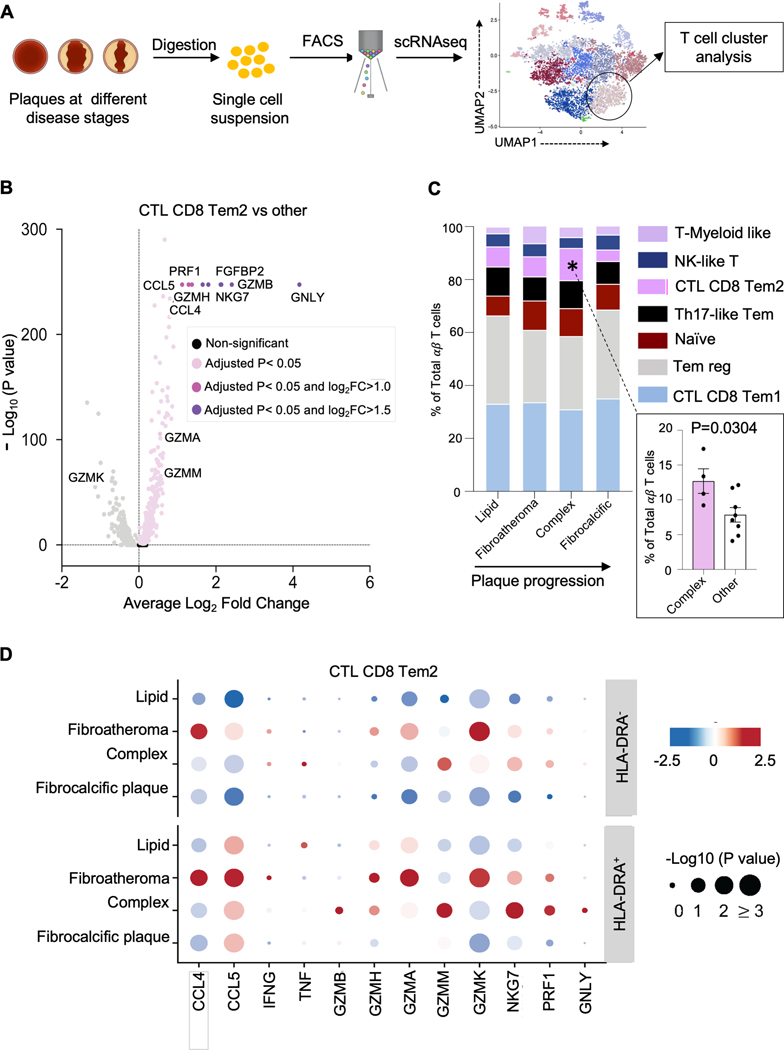
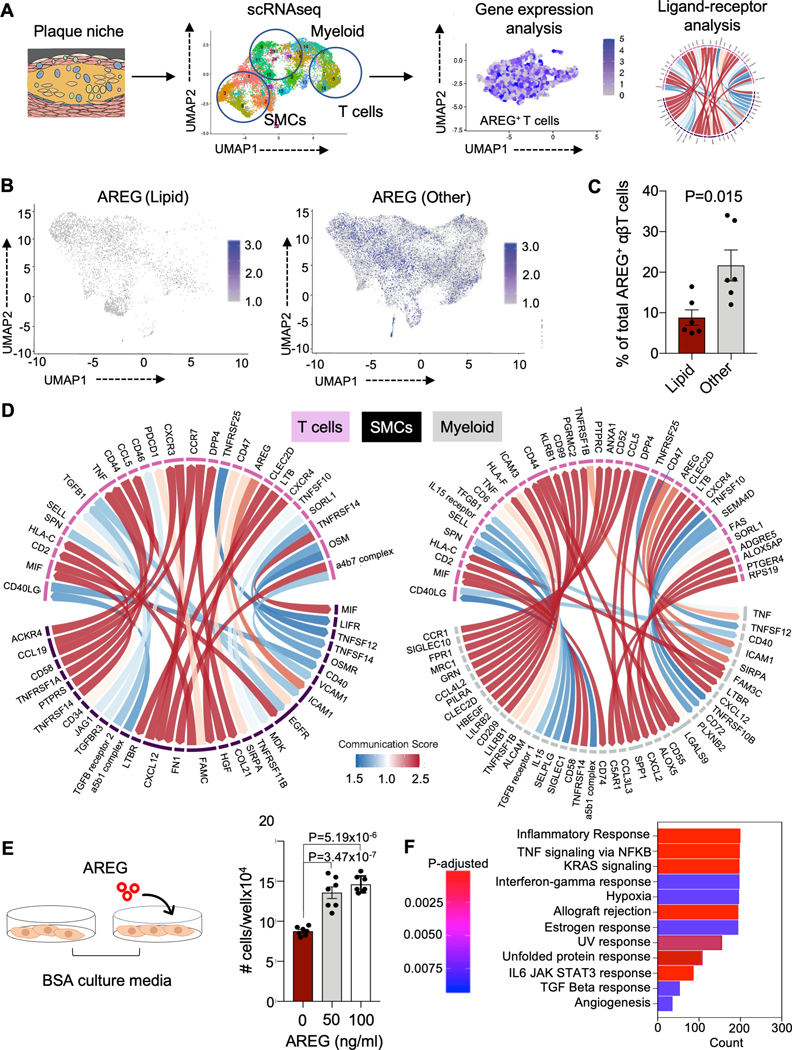
Results: In addition to macrophages, we found a high proportion of αβ T cells in the coronary plaques. Most of these T cells lack high expression of CCR7 and L-selectin, indicating that they are primarily antigen-experienced memory cells. Notably, nearly one-third of these cells express the HLA-DRA surface marker, signifying activation through their TCRs (T-cell receptors). Consistent with this, TCR repertoire analysis confirmed the presence of activated αβ T cells (CD4<CD8), exhibiting clonal expansion of specific TCRs. Interestingly, we found that these plaque T cells had TCRs specific for influenza, coronavirus, and other viral epitopes, which share sequence homologies to proteins found on smooth muscle cells and endothelial cells, suggesting potential autoimmune-mediated T-cell activation in the absence of active infection. To better understand the potential function of these activated plaque T cells, we then interrogated their transcriptome at the single-cell level. Of the 3 T-cell phenotypic clusters with the highest expression of the activation marker HLA-DRA, 2 clusters expressed a proinflammatory and cytolytic signature characteristic of CD8 cells, while the other expressed AREG (amphiregulin), which promotes smooth muscle cell proliferation and fibrosis, and, thus, contributes to plaque progression.

Conclusions: Taken together, these findings demonstrate that plaque T cells are clonally expanded potentially by antigen engagement, are potentially reactive to self-epitopes, and may interact with smooth muscle cells and macrophages in the plaque microenvironment.

Keywords: T-lymphocytes; atherosclerosis; coronary artery disease; endothelial cells; humans; plaque, atherosclerotic.


Conflict of interest statement

DISCLOSURES

The authors have no conflicts to disclose.

Figures

Figure 1.
Figure 1.. Antigen-experienced T cells predominate in the plaque immune landscape.
(A) Schematic representation of the experimental design. Immune cells were isolated from peripheral blood and atherosclerotic plaques of the major coronary arteries (LM = Left Main, LAD = Left Anterior Descending, LCX = Left Circumflex, RCA = Right Coronary Artery) of 35 donors. Samples were then used for flow cytometry (N=20), single cell transcriptomic analysis (N=12) and/or T cell receptor (TCR) repertoire profiling (N=20 for scTCR-seq and N=7 for bulkTCR-seq). Clustering and pathway analyses of gene expression profiles were used to identify changes in T cell phenotype, functions, and signaling mechanisms that accompany disease progression. The TCR repertoire was analyzed for clonal diversity, clone size, and complementarity-determining region 3 (CDR3) motif enrichment (using GLIPH), and their association with pathological disease stages. To explore antigenic specificities, TCR sequences from our data were compared to sequences with known specificities from public and private databases. Selected TCR sequences were expressed as transfectants to confirm antigen-specificity. (B) Cluster analysis. Plaque immune cells (left) and the T cell subset from the plaque transcriptome 9(UMAP) dimensionality reduction of the scRNA-seq data and colored by cluster assignment. (C) 2D visualization of the average expression of selected gene markers defining each immune cluster. (D) 2D visualization of the average expression of selected gene markers defining each T cell cluster. (E) Heatmap for expression (normalized, z-scored) of selected marker genes (rows) between cells belonging to different clusters (columns). Color scale indicates fold change.
Figure 2.
Figure 2.. Clonally expanded T cells are shared across arterial segments and track with disease stage.
(A) Mapping TCR clonality of coronary plaques at various stages of maturity. T cell receptor (TCR) repertoire profiling was performed in 20 donors. (B) Representative pie charts (N=4) showing clonal expansion of paired CDR3α/β sequences obtained by single cell analysis of CD4 and CD8 T cells in atherosclerotic plaques by arterial segment. Each color across all pie charts for a donor represents a unique clonotype, and the area of each pie is proportional to the clone size. Within each pie chart, individual clonotypes were colored if they appeared in 3 or more locations. Clonotypes that did not meet this criterion but had an overlap in at least one other location were colored black. The total number of single cell sequences obtained for each sample is shown in the center of the pie charts. (C) Clonality of plaque CD4 and CD8 T cells based on coronary arterial segment. One way ANOVA P value = 9.23×10⁻¹ (not significant) for CD4 and One Way ANOVA P value = 8.76×10⁻¹ (not significant) for CD8. (D) Clonality of plaque CD4 and CD8 T cells measured across pathological disease stages. One way ANOVA P value = 9.10×10⁻¹ (not significant) for CD4. One Way ANOVA P value = 1.34×10⁻⁷ for CD8. Paired t test P values adjusted for 10 comparisons by the Tukey method shown to compare differences in CD8 clonality across severity groups (Fatty streak vs. Lipid-pool, adjusted P= 1.00×10⁻⁴; Fatty streak vs. Fibroatheroma, adjusted P= 3.70×10⁻²; Fatty streak vs Complex, adjusted P=5.80×10⁻³); Fibrocalcific vs. Lipid-pool, adjusted P=1.52×10⁻²; Fibrocalcific vs. Fibroatheroma, adjusted P=2.10×10⁻²; Fibrocalcific vs. Complex, adjusted P=5.00×10⁻⁴). Clonality is calculated as the proportion that the multiplets occupy in the total repertoire per sample. Mean and error bars representing the 95% confidence intervals are shown for all comparisons. *: P<0.05.
Figure 3.
Figure 3.. Flu, CMV and EBV specificities are observed in plaque CD8 T cells, with the highest proportion in fibroatheromas.
(A) Diagram of steps for matching the TCR plaque repertoire to databases of TCRs with known MHC restricted HLA specificities to identify candidate antigen epitopes. Data from 20 donors was included in the analysis. (B) Clonotypes from our data were matched against a compiled database of known antigen specificities, including sequences from public databases (e.g., VDJdb, McPAS-TCR, TBAdb, 10X Genomics), and an internally generated Flu database. The matching criteria required CDR3β and HLA identity. The fraction of matching clonotypes in plaque showing specificity to influenza (FLU), cytomegalovirus (CMV), Epstein-Barr virus (EBV), and other antigens is shown. (C) The prevalence of viral-antigen-specific T cells (identified in B) by donor is shown (18 out of 20 donors showed matches). (D) The prevalence of viral-antigen-specific T cells (identified in B) across plaque disease phenotypes. (E) The number of FLU, CMV, and EBV epitope specificities among matching clonotypes in plaque. (F) The number of FLU, CMV, and EBV epitope specificities among matching clonotypes across plaque disease phenotypes.
Figure 4.
Figure 4.. Conserved coronavirus epitope specificities and CDR3β motifs are found in coronary plaque with the highest fraction in the fibroatheroma stage.
(A) Matching the TCR plaque repertoire to a publicly available databases of TCRs with known specificities to SARS-CoV-2 (Adaptive Biotechnologies resources). Because the database is not restricted by MHC HLA type, the matching criteria required CDR3β identity only. Data from 20 donors was included in the analysis. (B) The fraction of matching clonotypes in plaque showing specificity to coronavirus. (C) The prevalence of viral-antigen-specific T cells (identified in B) across plaque disease phenotypes. (D) The number of conserved coronavirus epitope specificities among matching clonotypes in plaque. (E) The number of coronavirus epitope specificities among matching clonotypes across plaque disease phenotypes. (F) Publicly available CDR3β sequences with known SARS-CoV-2 specificities were analyzed using GLIPH2 for the presence of donor-derived plaque-motifs.
Figure 5.
Figure 5.. Viral epitopes share similar amino acid and nucleotide sequences with self-proteins.
(A) Schematic of the application of BLAST and gene expression commons to identify self-proteins with similar amino acid sequences to viral epitopes. Data from 20 donors was included in the analysis. (B) Heatmap showing the expression of self-proteins with similar sequences to viral epitopes across different cell types. Expression is shown as normalized activity as processed by Gene Expression Commons. (C) Expression of selected ubiquitous proteins that share similar sequences with viral epitopes stratified by different cell subtypes. Expression is shown as normalized activity as processed by Gene Expression Commons. A: atria; Ao: aorta; C: coronary; CMs: cardiomyocytes; ECs: endothelial cells; SMCs: smooth muscle cells; V1: ventricle normal; V2: ventricle with CAD; O: other; U: umbilical.
Figure 6.
Figure 6.. Jurkat stimulation assay confirm plaque T cell cross reactivity between viral and self-epitopes.
(A) Schematic of Jurkat stimulation assay. All experiments were performed in triplicate and three triplicates were included for each sample. (B) Representative FACS dot plots showing the CD69 expression on a Jurkat transfectant with and without stimulation (left) with Bar graph display (right). One way ANOVA P value = 1.09×10⁻⁹. Post-hoc P values adjusted for 4 comparisons by the Bonferonni’s multiple comparison test are also shown to compare the differences in CD69 activation after exposure of Jurkat cells expressing a Flu-specific TCR to T2 cells with and without peptide. Jurkat cells vs. T2 cells alone, adjusted P value= 1.14×10⁻¹; T2 cells alone vs. T2 cells + TSPAN17, adjusted P value = 6.65×10⁻⁷; T2 cells alone vs. T2 cells + Zip9, adjusted P value = 3.13×10⁻⁶; T2 cells + M158–66 (Flu), adjusted P value=1.87×10⁻⁹.
Figure 7.
Figure 7.. A pro-inflammatory, cytolytic T cell signature characterizes the complex disease stage.
(A) Schematic of the evaluation of plaque T cell transcriptome with scRNAseq. Experiments were performed from samples collected from 12 donors. (B) Pro-inflammatory and cytolytic genes are upregulated in plaque residing T cells in CD8 Tem2 relative to other clusters, identified using the FindMarkers function with the default non-parametric Wilcoxon rank sum test. Selected genes with log2 fold-change (log2FC) > 0.5 (light pink), 1.0 (dark pink) and 1.5 (purple) are annotated. (C) Average frequencies of plaque T cell clusters showing significant alteration in the CD8 Tem2 cluster with plaque progression. One way ANOVA P = 4.43×10⁻² for comparison of CD8 Tem2 cluster across the 4 individual phenotypes. Post-hoc unpaired Student’s t test P value = 3.04 ×10⁻² adjusted for 4 comparisons by the Tukey method demonstrates significant differences in the frequency of CD8 Tem2 in complex vs, other phenotypes. (D) Dot plot for differentially expressed genes (columns) across 4 pathological disease stages (rows) in the cells in the CD8 Tem2 cluster that do and do not express the activation marker HLA-DRA (rows). Color represents the gene expression (normalized, Z scored) in each disease stage, and size indicates the proportion of cells expressing the selected genes.
Figure 8.
Figure 8.. The transition from lipid-rich plaques to more mature plaques is marked by increasing proportion of T cells expressing the pro-fibrotic protein AREG.
(A) Schematic of evaluation of AREG expression in coronary plaque using scRNAseq. Data from 12 donors was included in the analysis. (B, C) Comparison of AREG expression in lipid and more advanced plaque plotted by uniform manifold approximation and projection (UMAP) dimensionality reduction (B) and by bar graph stratified by donor (C). The P-value of 0.0130 was derived using unpaired Student’s t test. (D) Chord diagram showing significant ligand receptor relationships between T cells and smooth muscle cells (left) and between T cells and macrophages (right). Color scale represents strength of the ligand receptor relationship, based on the total number of interactions between the cell types. The total number of interactions are calculated using the CellPhoneDB algorithm, which measures the mean expression level of the ligand and the receptor in each cell cluster using the log transformed normalized counts. (E) Schematic of in vitro experiment evaluating the effects of AREG on the proliferation of coronary smooth muscle cells (left). Bar chart showing change in cell number before and after treatment of human coronary arterial smooth muscle cells in vitro with and without AREG (right). All experiments were performed in triplicate and 7 replicates were included for each sample. One way ANOVA P value = 2.23×10⁻⁷. Post-hoc P values adjusted for 3 comparisons by the Tukey method comparing AREG treatment to control (media only) are shown. (F) Bar plot of pathway enrichment analysis by GSEA of differentially expressed genes (DEGs) from bulk RNAseq of coronary arterial smooth muscle cells treated in (E). Count represents the number of DEGs enriched in the GO term and adjusted P value indicates the corrected P value by the Benjamini-Hochberg procedure.

Similar articles

Cited by

References

    1. Fernandez DM, Rahman AH, Fernandez NF, Chudnovskiy A, Amir ED, Amadori L, Khan NS, Wong CK, Shamailova R, Hill CA, et al. Single-cell immune landscape of human atherosclerotic plaques. Nat Med. 2019;25:1576–1588. doi: 10.1038/s41591-019-0590-4 - DOI - PMC - PubMed
    1. Depuydt MAC, Prange KHM, Slenders L, Örd T, Elbersen D, Boltjes A, de Jager SCA, Asselbergs FW, de Borst GJ, Aavik E, et al. Microanatomy of the human atherosclerotic plaque by single-Cell transcriptomics. Circ Res. 2020;127:1437–1455. doi: 10.1161/circresaha.120.316770 - DOI - PMC - PubMed
    1. Geginat J, Paroni M, Pagani M, Galimberti D, De Francesco R, Scarpini E, Abrignani S. The enigmatic role of viruses in multiple sclerosis: molecular mimicry or disturbed immune surveillance? Trends in Immunology. 2017;38:498–512. doi: 10.1016/j.it.2017.04.006 - DOI - PMC - PubMed
    1. Virmani R, Burke AP, Farb A, Kolodgie FD. Pathology of the vulnerable plaque. J Am Coll Cardiol. 2006;47:C13–18. doi: 10.1016/j.jacc.2005.10.065 - DOI - PubMed
    1. Hafemeister C, Satija R. Normalization and variance stabilization of single-cell RNA-seq data using regularized negative binomial regression. Genome Biol. 2019;20:296. doi: 10.1186/s13059-019-1874-1 - DOI - PMC - PubMed

Publication types