. 2022;316(2):1519-1541.
doi: 10.1007/s10479-022-04675-7. Epub 2022 Apr 11.

Smart network based portfolios

Affiliations

Smart network based portfolios

Gian Paolo Clemente et al. Ann Oper Res. 2022.

Abstract

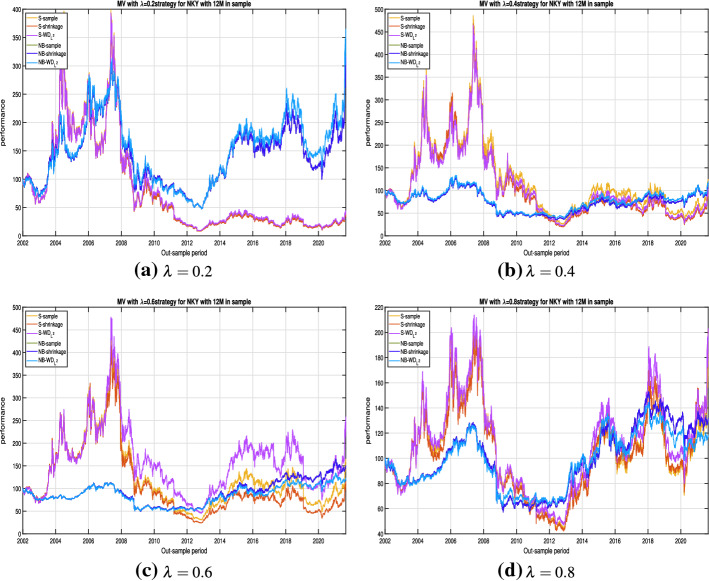
In this article we deal with the problem of portfolio allocation by enhancing network theory tools. We propose the use of the correlation network dependence structure in constructing some well-known risk-based models in which the estimation of the correlation matrix is a building block in the portfolio optimization. We formulate and solve all these portfolio allocation problems using both the standard approach and the network-based approach. Moreover, in constructing the network-based portfolios we propose the use of three different estimators for the covariance matrix: the sample, the shrinkage toward constant correlation and the depth-based estimators . All the strategies under analysis are implemented on three high-dimensional portfolios having different characteristics. We find that the network-based portfolio consistently performs better and has lower risk compared to the corresponding standard portfolio in an out-of-sample perspective.

Supplementary information: The online version contains supplementary material available at 10.1007/s10479-022-04675-7.

Keywords: Dependence; Interconnectedness; Mean-variance; Networks; Portfolio optimization; Smart Beta strategies.


Figures

Fig. 1
Fig. 1
a Pearson Correlation Network computed by using returns of NKY dataset (based on sample estimation) referred to different time periods. The rolling window is one year in-sample. The date in the title is the initial period of the rolling window. Bullets size is proportional to the standard deviation of each firm. Edges opacity is proportional to edges weights (i.e. intensity of correlations). b The optimal network-based sample GMV portfolio referred to the same periods as in a, where the covariance matrix is estimated using the sample approach (NB-sample GMV). In this figure, the bullets size is proportional to the allocated weight. Edges opacity is proportional to edges weights
Fig. 2
Fig. 2
On the left, Pearson Correlation Network computed by using returns of Banks and Insurers dataset (based on sample estimation) referred to the last window, from the beginning of December 2015 to the end of November 2017. Bullets size is proportional to the standard deviation of each firm. Edges opacity is proportional to edges weights (i.e. intensity of correlations). On the right, the optimal network-based sample GMV portfolio (NB-sample GMV) referred to the same period. In this figure, the bullets size is proportional to the allocated weight. Edges opacity is proportional to edges weights
Fig. 3
Fig. 3
Out-of-sample performances for NKY dataset with a rolling window of 1 year in-sample and 1 month out-sample. In ac, we display the out-of-sample performances of EW, S-sample, S-Shrinkage, S-WDL2, NB-sample, NB-Shrinkage and NB-WDL2 of MDP, ERC and GMV models, respectively. In d The best out-of-sample performances for each Smart Beta portfolio (MDP, ERC and GMV) are reported
Fig. 4
Fig. 4
Out-of-sample performances for NKY portfolio with a rolling window of 12 months in-sample and 1 month out-sample. In ad we report the out-of-sample performances for S-sample, S-Shrinkage, S-WDL2, NB-sample, NB-Shrinkage and NB-WDL2 strategies according to alternative values of the trade-off parameter (namely, λ=0.2, λ=0.4, λ=0.6 and λ=0.8 respectively)

References

    1. Amenc N, Goltz F. Smart Beta 2.0. The Journal of Index Investing. 2013;4(3):15–23.
    1. Barrat A, Barthélemy M, Pastor-Satorras R, Vespignani A. The architecture of complex weighted networks. Proceedings of the National Academy of Sciences. 2004;101(11):3747–3752. - PMC - PubMed
    1. Bauder, D., Bodnar, T., Parolya, N., & Schmid, W. (2018). Bayesian mean-variance analysis: Optimal portfolio selection under parameter uncertainty. arXiv:1803.03573
    1. Behr P, Guettler A, Miebs F. On portfolio optimization: Imposing the right constraints. Journal of Banking & Finance. 2013;37(4):1232–1242.
    1. Benati S, Conde E. A relative robust approach on expected returns with bounded CVar for portfolio selection. European Journal of Operational Research. 2022;296(1):332–352.

LinkOut - more resources