. 2022 Mar 31:13:862729.
doi: 10.3389/fphys.2022.862729. eCollection 2022.

Cooling to Hypothermic Circulatory Arrest by Immersion vs. Cardiopulmonary Bypass (CPB): Worse Outcome After Rewarming in Immersion Cooled Pigs

Affiliations

Cooling to Hypothermic Circulatory Arrest by Immersion vs. Cardiopulmonary Bypass (CPB): Worse Outcome After Rewarming in Immersion Cooled Pigs

Ole Magnus Filseth et al. Front Physiol. .

Abstract

Introduction: Cooling by cardiopulmonary bypass (CPB) to deep hypothermic cardiac arrest (HCA) for cardiac surgical interventions, followed by CPB-rewarming is performed on a routine basis with relatively low mortality. In contrast, victims of deep accidental hypothermia rewarmed with CPB generally have a much worse prognosis. Thus, we have developed an intact pig model to compare effects on perfusion pressures and global oxygen delivery (DO2) during immersion cooling versus cooling by CPB. Further, we compared the effects of CPB-rewarming between groups, to restitute cardiovascular function, brain blood flow, and brain metabolism.

Materials and methods: Total sixteen healthy, anesthetized juvenile (2-3 months) castrated male pigs were randomized in a prospective, open placebo-controlled experimental study to immersion cooling (IMM c , n = 8), or cooling by CPB (CPB c , n = 8). After 75 minutes of deep HCA in both groups, pigs were rewarmed by CPB. After weaning from CPB surviving animals were observed for 2 h before euthanasia.

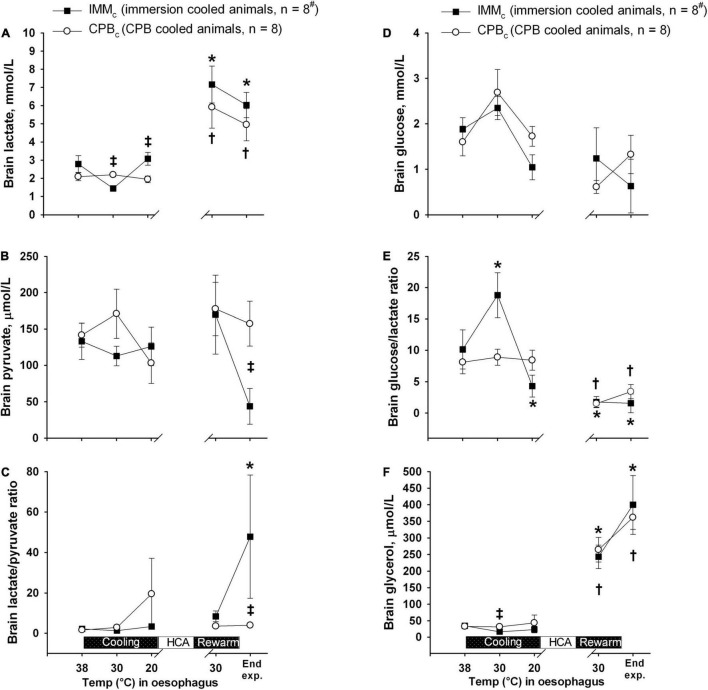
Results: Survival rates at 2 h after completed rewarming were 4 out of 8 in the IMM c group, and 8 out of 8 in the CPB c group. Compared with the CPB c -group, IMM c animals showed significant reduction in DO2, mean arterial pressure (MAP), cerebral perfusion pressure, and blood flow during cooling below 25°C as well as after weaning from CPB after rewarming. After rewarming, brain blood flow returned to control in CPB c animals only, and brain micro dialysate-data showed a significantly increase in the lactate/pyruvate ratio in IMM c vs. CPB c animals.

Conclusion: Our data indicate that, although global O2 consumption was independent of DO2, regional ischemic damage may have taken place during cooling in the brain of IMM c animals below 25°C. The need for prolonged extracorporeal membrane oxygenation (ECMO) should be considered in all victims of accidental hypothermic arrest that cannot be weaned from CPB immediately after rewarming.

Keywords: cardiac index; cardiopulmonary bypass; hypothermia accidental; hypothermia induced; immersion cooling; rewarming.


Conflict of interest statement

The authors declare that the research was conducted in the absence of any commercial or financial relationships that could be construed as a potential conflict of interest.

Figures

FIGURE 1
FIGURE 1
Temperatures at various body locations. (A) Immersion cooled animals (IMMc group), and (B) in animals cooled by CPB (CPBc group). Data presented as mean and SEM. #n was reduced to 4 animals at the end of experiments (End exp.) in IMMc group.
FIGURE 2
FIGURE 2
Time-dependent changes in temperature in esophagus (A) and urinary bladder (B). ↓ denotes start of cooling in either group. Data presented as mean and SEM. Statistically significant difference between groups (p < 0.05). #n was reduced to 4 animals at end of the experiments (End exp.) in IMMc group.
FIGURE 3
FIGURE 3
Blood flow and pressures. (A) Cardiac output and CPB flow (CO/CPB flow). (B) Mean arterial pressure (MAP). (C) Systemic vascular resistance (SVR). (D) Intracranial pressure (ICP). (E) Cerebral perfusion pressure (CPP). Data presented as mean and SEM. Statistically significant difference between groups (p < 0.05). #n was reduced to 5 animals after termination of CPB (Post CPB) and to 4 animals at end of experiments (End exp.) in IMMc group.
FIGURE 4
FIGURE 4
Oxygen variables. (A) Blood hemoglobin (Hb) concentration. (B) Arterial and mixed venous blood oxygen saturation (SaO2 and SVO2). (C) Internal jugular venous blood oxygen saturation (SvjO2). (D) Global delivery of oxygen (DO2). (E) Global consumption of oxygen (VO2). Data presented as mean and SEM. Statistically significant difference between groups (p < 0.05). #n was reduced to 5 animals after termination of CPB (Post CPB) and to 4 animals at end of experiments (End exp.) in IMMc group.
FIGURE 5
FIGURE 5
Brain microdialysate analyses. (A) Brain lactate. (B) Brain pyruvate. (C) Brain lactate/pyruvate ratio. (D) Brain glucose. (E) Brain glucose/lactate ratio. (F) Brain glycerol. Data presented as mean and SEM. *Statistically significant difference from baseline within IMMc group, and within CPBc group (p < 0.05). Statistically significant difference between groups (p < 0.05). #n was reduced to 5 animals after termination of CPB (Post CPB) and to 4 animals at end of experiments (End experiment) in IMMc group.
FIGURE 6
FIGURE 6
Cerebral blood flow. (A): forebrain, (B): cerebellum, (C): hippocampus. Data presented as mean and SEM. *Statistically significant difference from baseline within IMMc group, and within CPBc group (p < 0.05). Statistically significant difference between groups (p < 0.05). #n was reduced to 5 animals after termination of CPB (Post CPB) and to 4 animals at end of experiments (End exp.) in IMMc group.
FIGURE 7
FIGURE 7
Biochemical analyses. (A): Albumin; (B): ASAT; (C): ALAT; (D): Troponin-T (Tn-T). Data presented as mean and SEM. *Statistically significant difference from baseline within IMMc group, and within CPBc group (p < 0.05). Statistically significant difference between groups (p < 0.05).
FIGURE 8
FIGURE 8
Fluid administration and organ edema. (A): Fluid volume administration rate. (B): Postmortem wet/dry organ weight ratio. Data presented as mean and SEM. Statistically significant difference between groups (p < 0.05).

Similar articles

Cited by

References

    1. Bakaeen F. G., Chu D., Huh J., LeMaire S. A., Cornwell L., Sansgiry S., et al. (2010). Outcomes of circulatory arrest procedures for the treatment of thoracic aortic disease at a veterans facility. Am. J. Surg. 200 581–584. 10.1016/j.amjsurg.2010.07.010 - DOI - PubMed
    1. Baumgartner W. A., Silverberg G. D., Ream A. K., Jamieson S. W., Tarabek J., Reitz B. A. (1983). Reappraisal of cardiopulmonary bypass with deep hypothermia and circulatory arrest for complex neurosurgical operations. Surgery 94 242–249. - PubMed
    1. Bigelow W. G., Lindsay W. K., Greenwood W. F. (1950). Hypothermia. Its possible role in cardiac surgery: An investigation of factors governing survival in dogs at low body temperatures. Ann. Surg. 132 849–864. 10.1097/00000658-195011000-00001 - DOI - PMC - PubMed
    1. Bigelow W. G., Mustard W. T., Evans J. G. (1954). Some physiologic consepts of hypothermia and their applications to cardiac surgery. J. thorac. Surg. 28 463–480. 10.1016/s0096-5588(20)30959-4 - DOI - PubMed
    1. Blair E., Montgomery A. V., Swan H. (1956). Posthypothermic circulatory failure I. Physiologic observations on the circulation. Circulation 13 909–915. 10.1161/01.cir.13.6.909 - DOI - PubMed

LinkOut - more resources