. 2022 Apr 1:13:837198.
doi: 10.3389/fmicb.2022.837198. eCollection 2022.

Methane-Derived Carbon as a Driver for Cyanobacterial Growth

Affiliations

Methane-Derived Carbon as a Driver for Cyanobacterial Growth

Slawek Cerbin et al. Front Microbiol. .

Abstract

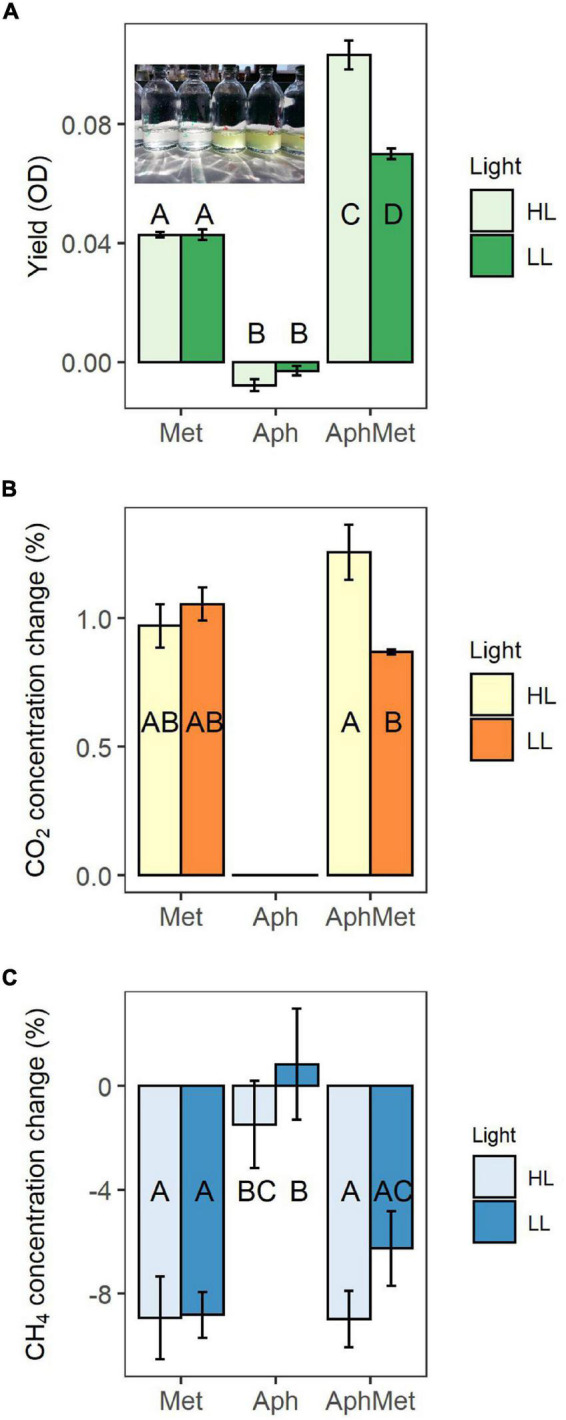
Methane, a potent greenhouse gas produced in freshwater ecosystems, can be used by methane-oxidizing bacteria (MOB) and can therefore subsidize the pelagic food web with energy and carbon. Consortia of MOB and photoautotrophs have been described in aquatic ecosystems and MOB can benefit from photoautotrophs which produce oxygen, thereby enhancing CH4 oxidation. Methane oxidation can account for accumulation of inorganic carbon (i.e., CO2) and the release of exometabolites that may both be important factors influencing the structure of phytoplankton communities. The consortium of MOB and phototroph has been mainly studied for methane-removing biotechnologies, but there is still little information on the role of these interactions in freshwater ecosystems especially in the context of cyanobacterial growth and bloom development. We hypothesized that MOB could be an alternative C source to support cyanobacterial growth in freshwater systems. We detected low δ13C values in cyanobacterial blooms (the lowest detected value -59.97‰ for Planktothrix rubescens) what could be the result of the use of methane-derived carbon by cyanobacteria and/or MOB attached to their cells. We further proved the presence of metabolically active MOB on cyanobacterial filaments using the fluorescein isothiocyanate (FITC) based activity assay. The PCR results also proved the presence of the pmoA gene in several non-axenic cultures of cyanobacteria. Finally, experiments comprising the co-culture of the cyanobacterium Aphanizomenon gracile with the methanotroph Methylosinus sporium proved that cyanobacterial growth was significantly improved in the presence of MOB, presumably through utilizing CO2 released by MOB. On the other hand, 13C-CH4 labeled incubations showed the uptake and assimilation of MOB-derived metabolites by the cyanobacterium. We also observed a higher growth of MOB in the presence of cyanobacteria under a higher irradiance regime, then when grown alone, underpinning the bidirectional influence with as of yet unknown environmental consequences.

Keywords: co-culture; cyanobacteria; greenhouse gases; isotopes; lakes; methane; methane oxidation.


Conflict of interest statement

The authors declare that the research was conducted in the absence of any commercial or financial relationships that could be construed as a potential conflict of interest.

Figures

FIGURE 1
FIGURE 1
Median values of stable carbon isotope signatures (δ13C) of different phytoplankton groups and carbon sources in the sampled lakes during the 2017–2018 monitoring program. Bold horizontal line represents the median values, boxes represent 25th to 75th percentiles, and dots represent outliers.
FIGURE 2
FIGURE 2
Dot plot with pseudo-color visualization of the sorted cell fractions and their gating strategy. (A) FITC gate in the side scatter vs. 580 nm (blue laser) dot plot (FITC+, gate in green). (B) Chlorophyll a gate in the 580 nm (blue laser) vs. 692 nm (blue laser) dot plot (CHLA+, gate in red). (C) Phycocyanin gate in the 720 nm (red laser) vs. 670 nm (red laser) dot plot (PHY+, gate in blue). Sorted cell fractions plotted (ssc vs. 580 nm (blue laser) are shown in the row below, gated with Boolean gating. (D) Free living MOB-like cells (gated as FITC+, CHLA–, PHY–). (E) Active MOB-like cells attached to algae (gated as FITC+, CHLA+, PHY–). (F) Active MOB-like cells attached to cyanobacteria (gated as FITC+, CHLA+, PHY+). (G) Three-channel depicts the presence of FITC+ cells (MOB-like cells, FITC fluorescence in green) attached to a filamentous cyanobacterium (Chlorophyll α autofluorescence in red). The inset depicts the presence of MOB-like cells (FITC +) on the filament. (H) DAPI stained cells. The circle shows the cells that were FITC+ on (G,I). (I) Presence of FITC+ cells on the filament (circle), and the arrows show FITC + cells corresponding to free MOB-like cells. (J) Natural Chl a autofluorescence (red) from a cyanobacterium.
FIGURE 3
FIGURE 3
Yield of mono- and co-cultures expressed through optical density (OD), measured at 750 nm (A), and changes in methane (B) and carbon dioxide (C) concentrations in these incubations. The inset picture represents cultures of Aphanizomenon only (left) and Aphanizomenon with Methylosinus (right) after 12 days. Bars represent the mean ± standard error (n = 5 for each treatment). Met, Methylosinus; Aph, Aphanizomenon; AphMet, mixture of Aphanizomenon and Methylosinus; HL, high light intensity; LL, low light intensity.
FIGURE 4
FIGURE 4
Yield of Methylosinus in the absence (Met) and presence (AphMet) of Aphanizomenon gracile under high light (HL) and low light (LL) conditions. The growth of Methylosinus is expressed as the number of pmoA gene copies per mL of medium. The same letters indicate homogenous groups. Bars represent the mean ± standard error (n = 5 for each treatment).
FIGURE 5
FIGURE 5
Yield of cyanobacteria during the experiment. Bars represent the means ± 1 standard error (n = 5 for each treatment).
FIGURE 6
FIGURE 6
Log 13C content, as assimilated in individual PLFA molecules in mono- or co-cultures of Aphanizomenon (Aph) or Methylosinus (Met) expressed as μg of 13C per dry weight of total culture used in PLFA extraction. If 13C incorporation in this figure is higher than 0, the PLFA is enriched compared to control with 12C only. Aph + SM represents monocultures of Aphanizomenon with spent medium added originating from a Methylosinus monoculture grown with 13C methane. The δ13C PLFA of labeled and unlabeled control samples was used to calculate the excess amount of 13C in each PLFA biomarker. Bars represent means (n = 4) ± 1 SE.

References

    1. Agasild H., Panksep K., Tõnno I., Blank K., Kõiv T., Freiberg, et al. (2019). Role of potentially toxic cyanobacteria in crustacean zooplankton diet in a Eutrophic lake. Harmful Algae 89:101688. 10.1016/j.hal.2019.101688 - DOI - PubMed
    1. Agasild H., Zingel P., Tuvikene L., Tuvikene A., Timm H., Feldmann T., et al. (2014). Biogenic methane contributes to the food web of a large, shallow lake. Freshw. Biol. 59 272–285. 10.1111/fwb.12263 - DOI
    1. Badr K., Hilliard M., Roberts N., He Q. P., Wang J. (2019). Photoautotroph-methanotroph coculture – a flexible platform for efficient biological CO2-CH4 Co-utilization. IFAC-PapersOnLine 52 916–921. 10.1016/j.ifacol.2019.06.179 - DOI
    1. Ballen-Segura M., Felip M., Catalan J. (2017). Some mixotrophic flagellate species selectively graze on archaea. Appl. Environ. Microbiol. 83 e2317–e2316. 10.1128/AEM.02317-16 - DOI - PMC - PubMed
    1. Balmer M., Downing J. (2011). Carbon dioxide concentrations in eutrophic lakes: undersaturation implies atmospheric uptake. Inland Waters 1 125–132. 10.5268/iw-1.2.366 - DOI

LinkOut - more resources