. 2022 Apr 8:2022:3623591.
doi: 10.1155/2022/3623591. eCollection 2022.

Protective Prognostic Biomarkers Negatively Correlated with Macrophage M2 Infiltration in Low-Grade Glioma

Affiliations

Protective Prognostic Biomarkers Negatively Correlated with Macrophage M2 Infiltration in Low-Grade Glioma

Yunyang Zhu et al. J Oncol. .

Abstract

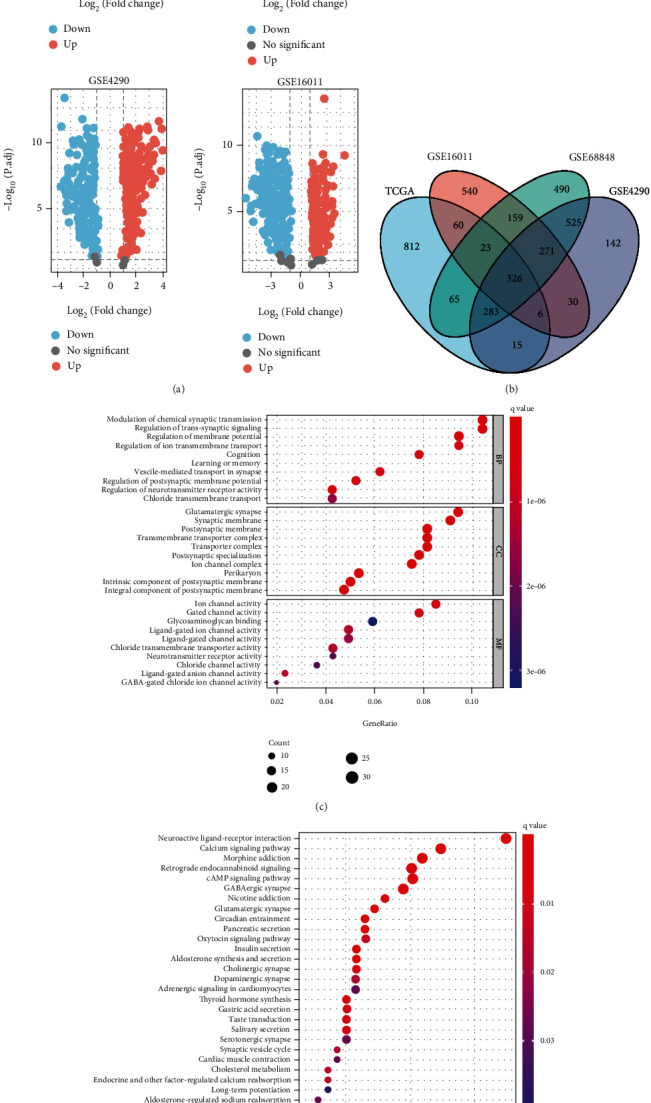
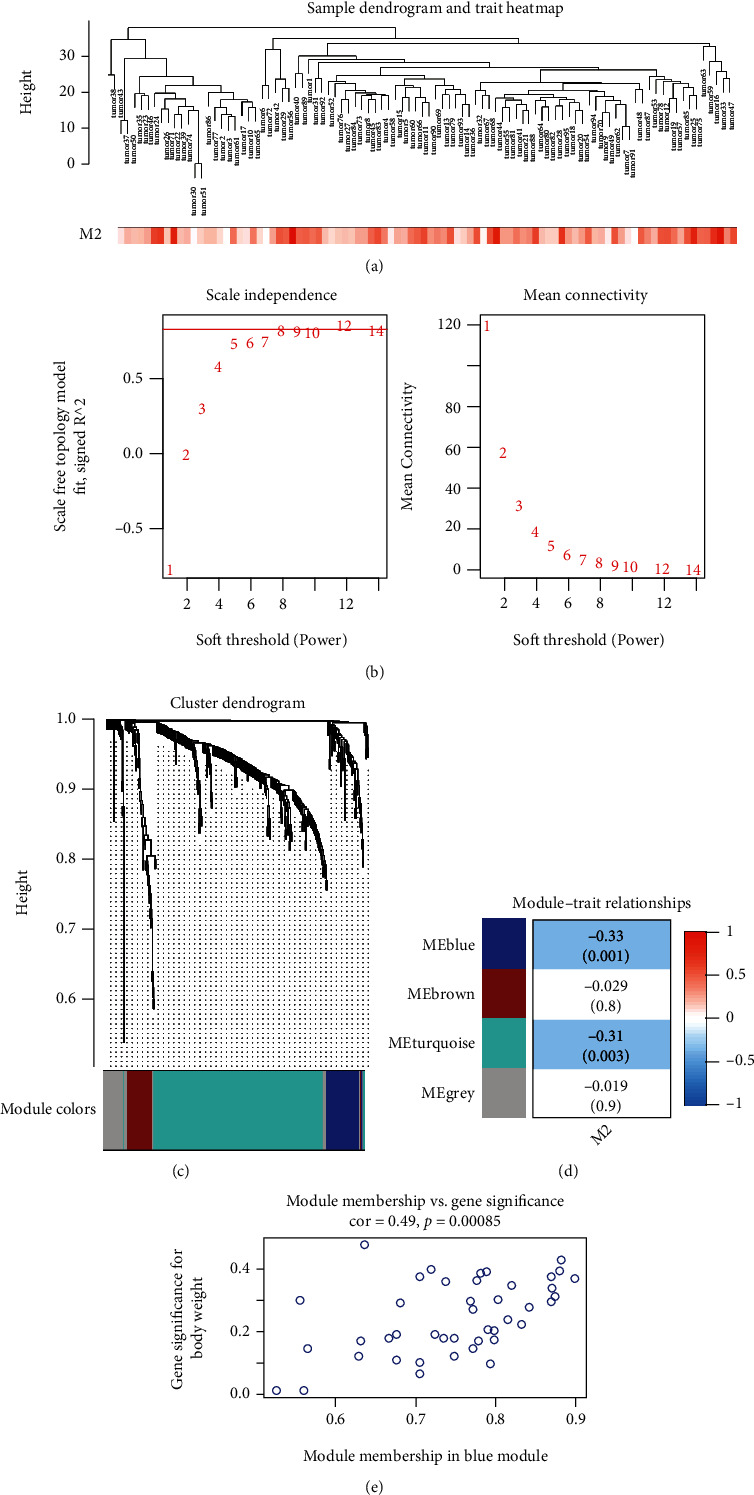
Tumor-associated Macrophages (TAMs) play a vital role in the progression of glioma. Macrophage M2 has been confirmed to promote immunosuppression and proliferation of low-grade glioma (LGG). Here, we searched for genes negatively correlated with Macrophages M2 by bioinformatical methods and investigated their protective ability for prognosis. LGG and adjacent normal samples were screened out in TCGA and three GEO datasets. 326 overlapped differentially expressed genes were calculated, and their biological functions were investigated by Go and KEGG analyses. Macrophage M2 accounted for the highest proportion among all 22 immune cells by CIBERSORT deconvolution algorithm. The proportion of Macrophage M2 in LGG was also higher than that in normal tissue according to several deconvolution algorithms. 43 genes in the blue module negatively correlated with Macrophage M2 infiltration were identified by weighted gene coexpression network analysis (WGCNA). Through immune infiltration and correlation analysis, FGFBP3, VAX2, and SHD were selected and they were enriched in G protein-coupled receptors' signaling regulation and cytokine receptor interaction. They could prolong the overall and disease-free survival time. Univariate and multivariate Cox regression analyses were applied to evaluate prognosis prediction ability. Interestingly, FGFBP3 and AHD were independent prognostic predictors. A nomogram was drawn, and its 1-year, 3-year, and 5-year survival prognostic value was verified by ROC curves and calibration plots. In conclusion, FGFBP3, VAX2, and SHD were protective prognostic biomarkers against Macrophage M2 infiltration in low-grade glioma. The FGFBP3 and SHD were independent factors to effectively predict long-term survival probability.


Conflict of interest statement

The authors declare that they have no conflicts of interest.

Figures

Figure 1
Figure 1
Differential expression analysis and functional enrichment analysis. (a) Volcano plot of differential expression genes of LGG in TCGA, GSE68848, GES4290, and GSE16011 databases. (b) The Venn diagram for overlapping DEGs. (c). GO enrichment analysis (top 10 in each section). BP: biological process; CC: cellular component; MF: molecular function. (d) KEGG enrichment analysis (top 30 KEGG terms).
Figure 2
Figure 2
Proportion of 22 immune cells calculated by CIBERSORT. The immunocyte proportion of LGG in the (a) TCGA dataset, (b) GSE16011 dataset, (c) GSE4290 dataset, and (d) GSE68848 dataset. (e) The immunocyte proportion between LGG and adjacent normal tissue in GSE68848 dataset. p < 0.05, ∗∗p < 0.01, ∗∗∗p < 0.001, ns: no statistical significance.
Figure 3
Figure 3
WGCNA analysis. (a) Clustering dendrogram of LGG samples in GSE68848 and heat map of Macrophage M2. (b) Selection of soft thresholding power (optimal β = 8). (c) Dendrogram of different modules. (d) The relationship between coexpression modules and Macrophage M2 proportion (the correlation value was labelled in each square, and the corresponding p value was labelled in the bracket) (e) The scatter plot of blue module membership vs gene significance (correlation value = 0.49, p < 0.001).
Figure 4
Figure 4
Correlation of tumor purity and immune cell infiltration (CD8+ T cell, CD4+ T cell, Macrophage, B cell, neutrophil, and dendritic cell) with (a) FGFBP3, (b) VAX2, and (c) SHD.(p values < 0.001)).
Figure 5
Figure 5
Expression and prognosis of hub genes negatively correlated with Macrophage M2. (a) Expression of FGFBP3 between LGG and normal tissue(left figure, red column: LGG, gray column: normal tissue, p < 0.05); the overall survival (mid figure, red curve: high FGFBP3 expression, blue curve: low FGFBP3 expression, p < 0.01) and disease free survival curves (right, p < 0.01). (b) FGFBP3 expression (p > 0.05), OS (p > 0.05), and DFS (p > 0.05) in GBM. (c) VAX2 expression (p < 0.05), OS (p < 0.05), and DFS (p < 0.05) in LGG. (d) VAX2 expression (p < 0.05), OS (p > 0.05), and DFS (p > 0.05) in GBM. (e) SHD expression (p < 0.05), OS (p < 0.01), and DFS (p < 0.01) in LGG. (f) SHD expression (p > 0.05) OS p > 0.05), and DFS prognosis (p > 0.05) in GBM.
Figure 6
Figure 6
GSEA enrichment results in TCGA-LGG dataset, including FGFBP3, VAX2, and SHD.
Figure 7
Figure 7
Assessment the prediction accuracy of prognostic factors. The risk score distribution in training dataset (a) and testing dataset (d). Kaplan-Meier curves for OS based on the risk score in the training dataset (b) and testing dataset (e). (shaded areas represent 95% confidence intervals. Patient number of different risk ranks at different times is listed below the curve. p values < 0.01). Time-dependent ROC curve of 1-year, 3-year, and 5-year survival rate in training dataset (c) and testing dataset (f).
Figure 8
Figure 8
Univariate and multivariate Cox proportional hazard regression analysis of age, gender, and risk score. (a) Univariate Cox in training dataset. (b) Multivariate Cox in training dataset. (c) Univariate Cox in testing dataset. (d) Multivariate Cox in testing dataset.
Figure 9
Figure 9
(a) Nomogram for protective prognostic factors against Macrophage M2 infiltration in LGG. (b) 1-year (c) 3-year, and (d) 5-year calibration plots of the nomogram.
Figure 10
Figure 10
1-year, 3-year, and 5-year ROC curves for nomogram in the training dataset (a) and testing dataset (b).

References

    1. Duffau H., Taillandier L. New concepts in the management of diffuse low-grade glioma: proposal of a multistage and individualized therapeutic approach. Neuro-Oncology . 2015;17(3):332–342. doi: 10.1093/neuonc/nou153. - DOI - PMC - PubMed
    1. Wessels P. H., Weber W. E., Raven G., Ramaekers F. C. S., Hopman A. H. N., Twijnstra A. Supratentorial grade II astrocytoma: biological features and clinical course. Lancet Neurology . 2003;2(7):395–403. doi: 10.1016/S1474-4422(03)00434-4. - DOI - PubMed
    1. Delgado-López P. D., Corrales-García E. M., Martino J., Lastra-Aras E., Dueñas-Polo M. T. Diffuse low-grade glioma: a review on the new molecular classification, natural history and current management strategies. Clinical & Translational Oncology . 2017;19(8):931–944. doi: 10.1007/s12094-017-1631-4. - DOI - PubMed
    1. Louis D. N., Perry A., Burger P., et al. International society of neuropathology--Haarlem consensus guidelines for nervous system tumor classification and grading. Brain Pathology . 2014;24(5):429–435. doi: 10.1111/bpa.12171. - DOI - PMC - PubMed
    1. Louis D. N., Perry A., Reifenberger G., et al. The 2016 World Health Organization classification of tumors of the central nervous system: a summary. Acta Neuropathologica . 2016;131(6):803–820. doi: 10.1007/s00401-016-1545-1. - DOI - PubMed

LinkOut - more resources