

Conformational design concepts for anions in ionic liquids
- PMID: 35432848
- PMCID: PMC8959527
- DOI: 10.1039/d0sc01379j
Conformational design concepts for anions in ionic liquids
Abstract
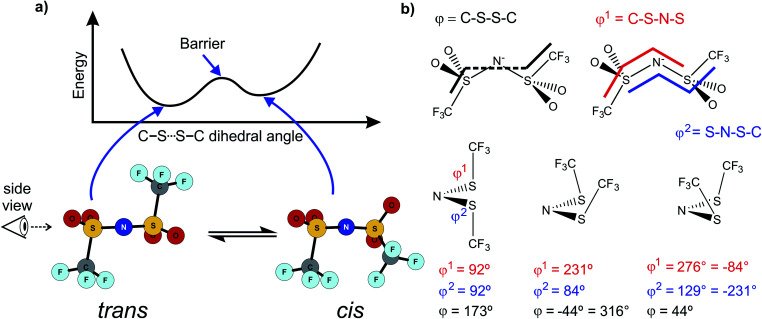
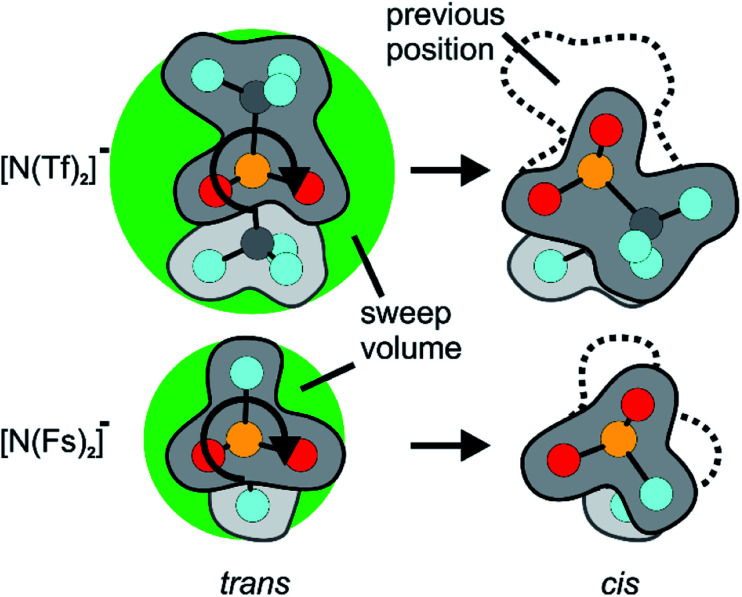
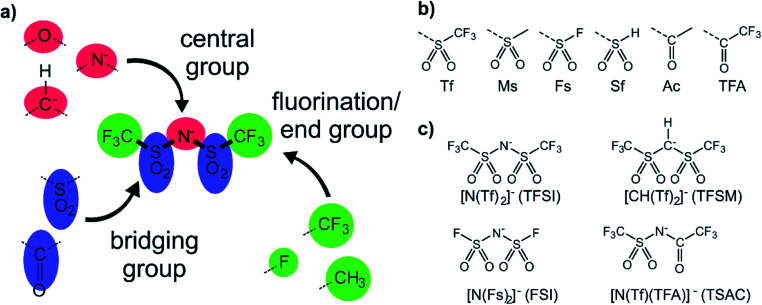
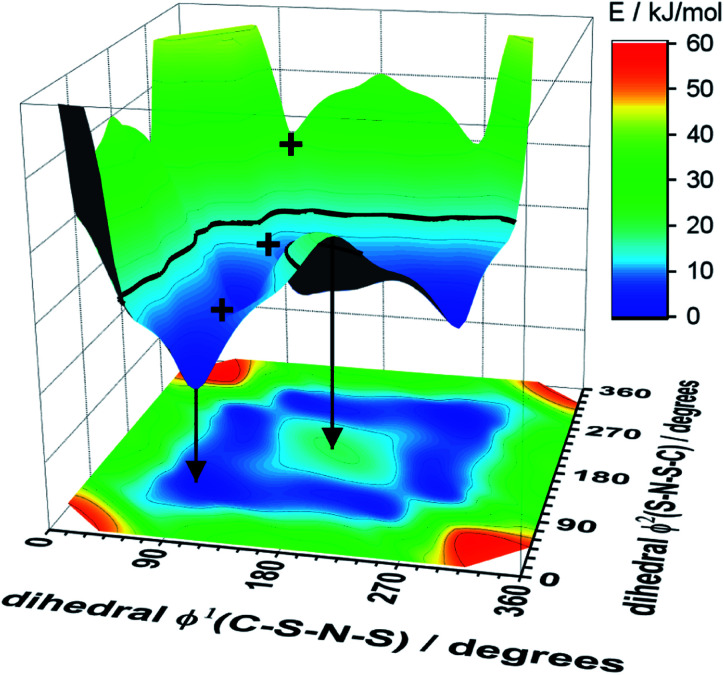
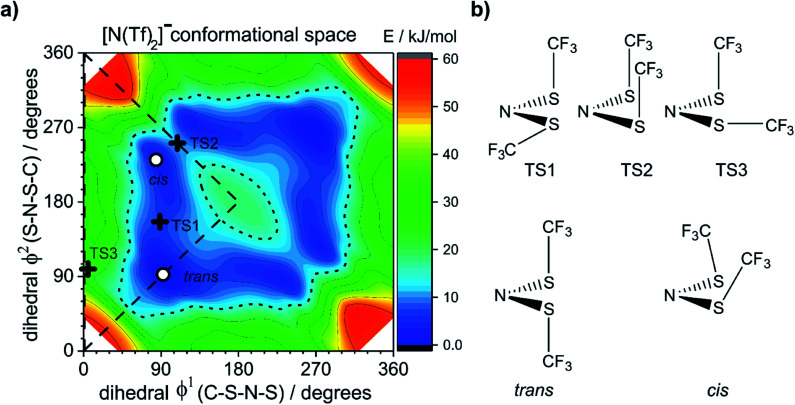
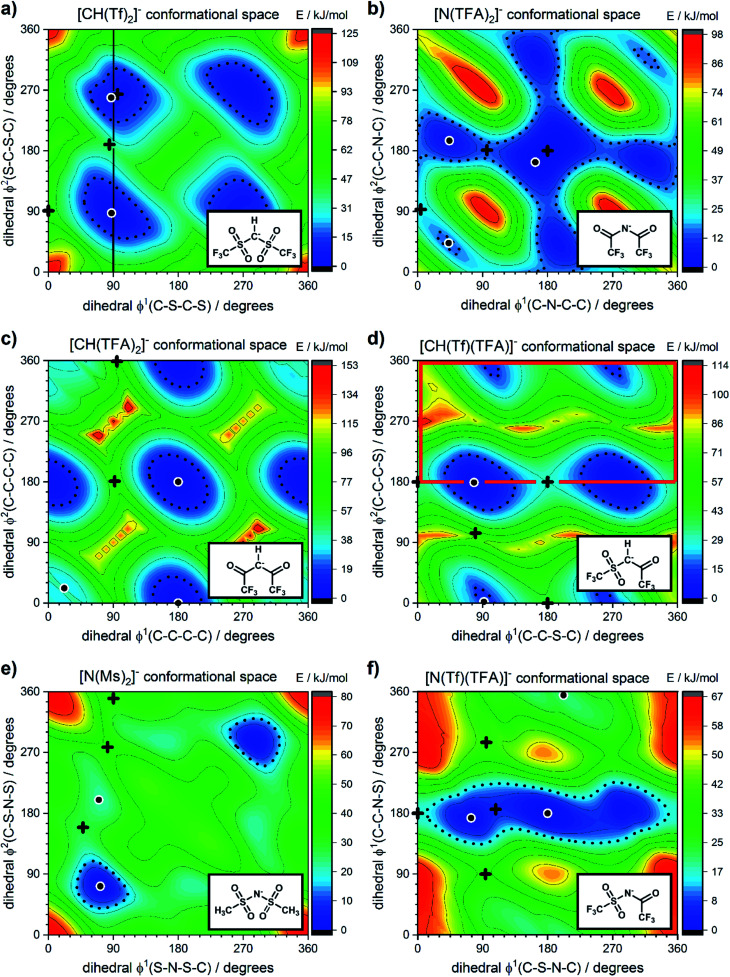
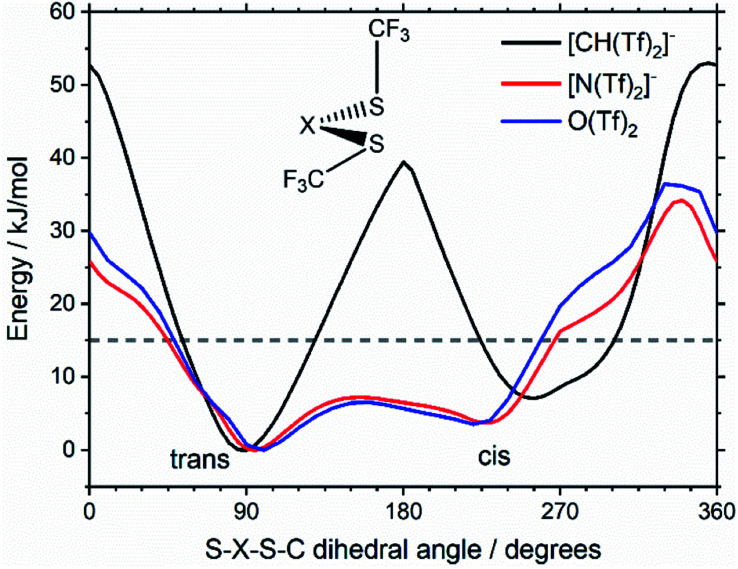
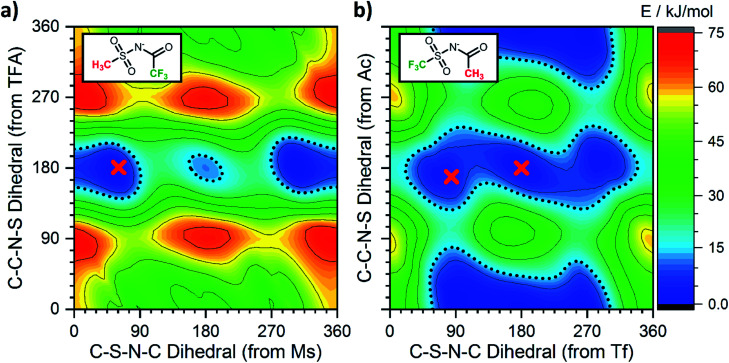
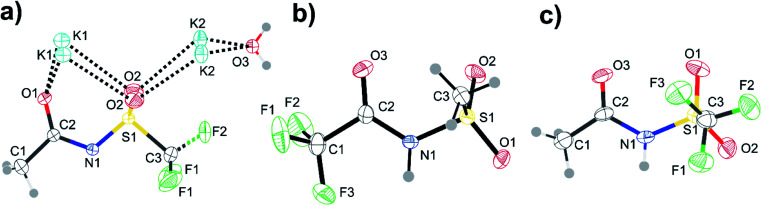
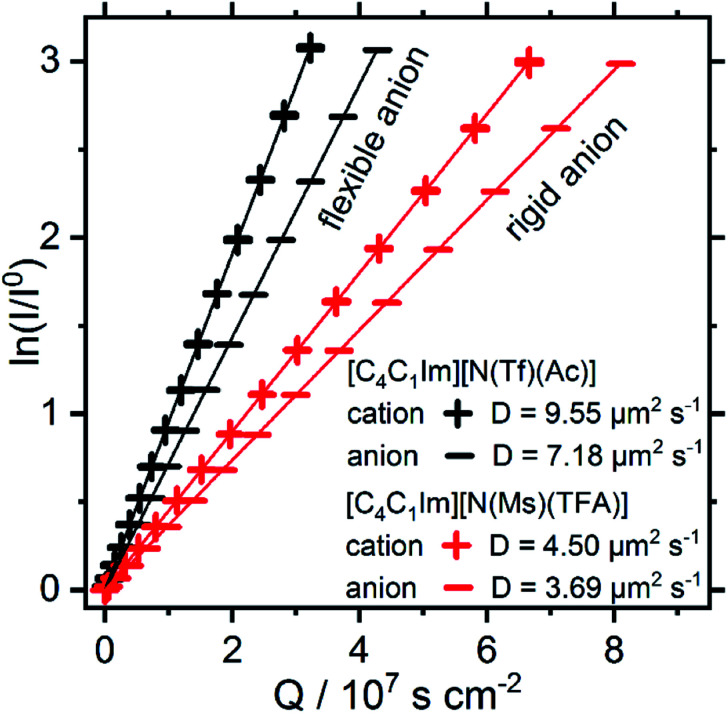
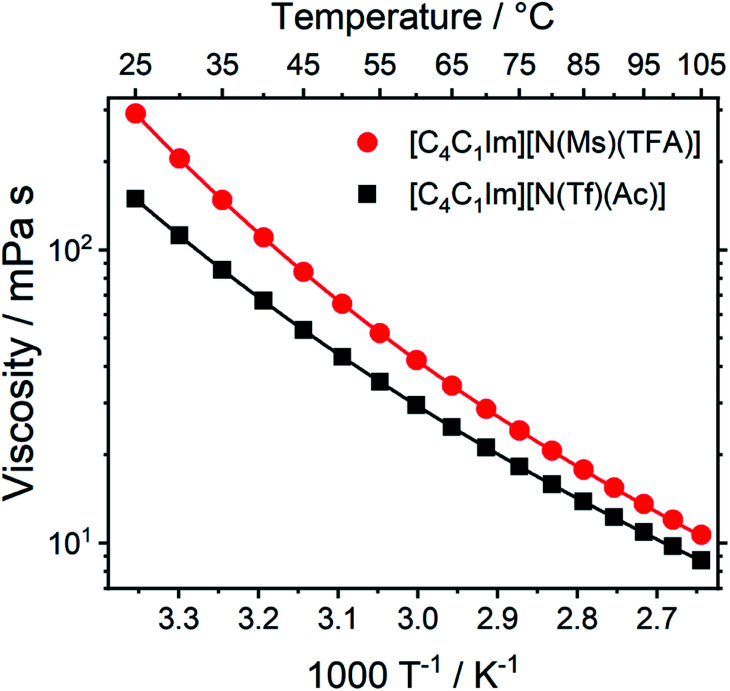
The identification of specific design concepts for the in silico design of ionic liquids (ILs) has been accomplished using theoretical methods. Molecular building blocks, such as interchangeable functional groups, are used to design a priori new ILs which have subsequently been experimentally investigated. The conformational design concepts are developed by separately and systematically changing the central (imide), bridging (sulfonyl) and end (trifluoromethyl) group of the bis(trifluoromethanesulfonyl)imide [N(Tf)2]- anion and examining the resultant potential energy surfaces. It is shown that these design concepts can be used to tune separately the minimum energy geometry, transition state barrier height and relative stability of different conformers. The insights obtained have been used to design two novel anions for ILs, trifluoroacetyl(methylsulfonyl)imide [N(Ms)(TFA)]- and acetyl(trifluoromethanesulfonyl)imide [N(Tf)(Ac)]-. The computationally predicted structures show excellent agreement with experimental structures obtained from X-ray crystallography. [C4C1im][N(Tf)(Ac)] and [C4C1im][N(Ms)(TFA)] ILs have been synthesised and ion diffusion coefficients examined using pulsed field gradient stimulated echo NMR spectroscopy. Significantly increased diffusion was observed for the more flexible [N(Tf)(Ac)]- compared with the more rigid [N(Ms)(TFA)]- analogue. Furthermore, a pronounced impact on the fluidity was observed. The viscosity of the IL with the rigid anion was found to be twice as high as the viscosity of the IL with the flexible anion. The design concepts presented in this work will enable researchers in academia and industry to tailor anions to provide ILs with specific desired properties.
This journal is © The Royal Society of Chemistry.
Conflict of interest statement
There are no conflicts to declare.
Figures
Similar articles
-
Insights into structure-property relationships in ionic liquids using cyclic perfluoroalkylsulfonylimides.Chem Sci. 2023 Jan 30;14(8):2200-2214. doi: 10.1039/d2sc06758g. eCollection 2023 Feb 22. Chem Sci. 2023. PMID: 36845914 Free PMC article.
-
Ether-bond-containing ionic liquids and the relevance of the ether bond position to transport properties.J Phys Chem B. 2010 Oct 7;114(39):12488-94. doi: 10.1021/jp104419k. J Phys Chem B. 2010. PMID: 20839836
-
Molecular dynamics simulation and pulsed-field gradient NMR studies of bis(fluorosulfonyl)imide (FSI) and bis[(trifluoromethyl)sulfonyl]imide (TFSI)-based ionic liquids.J Phys Chem B. 2010 May 27;114(20):6786-98. doi: 10.1021/jp911950q. J Phys Chem B. 2010. PMID: 20433203
-
Pyrazolium- versus imidazolium-based ionic liquids: structure, dynamics and physicochemical properties.J Phys Chem B. 2013 Jan 17;117(2):668-76. doi: 10.1021/jp3107793. Epub 2013 Jan 3. J Phys Chem B. 2013. PMID: 23252760
-
Ionic liquids for nano- and microstructures preparation. Part 2: Application in synthesis.Adv Colloid Interface Sci. 2016 Jan;227:1-52. doi: 10.1016/j.cis.2015.08.010. Epub 2015 Aug 29. Adv Colloid Interface Sci. 2016. PMID: 26520242 Review.
Cited by
-
Mapping the Crystallographic Landscape of Antivitamin Ionic Liquids: Structural Blueprints for Novel Architectures.Cryst Growth Des. 2025 May 23;25(11):3968-3979. doi: 10.1021/acs.cgd.5c00378. eCollection 2025 Jun 4. Cryst Growth Des. 2025. PMID: 40486999 Free PMC article.
-
Insights into structure-property relationships in ionic liquids using cyclic perfluoroalkylsulfonylimides.Chem Sci. 2023 Jan 30;14(8):2200-2214. doi: 10.1039/d2sc06758g. eCollection 2023 Feb 22. Chem Sci. 2023. PMID: 36845914 Free PMC article.
-
Structural Properties of [N1888][TFSI] Ionic Liquid: A Small Angle Neutron Scattering and Polarizable Molecular Dynamics Study.J Phys Chem B. 2024 Nov 14;128(45):11313-11327. doi: 10.1021/acs.jpcb.4c06255. Epub 2024 Nov 5. J Phys Chem B. 2024. PMID: 39498611 Free PMC article.
-
Physicochemical properties and density functional theory calculation of octahedral UiO-66 with Bis(Trifluoromethanesulfonyl)imide ionic liquids.Heliyon. 2023 Oct 6;9(10):e20743. doi: 10.1016/j.heliyon.2023.e20743. eCollection 2023 Oct. Heliyon. 2023. PMID: 37867795 Free PMC article.
-
Flexibility is the key to tuning the transport properties of fluorinated imide-based ionic liquids.Chem Sci. 2022 Aug 3;13(32):9176-9190. doi: 10.1039/d2sc03074h. eCollection 2022 Aug 17. Chem Sci. 2022. PMID: 36093026 Free PMC article.
References
LinkOut - more resources
Full Text Sources
Miscellaneous