

Synaptotagmin-1 C2B domains cooperatively stabilize the fusion stalk via a master-servant mechanism
- PMID: 35432859
- PMCID: PMC8943895
- DOI: 10.1039/d1sc06711g
Synaptotagmin-1 C2B domains cooperatively stabilize the fusion stalk via a master-servant mechanism
Abstract
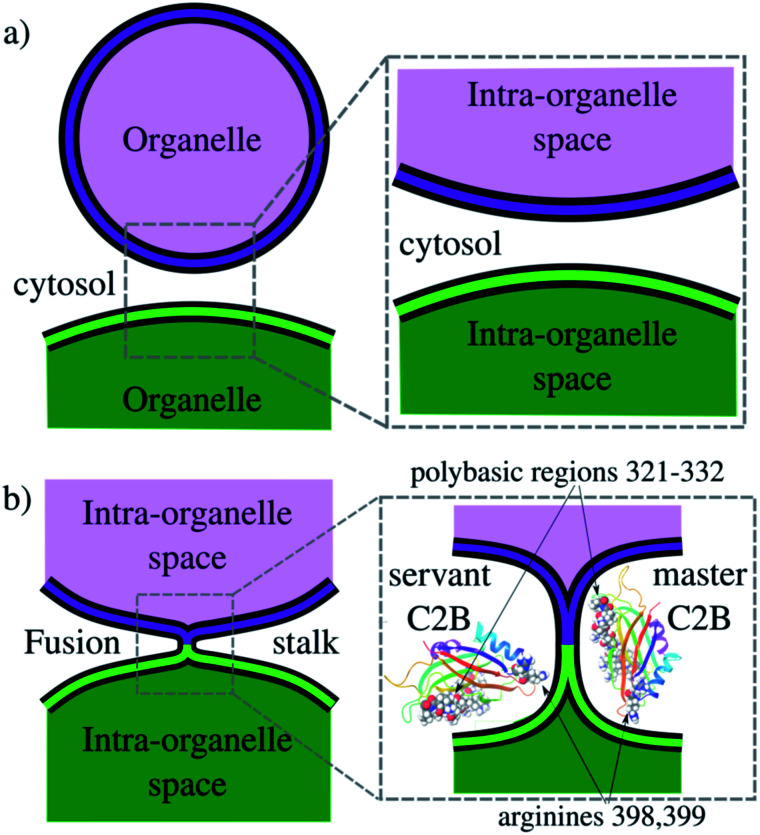
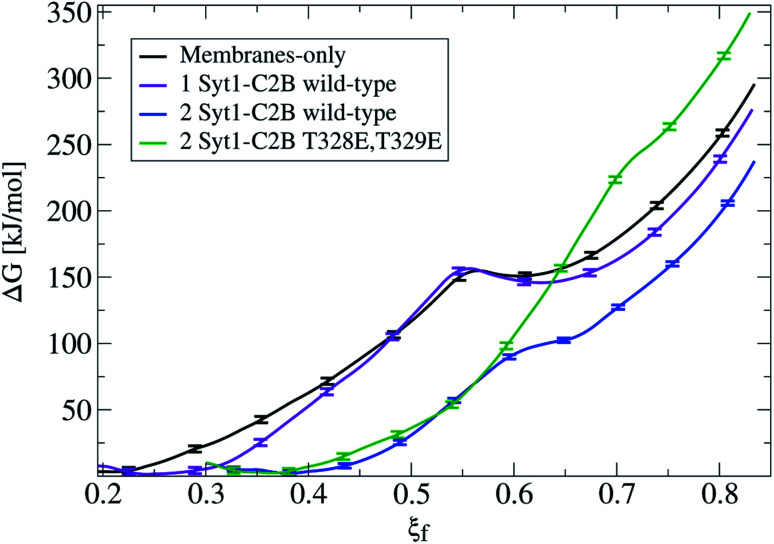
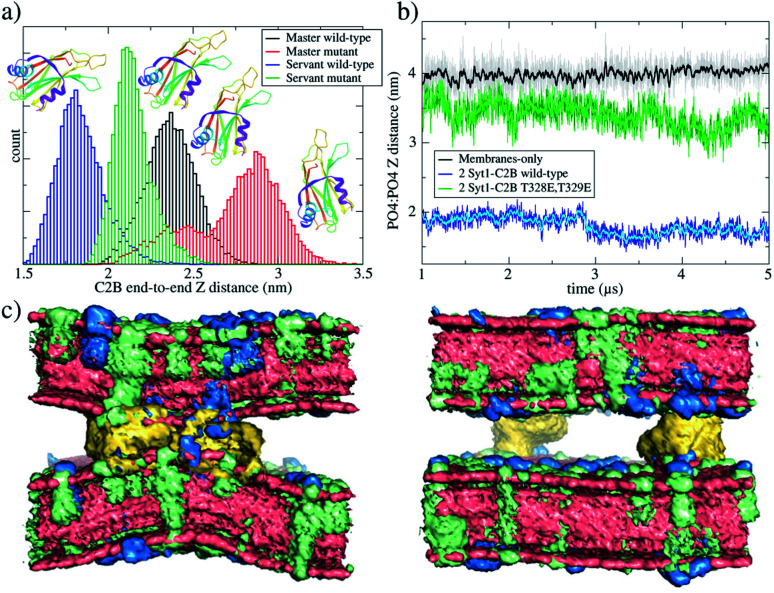
Synaptotagmin-1 is a low-affinity Ca2+ sensor that triggers synchronous vesicle fusion. It contains two similar C2 domains (C2A and C2B) that cooperate in membrane binding, being the C2B domain mainly responsible for the membrane fusion process due to its polybasic patch KRLKKKKTTIKK (321-332). In this work, a master-servant mechanism between two identical C2B domains is shown to control the formation of the fusion stalk in a calcium-independent manner. Two regions in C2B are essential for the process, the well-known polybasic patch and a recently described pair of arginines (398 399). The master domain shows strong PIP2 interactions with its polybasic patch and its pair of arginines. At the same time, the servant analogously cooperates with the master to reduce the total work to form the fusion stalk. The strategic mutation (T328E, T329E) in both master and servant domains disrupts the cooperative mechanism, drastically increasing the free energy needed to induce the fusion stalk, however, with negligible effects on the master domain interactions with PIP2. These data point to a difference in the behavior of the servant domain, which is unable to sustain its PIP2 interactions neither through its polybasic patch nor through its pair of arginines, and in the end, losing its ability to assist the master in the formation of the fusion stalk.
This journal is © The Royal Society of Chemistry.
Conflict of interest statement
There are no conflicts to declare.
Figures

Similar articles
-
Polybasic Patches in Both C2 Domains of Synaptotagmin-1 Are Required for Evoked Neurotransmitter Release.J Neurosci. 2022 Jul 27;42(30):5816-5829. doi: 10.1523/JNEUROSCI.1385-21.2022. Epub 2022 Jun 14. J Neurosci. 2022. PMID: 35701163 Free PMC article.
-
Genetic analysis of synaptotagmin C2 domain specificity in regulating spontaneous and evoked neurotransmitter release.J Neurosci. 2013 Jan 2;33(1):187-200. doi: 10.1523/JNEUROSCI.3214-12.2013. J Neurosci. 2013. PMID: 23283333 Free PMC article.
-
Synaptotagmin-1 C2B domain interacts simultaneously with SNAREs and membranes to promote membrane fusion.Elife. 2016 Apr 15;5:e14211. doi: 10.7554/eLife.14211. Elife. 2016. PMID: 27083046 Free PMC article.
-
Membrane Association and Functional Mechanism of Synaptotagmin-1 in Triggering Vesicle Fusion.Biophys J. 2020 Sep 15;119(6):1255-1265. doi: 10.1016/j.bpj.2020.08.008. Epub 2020 Aug 14. Biophys J. 2020. PMID: 32882186 Free PMC article.
-
Membrane-Binding Cooperativity and Coinsertion by C2AB Tandem Domains of Synaptotagmins 1 and 7.Biophys J. 2019 Mar 19;116(6):1025-1036. doi: 10.1016/j.bpj.2019.01.035. Epub 2019 Feb 5. Biophys J. 2019. PMID: 30795874 Free PMC article.
Cited by
-
Two modes of fusogenic action for influenza virus fusion peptide.PLoS Comput Biol. 2023 May 26;19(5):e1011174. doi: 10.1371/journal.pcbi.1011174. eCollection 2023 May. PLoS Comput Biol. 2023. PMID: 37235589 Free PMC article.
-
Requirement of Cholesterol for Calcium-Dependent Vesicle Fusion by Strengthening Synaptotagmin-1-Induced Membrane Bending.Adv Sci (Weinh). 2023 May;10(15):e2206823. doi: 10.1002/advs.202206823. Epub 2023 Apr 14. Adv Sci (Weinh). 2023. PMID: 37058136 Free PMC article.
-
α-Synuclein is required for sperm exocytosis at a post-fusion stage.Front Cell Dev Biol. 2023 May 23;11:1125988. doi: 10.3389/fcell.2023.1125988. eCollection 2023. Front Cell Dev Biol. 2023. PMID: 37287458 Free PMC article.
References
LinkOut - more resources
Full Text Sources
Miscellaneous