

Unique assembly of carbonylpyridinium and chromene reveals mitochondrial thiol starvation under ferroptosis and novel ferroptosis inducer
- PMID: 35432896
- PMCID: PMC8966632
- DOI: 10.1039/d2sc00328g
Unique assembly of carbonylpyridinium and chromene reveals mitochondrial thiol starvation under ferroptosis and novel ferroptosis inducer
Abstract
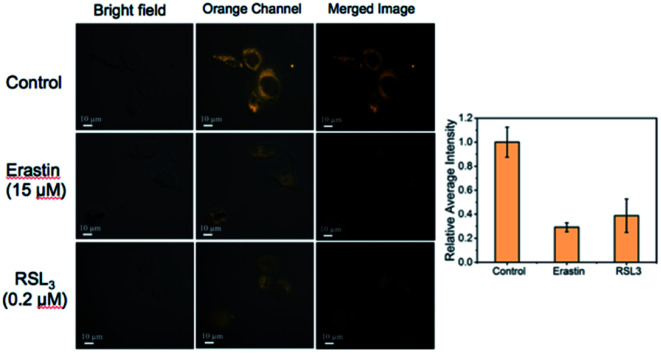
To reveal the delicate function of mitochondria, spatiotemporally precise detection tools remain highly desirable. However, current probes with positively charged warheads for targeting mitochondria diffuse out of the mitochondria as the potential of the mitochondrial membrane changes, which directly influences the accuracy of the detection. Herein, we assembled carbonylpyridinium and chromene to afford the probe CM-Mit. Following the ultrafast response to thiol and the dissociation of carbonylpyridinium, the formation of o-quinone methide from CM-Mit was proposed to label proteins, thus avoiding diffusion out of the mitochondria. Therefore, the accurate spatiotemporal detection of thiol in mitochondria was realized. With this excellent probe, ferroptosis inducers were proved to stimulate thiol starvation in mitochondria for the first time in cancer cells. Moreover, CM-Mit was used to screen a compound library developed in-house and the stemona alkaloid analog SA-11 was shown to induce ferroptosis in various cancer cell lines, including a drug-resistant one.
This journal is © The Royal Society of Chemistry.
Conflict of interest statement
There are no conflicts to declare.
Figures


Similar articles
-
A thiol-triggered croconaine-chromene integration to induce ferroptosis and photothermal synergistic efficient tumor ablation.Chem Sci. 2024 Aug 16;15(36):14924-30. doi: 10.1039/d4sc03688c. Online ahead of print. Chem Sci. 2024. PMID: 39246356 Free PMC article.
-
Imaging of Mitophagy Enabled by an Acidity-Reporting Probe Anchored on the Mitochondrial Inner Membrane.Anal Chem. 2021 Dec 21;93(50):16887-16898. doi: 10.1021/acs.analchem.1c03881. Epub 2021 Dec 12. Anal Chem. 2021. PMID: 34894657
-
Thiol "Click" Chromene Ring Opening and Subsequent Cascade Nucleophilic Cyclization NIR Fluorescence Imaging Reveal High Levels of Thiol in Drug-Resistant Cells.Anal Chem. 2020 Dec 15;92(24):15936-15942. doi: 10.1021/acs.analchem.0c03362. Epub 2020 Nov 23. Anal Chem. 2020. PMID: 33226207
-
The Multifaceted Regulation of Mitochondria in Ferroptosis.Life (Basel). 2021 Mar 10;11(3):222. doi: 10.3390/life11030222. Life (Basel). 2021. PMID: 33801920 Free PMC article. Review.
-
Ferroptosis and Cancer: Mitochondria Meet the "Iron Maiden" Cell Death.Cells. 2020 Jun 20;9(6):1505. doi: 10.3390/cells9061505. Cells. 2020. PMID: 32575749 Free PMC article. Review.
Cited by
-
A thiol-triggered croconaine-chromene integration to induce ferroptosis and photothermal synergistic efficient tumor ablation.Chem Sci. 2024 Aug 16;15(36):14924-30. doi: 10.1039/d4sc03688c. Online ahead of print. Chem Sci. 2024. PMID: 39246356 Free PMC article.
-
Mitochondrial Targeting and Imaging with Small Organic Conjugated Fluorophores: A Review.Chemistry. 2022 Dec 27;28(72):e202202366. doi: 10.1002/chem.202202366. Epub 2022 Oct 26. Chemistry. 2022. PMID: 36121738 Free PMC article. Review.
-
Stemona alkaloid derivative induce ferroptosis of colorectal cancer cell by mediating carnitine palmitoyltransferase 1.Front Chem. 2024 Oct 3;12:1478674. doi: 10.3389/fchem.2024.1478674. eCollection 2024. Front Chem. 2024. PMID: 39421605 Free PMC article.
References
-
- Booty L. M. Gawel J. M. Cvetko F. Caldwell S. T. Hall A. R. Mulvey J. F. James A. M. Hinchy E. C. Prime T. A. Arndt S. Beninca C. Bright T. P. Clatworthy M. R. Ferdinand J. R. Prag H. A. Logan A. Prudent J. Krieg T. Hartley R. C. Murphy M. P. Cell Chem. Biol. 2019;26:449. doi: 10.1016/j.chembiol.2018.12.002. - DOI - PMC - PubMed
LinkOut - more resources
Full Text Sources