. 2022 Feb 10;13(13):3674-3687.
doi: 10.1039/d1sc05892d. eCollection 2022 Mar 30.

Computationally driven discovery of SARS-CoV-2 Mpro inhibitors: from design to experimental validation

Affiliations

Computationally driven discovery of SARS-CoV-2 Mpro inhibitors: from design to experimental validation

Léa El Khoury et al. Chem Sci. .

Abstract

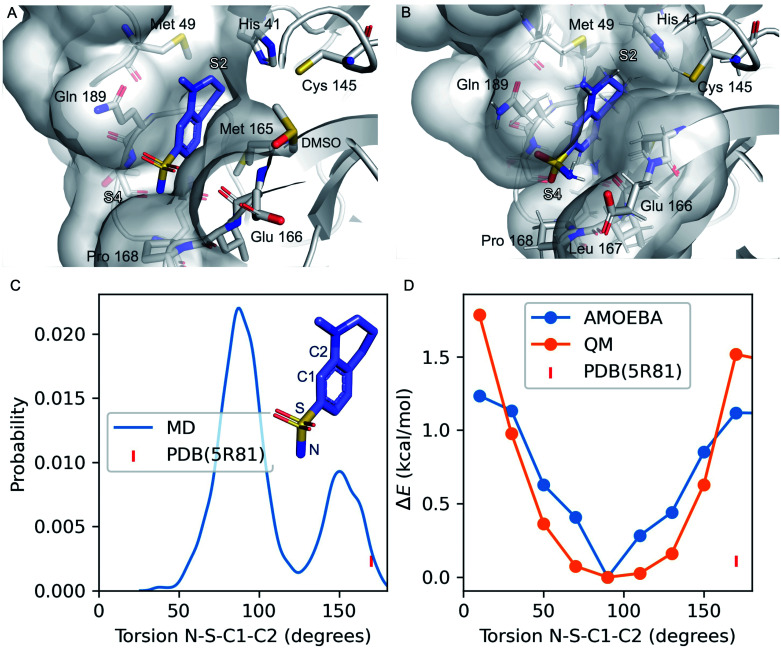
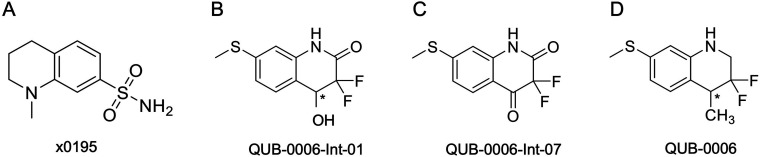
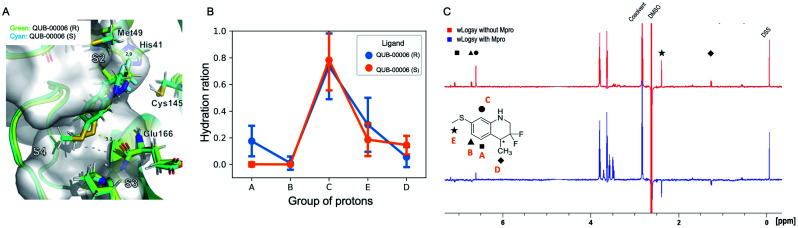
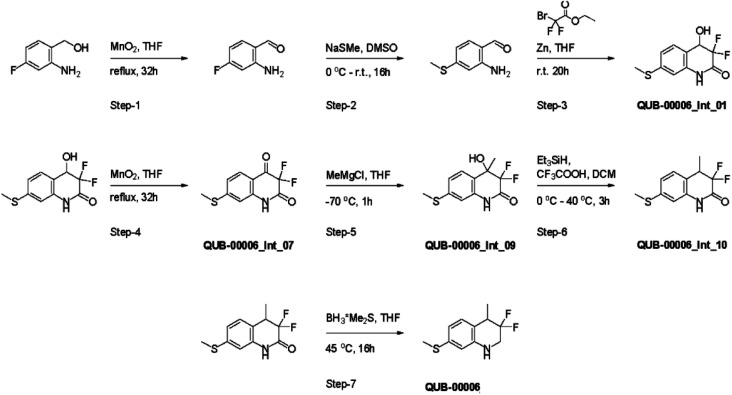
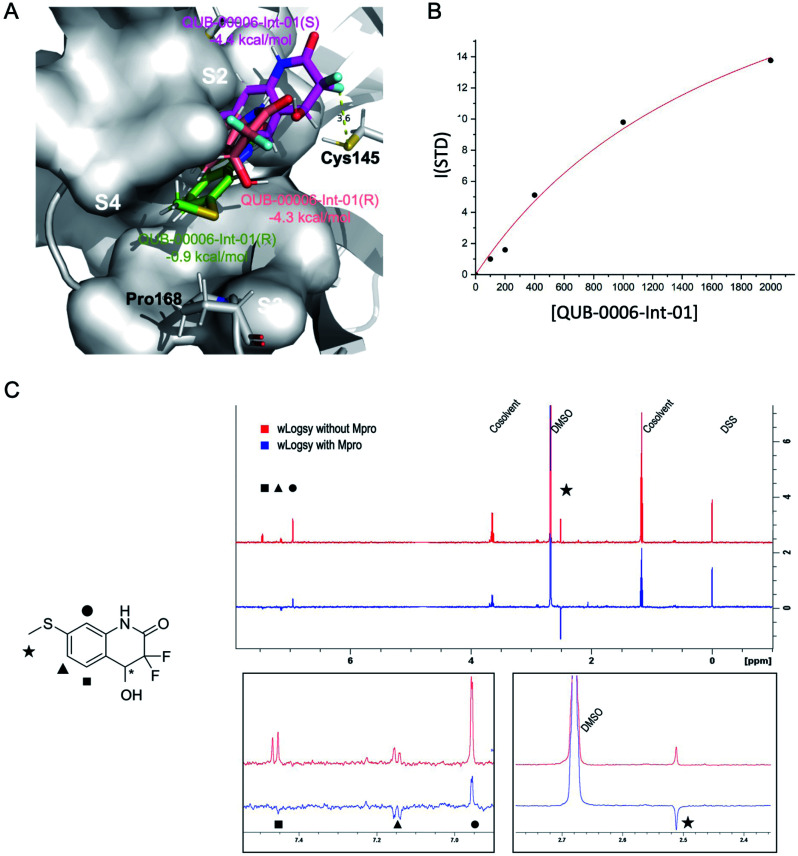
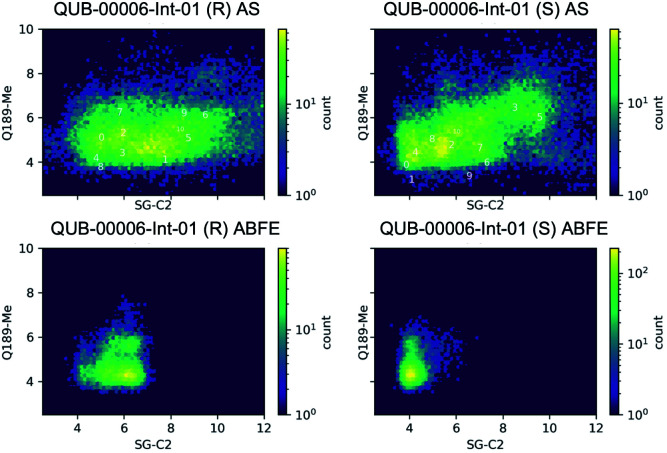
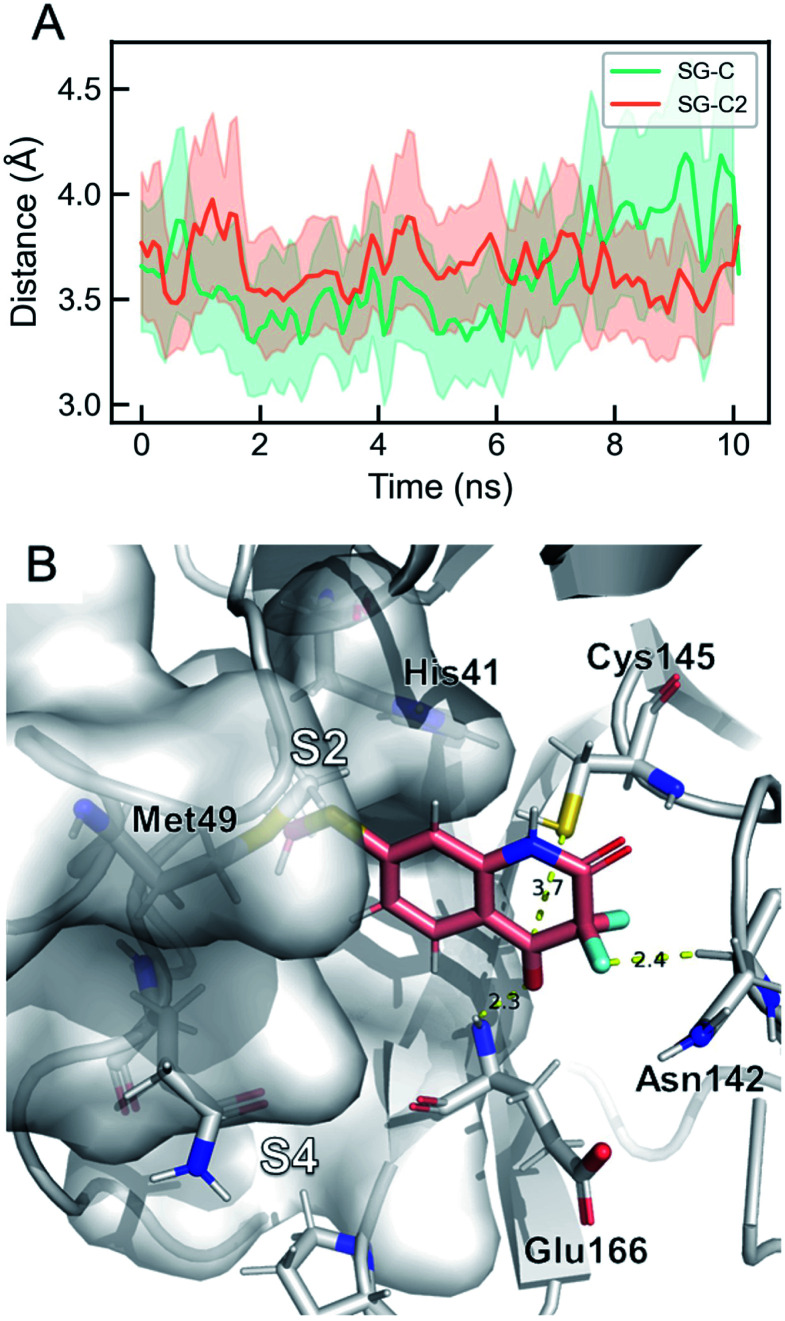
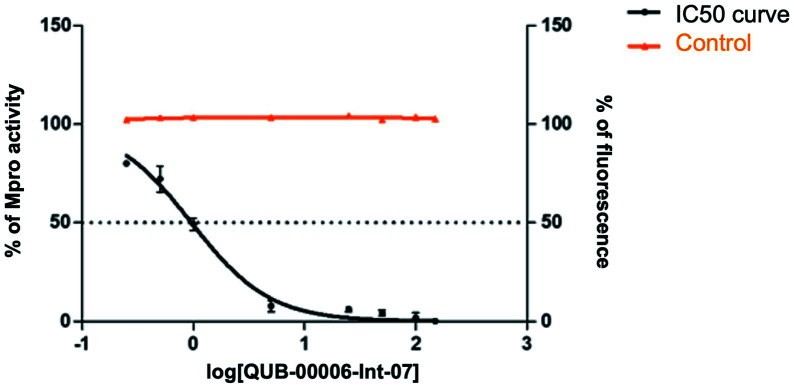
We report a fast-track computationally driven discovery of new SARS-CoV-2 main protease (Mpro) inhibitors whose potency ranges from mM for the initial non-covalent ligands to sub-μM for the final covalent compound (IC50 = 830 ± 50 nM). The project extensively relied on high-resolution all-atom molecular dynamics simulations and absolute binding free energy calculations performed using the polarizable AMOEBA force field. The study is complemented by extensive adaptive sampling simulations that are used to rationalize the different ligand binding poses through the explicit reconstruction of the ligand-protein conformation space. Machine learning predictions are also performed to predict selected compound properties. While simulations extensively use high performance computing to strongly reduce the time-to-solution, they were systematically coupled to nuclear magnetic resonance experiments to drive synthesis and for in vitro characterization of compounds. Such a study highlights the power of in silico strategies that rely on structure-based approaches for drug design and allows the protein conformational multiplicity problem to be addressed. The proposed fluorinated tetrahydroquinolines open routes for further optimization of Mpro inhibitors towards low nM affinities.


Conflict of interest statement

P. R., M. M., L. L., J. W. P. and J.-P. P. are co-founders and shareholders of Qubit Pharmaceuticals.

Figures

Fig. 1
Fig. 1. Refinement of the co-crystal structure of x0195 and Mpro using MD simulations. (A) An unusual conformation of x0195 (in purple) located in the binding pocket formed by His41, Met49, Glu166, Gln189, and Pro168 and their surroundings (PDB code: 5R81), and (B) the relaxed structure of x0195 (in purple), obtained after the equilibration step, interacting with the amino acid residues of the substrate binding site. Mpro is shown in light grey. (C) Torsion angle distribution for the sulfonamide group during 20 ns of MD simulations (in blue) performed on the Mpro dimer in complex with x0195; the torsion angle of the sulfonamide group in the co-crystal structure is shown in pink. (D) Torsion energy scan calculated by AMOEBA (in blue) and QM (in orange); the torsion angle of the sulfonamide group in the co-crystal structure is shown in pink. QM level = ωB97x-D/6-31g*.
Fig. 2
Fig. 2. 2D structures of (A) x0195, (B) QUB-00006-Int-01, (C) QUB-00006-Int-07, and (D) QUB-00006. The asterisk represents a chiral center.
Fig. 3
Fig. 3. Computational and experimental characterization of QUB-00006 binding within the Mpro binding pocket. (A) QUB-00006(R) (in light green) and QUB-00006(S) (in cyan) binding in a similar fashion at the interface of subpockets S2 and S4; the binding poses shown here were clustered and extracted from the trajectories of the binding free energy calculations performed on QUB-00006(R) and QUB-00006(S). (B) The analysis of our binding free energy trajectories showing that protons in groups A, B, E, and D have a low hydration ratio (less than 0.5), while the proton of group C has a high hydration ratio of 0.8. Hydration ratios calculated for the different proton groups of QUB-00006(R) correlate with those calculated for QUB-00006(S). (C) The WaterLOGSY spectra of QUB-00006 in the presence and absence of the Mpro. The assignment scheme is reported along with the 2D structure of the ligand. The strong negative intensity of the signals of the hydrogens of groups A, D, and E suggests that they are orientated towards the protein, while the hydrogen atom in C is solvent exposed. These experimental findings confirm the hydration ratio calculated during our binding free energy simulations and described in panel B.
Fig. 4
Fig. 4. Synthesis path of 3,3-difluoro-4-methyl-7-(methylsulfanyl)-1,2,3,4-tetrahydroquinoline named QUB-00006.
Fig. 5
Fig. 5. Computational and experimental characterization of QUB-00006-Int-01 in the Mpro binding pocket. (A) The dominant binding modes of QUB-00006-Int-01(R) (in pink) and QUB-00006-Int-01(S) (in magenta), identified during ABFE simulations. They have computed binding free energies of −4.4 and −4.3 kcal mol−1, respectively; also, they bind to the S2 and S4 subpockets in a similar fashion with the thioether group being fully buried in S2. On the other hand, starting with a QUB-00006 like binding mode, we ran an additional absolute binding free energy calculation on Mpro in complex with QUB-00006-Int-01(R) and obtained a second binding mode for QUB-00006-Int-01(R) (in green) with a binding free energy of −0.9 kcal mol−1. (B) STD titration profile of QUB-00006-Int-01. The ligand concentration ranges from 100 μM to 2 mM against 10 μM of Mpro. (C) The WaterLOGSY spectra of QUB-00006-Int-01 with Mpro (in blue) and without Mpro (in red). The assignment of the signals is reported on the 2D structure of the fragment. The methyl and the aromatic signals of the two protons adjacent to the hydroxyl group undergo a significant change, which suggests that these groups are in close contact with the protein's cavity. In contrast, the aromatic proton adjacent to the lactamic nitrogen undergoes a reduction of its intensity, suggesting that this proton is partially exposed to the solvent. These STD results confirm our computational characterization of the binding mode of QUB-00006-Int-01 (panel A).
Fig. 6
Fig. 6. Conformations of QUB-00006-Int-01 sampled during 20 ns of ABFE calculations and 450 ns of adaptive sampling simulations. The conformation was plotted as a function of two distances: (i) the distance between C2 (carbon of QUB-00006-Int-01 connected to the hydroxyl group) and the sulfur of Cys145, and (ii) the distance between the methyl thioether group in QUB-00006-Int-01 and the beta carbon of Gln189. “0” indicates the starting structure, “1” indicates the largest cluster, and “i” indicates the ith largest cluster. The frames were taken at 10 ps time intervals.
Fig. 7
Fig. 7. The dominant binding mode of QUB-00006-Int-07 during ABFE simulations. (A) Time evolution of key distances in the simulation. “SG” stands for the sulfur atom in Cys145, “C” is the amide carbon in QUB-00006-Int-07, and “C2” is the carbonyl carbon in QUB-00006-Int-07. The average distances for SG–C and SG–C2 are 3.61 Å and 3.65 Å, respectively. (B) The dominant binding mode of QUB-00006-Int-07 within the Mpro binding pocket. QUB-00006-Int-07 is shown in pink and the protein is shown in silver sticks and surfaces. The binding mode is very stable during the simulation, where the hydroxyl group is close to Cys145 and forms a hydrogen-bond with the Glu166 backbone, and the difluoro group interacts with the carbonyl group of Asn142. These binding modes are also comparable to the dominant binding mode of QUB-00006-Int-01(S) identified during ABFE calculations.
Fig. 8
Fig. 8. Dose–response curves obtained by plotting the percentage of SARS-CoV-2 Mpro residual activity as a function of increasing concentrations of QUB-00006-Int-07 (0–150 μM). [Mpro] = 20 nM, [PS1] = 5 μM, %DMSO = 3.75%. Experiments were performed in triplicate. A counter screening control experiment was performed by testing increasing concentrations of QUB-00006-Int-07 in the presence of 0.5 μM free fluorescein.
Fig. 9
Fig. 9. (A) Representative ESI-MS spectrum of a solution containing 10 μM SARS-CoV-2 Mpro in water/acetonitrile (50 : 50) added with 0.1% formic acid. The spectrum was acquired in positive ion mode. (B) Representative ESI-MS spectrum of a mixture containing 10 μM SARS-CoV-2 Mpro after incubation with QUB-00006-Int-07 (compound : protein ratio = 10 : 1) in water/acetonitrile (50 : 50) added with 0.1% formic acid. The spectrum was acquired in positive ion mode. The red dots correspond to the unmodified protein, and the green asterisks correspond to the modified protein.

References

    1. Zhou P. Yang X.-L. Wang X.-G. Hu B. Zhang L. Zhang W. Si H.-R. Zhu Y. Li B. Huang C.-L. et al. . nature. 2020;579:270–273. doi: 10.1038/s41586-020-2012-7. - DOI - PMC - PubMed
    1. Wu F. Zhao S. Yu B. Chen Y.-M. Wang W. Song Z.-G. Hu Y. Tao Z.-W. Tian J.-H. Pei Y.-Y. et al. . Nature. 2020;579:265–269. doi: 10.1038/s41586-020-2008-3. - DOI - PMC - PubMed
    1. Muratov E. N. Amaro R. Andrade C. H. Brown N. Ekins S. Fourches D. Isayev O. Kozakov D. Medina-Franco J. L. Merz K. M. Oprea T. I. Poroikov V. Schneider G. Todd M. H. Varnek A. Winkler D. A. Zakharov A. V. Cherkasov A. Tropsha A. Chem. Soc. Rev. 2021;50:9121–9151. doi: 10.1039/D0CS01065K. - DOI - PMC - PubMed
    1. von Delft F., Calmiano M., Chodera J., Griffen E., Lee A., London N., Matviuk T., Perry B., Robinson M. and von Delft A., A white-knuckle ride of open COVID drug discovery, 2021 - PubMed
    1. Breidenbach J. Lemke C. Pillaiyar T. Schäkel L. Al Hamwi G. Diett M. Gedschold R. Geiger N. Lopez V. Mirza S. Namasivayam V. Schiedel A. C. Sylvester K. Thimm D. Vielmuth C. Phuong Vu L. Zyulina M. Bodem J. Gütschow M. Müller C. E. Angew. Chem., Int. Ed. 2021;60:10423–10429. doi: 10.1002/anie.202016961. - DOI - PMC - PubMed