A Remote Sensing Approach for Displaying the Changes in the Vegetation Cover at Az Zakhnuniyah Island at Arabian Gulf, Saudi Arabia
- PMID: 35433071
- PMCID: PMC9010221
- DOI: 10.1155/2022/2907921
A Remote Sensing Approach for Displaying the Changes in the Vegetation Cover at Az Zakhnuniyah Island at Arabian Gulf, Saudi Arabia
Abstract
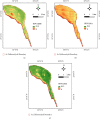
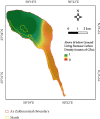
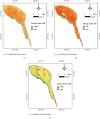
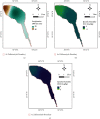
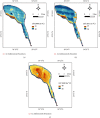
In the terrestrial ecosystem, vegetation is the important component of exchanging of water and energy in biogeochemical and climate cycle. A study was conducted to detect the vegetation cover change at Az Zakhnuniyah island by using remote sensing techniques. It includes vegetation analysis using normalized difference vegetation index (NDVI) while comparing with climatological data including temperature, humidity, and precipitation. A clear trend was seen in climatological parameters where temperature and humidity were rising decade by decade although NDVI did not show. In addition, increasing soil salinization over the years was observed when soil salinity index was used. NDVI-based long-term decadal analysis on vegetation cover based on Landsat surface reflectance data showed increase of vegetation cover which was also linked to precipitation trends. Also, the short-term demi-decadal comparison using PROBA-V showed the vegetation cover reduction between 2015 and 2019. Nevertheless, the sea level surrounding the island also showed an increasing trend of 0.34 cm/y, which could be the cause of inundation in some parts of the island in future. Furthermore, all these trends need to be observed in entirety as many of those trends can be interlinked.
Copyright © 2022 Wafa'a A. Al-Taisan.
Conflict of interest statement
The author declares that there are no conflicts of interest.
Figures






Similar articles
-
Floristic diversity and vegetation of the az Zakhnuniyah Island, Arabian Gulf, Saudi Arabia.Heliyon. 2022 Jul 19;8(7):e09996. doi: 10.1016/j.heliyon.2022.e09996. eCollection 2022 Jul. Heliyon. 2022. PMID: 35879996 Free PMC article.
-
A remote sensing study of spatiotemporal variations in drought conditions in northern Asir, Saudi Arabia.Environ Monit Assess. 2020 Nov 25;192(12):784. doi: 10.1007/s10661-020-08771-8. Environ Monit Assess. 2020. PMID: 33241472
-
Effects of Climate Change on Land Cover Change and Vegetation Dynamics in Xinjiang, China.Int J Environ Res Public Health. 2020 Jul 6;17(13):4865. doi: 10.3390/ijerph17134865. Int J Environ Res Public Health. 2020. PMID: 32640654 Free PMC article.
-
Impact of climate on vegetation in Pindari watershed of Western Himalayas, Kumaun, India, using spatiotemporal analysis: 1972-2018.Environ Sci Pollut Res Int. 2022 Dec;29(57):86362-86373. doi: 10.1007/s11356-022-19711-z. Epub 2022 Mar 22. Environ Sci Pollut Res Int. 2022. PMID: 35314942
-
An assessment of mangrove vegetation changes in reference to cyclone impacted climatic alterations at land-ocean interface of Indian Sundarbans with application of remote sensing-based analytical tools.Environ Sci Pollut Res Int. 2023 Aug;30(38):89311-89335. doi: 10.1007/s11356-023-28486-w. Epub 2023 Jul 14. Environ Sci Pollut Res Int. 2023. PMID: 37452248
Cited by
-
Responses of two strawberry cultivars to NaCl-induced salt stress under the influence of ZnO nanoparticles.Saudi J Biol Sci. 2023 Apr;30(4):103623. doi: 10.1016/j.sjbs.2023.103623. Epub 2023 Mar 10. Saudi J Biol Sci. 2023. PMID: 36970252 Free PMC article.
References
-
- Morrison L. W. Why do some small islands lack vegetation? Evidence from long-term introduction experiments. Ecography . 2011;34(3):384–391. doi: 10.1111/j.1600-0587.2010.06646.x. - DOI
-
- Xin Z., Xu J., Zheng W. Spatiotemporal variations of vegetation cover on the Chinese Loess Plateau (1981–2006): impacts of climate changes and human activities. Science in China-Series D: Earth Sciences . 2008;51(1):67–78. doi: 10.1007/s11430-007-0137-2. - DOI
-
- Brown M. E., Pinzon J. E., Didan K., Morisette J. T., Tucker C. J. Evaluation of the consistency of long-term NDVI time series derived from AVHRR, SPOT-vegetation, SeaWiFS, MODIS, and Landsat ETM+ sensors. IEEE Transactions on Geoscience and Remote Sensing . 2006;44(7):1787–1793. doi: 10.1109/tgrs.2005.860205. - DOI
-
- Myneni R. B., Hall F. G., Sellers P. J., Marshak A. L. The interpretation of spectral vegetation indexes. IEEE Transactions on Geoscience and Remote Sensing . 1995;33(2):481–486. doi: 10.1109/TGRS.1995.8746029. - DOI
LinkOut - more resources
Full Text Sources

