. 2022 Mar 31:12:868351.
doi: 10.3389/fonc.2022.868351. eCollection 2022.

Iron Administration Overcomes Resistance to Erastin-Mediated Ferroptosis in Ovarian Cancer Cells

Affiliations

Iron Administration Overcomes Resistance to Erastin-Mediated Ferroptosis in Ovarian Cancer Cells

Anna Martina Battaglia et al. Front Oncol. .

Abstract

Objectives: Developing novel therapeutic approaches to defeat chemoresistance is the major goal of ovarian cancer research. Induction of ferroptosis has shown promising antitumor effects in ovarian cancer cells, but the existence of still undefined genetic and metabolic determinants of susceptibility has so far limited the application of ferroptosis inducers in vivo.

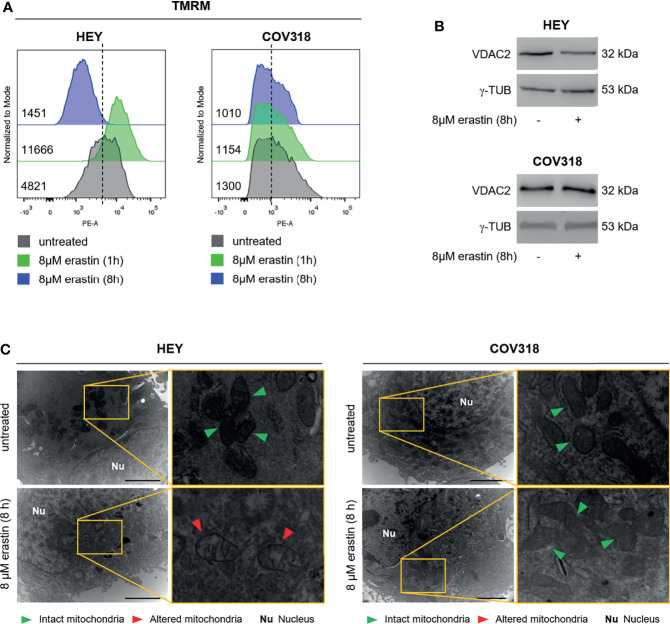
Methods: Erastin and/or the iron compound ferlixit were used to trigger ferroptosis in HEY, COV318, PEO4, and A2780CP ovarian cancer cell lines. Cell viability and cell death were measured by MTT and PI flow cytometry assay, respectively. The "ballooning" phenotype was tested as ferroptosis specific morphological feature. Mitochondrial dysfunction was evaluated based on ultrastructural changes, mitochondrial ROS, and mitochondrial membrane polarization. Lipid peroxidation was tested through both C11-BODIPY and malondialdehyde assays. VDAC2 and GPX4 protein levels were quantified as additional putative indicators of mitochondrial dysfunction or lipid peroxidation, respectively. The effect of erastin/ferlixit treatments on iron metabolism was analyzed by measuring intracellular labile iron pool and ROS. FtH and NCOA4 were measured as biomarkers of ferritinophagy.

Results: Here, we provide evidence that erastin is unable to induce ferroptosis in a series of ovarian cancer cell lines. In HEY cells, provided with a high intracellular labile iron pool, erastin treatment is accompanied by NCOA4-mediated ferritinophagy and mitochondrial dysfunction, thus triggering ferroptosis. In agreement, iron chelation counteracts erastin-induced ferroptosis in these cells. COV318 cells, with low baseline intracellular labile iron pool, appear resistant to erastin treatment. Notably, the use of ferlixit sensitizes COV318 cells to erastin through a NCOA4-independent intracellular iron accumulation and mitochondrial dysfunction. Ferlixit alone mimics erastin effects and promotes ferroptosis in HEY cells.

Conclusion: This study proposes both the baseline and the induced intracellular free iron level as a significant determinant of ferroptosis sensitivity and discusses the potential use of ferlixit in combination with erastin to overcome ferroptosis chemoresistance in ovarian cancer.

Keywords: chemoresistance; erastin; ferroptosis; iron; mitochondrial dysfunction; ovarian cancer.


Conflict of interest statement

The authors declare that the research was conducted in the absence of any commercial or financial relationships that could be construed as a potential conflict of interest.

Figures

Figure 1
Figure 1
Erastin induces ferroptosis only in a subset of OVCA cells. HEY, COV318, PEO4, and A2780CP OVCA cells were treated with different concentrations (8 and 25 µM) of erastin for 8 h. Cell viability and mortality were measured using the MTT assay (A) and the PI flow cytometric analysis (B), respectively. Results are shown as means ± SD of three independent experiments. *p-value <0.05, untreated vs 8 µM erastin (8 h); **p-value <0.05, untreated vs 25 µM erastin (8 h); ns: not significant. (C) Optical microscopy images showing the presence or absence of the ballooning phenotype upon treatment with erastin (8 and 25 µM for 8 h).
Figure 2
Figure 2
Erastin promotes ferroptosis in HEY cells, but not in COV318 cells. (A) LIP level assessed by flow cytometry using CA-AM in HEY and COV318 cells upon treatment with 8 µM erastin for 8 h. (B) Western Blot analysis of NCOA4 and FtH in HEY and COV318 cells untreated or treated with 8 µM erastin for 8 h. γ-TUB was used as internal control. (C) Flow cytometry analysis of cytosolic and mitochondrial ROS production after erastin administration (8 µM erastin for 8 h). Cytosolic ROS were measured upon staining with CM-H2DCFDA while mitochondrial ROS were quantified by using MitoSOX Red. Results are representative of three independent experiments.
Figure 3
Figure 3
Erastin treatment triggers mitochondrial dysfunction in HEY cells. (A) Mitochondrial membrane potential measured by TMRM flow cytometry assay in HEY and COV318 cells untreated or treated with 8 µM erastin for 1 and 8 h. (B) Western Blot of VDAC2 in HEY and COV318 cells upon administration of 8 µM erastin for 8 h. γ-TUB was used as a normalization control for protein quantification. (C) Mitochondrial ultrastructural images detected by TEM of HEY and COV318 cells treated with or without 8 μM erastin for 8 h. Green arrows, intact mitochondria; red arrows, altered mitochondria; Nu, nucleus. Results are representative of three independent experiments.
Figure 4
Figure 4
DFO administration protects HEY cells from ferroptosis. (A) LIP level and cell mortality determined using CA-AM and PI cytofluorimetric assays in HEY cells untreated, treated with 8 µM erastin (8 h) and 200 µM DFO (24 h) alone or in combination. (B) Optical microscopy images showing the presence or absence of the ballooning phenotype in HEY cells upon treatment with erastin and DFO alone or in combination. (C) Analysis of mitochondrial membrane potential, cytosolic and mitochondrial ROS production by TMRM, CM-H2DCFDA, and MitoSOX Red fluorescence, respectively, in HEY cells untreated, treated with erastin and DFO alone or in combination. (D) Western Blot of VDAC2, NCOA4, and FtH in HEY cells upon administration of erastin and DFO alone or in combination. γ-TUB was used as a normalization control for protein quantification. (E) Mitochondrial ultrastructural images detected by TEM in HEY cells upon treatment with erastin and DFO alone or in combination. Green arrows, intact mitochondria; red arrows, altered mitochondria; Nu, nucleus. All data are representative of three independent experiments.
Figure 5
Figure 5
Ferlixit/erastin co-treatment leads to ferroptosis in COV318 cells. COV318 cells were treated with different concentrations (100 and 250 µM for 24 and 48 h) of ferlixit alone or in combination with 8 µM erastin for 8 h. Cell viability and mortality were measured using the MTT assay (A) and the PI flow cytometry assay (B), respectively. Results are shown as means ± SD of three independent experiments. *p-value <0.05, untreated vs treatment; ns, not significant. (C) Optical microscopy images showing the presence or absence of the ballooning phenotype in COV318 cells upon treatment with ferlixit and erastin alone or in combination. (D) Analysis of mitochondrial membrane potential, cytosolic and mitochondrial ROS production by TMRM, CM-H2DCFDA and MitoSOX Red flow cytometry assays in COV318 cells untreated, treated with ferlixit and erastin alone or in combination. (E) Western Blot of VDAC2, NCOA4, and FtH in COV318 cells upon administration of ferlixit and erastin alone or in combination. γ-TUB was used as a normalization control for protein quantification. (F) Mitochondrial ultrastructural images detected by TEM in COV318 cells upon treatment with ferlixit and ferlixit alone or in combination. Green arrows, intact mitochondria; red arrows, altered mitochondria; Nu, nucleus. All data are representative of three independent experiments.
Figure 6
Figure 6
Ferlixit admnistration alone induces ferroptosis in HEY cells. HEY cells were treated with different concentrations (100 and 250 µM) of ferlixit for 24 and 48 h. Cell viability and mortality were measured using the MTT assay (A) and PI flow cytometry assay (B), respectively. Results are shown as means ± SD of three independent experiments. *p-value <0.05, untreated vs treatment. (C) Optical microscopy images showing the presence or absence of the ballooning phenotype in HEY cells upon treatment with different concentration of ferlixit. (D) Analysis of mitochondrial membrane potential, cytosolic and mitochondrial ROS production by TMRM, CM-H2DCFDA and MitoSOX Red flow cytometry assays in HEY cells untreated or treated with 100 µM ferlixit for 24 h. (E) Western Blot of VDAC2, NCOA4 and FtH in HEY cells upon administration of 100 µM ferlixit for 24 h. γ-TUB was used as a normalization control for protein quantification. (F) Mitochondrial ultrastructural images detected by TEM in HEY cells treated with 100 µM ferlixit for 24 h. Green arrows, intact mitochondria; red arrows, altered mitochondria; Nu, nucleus. All data are representative of three independent experiments.

References

    1. Gadducci A, Guarneri V, Peccatori FA, Ronzino G, Scandurra G, Zamagni C, et al. . Current Strategies for the Targeted Treatment of High-Grade Serous Epithelial Ovarian Cancer and Relevance of BRCA Mutational Status. J Ovarian Res (2019) 12(1):9. doi: 10.1186/S13048-019-0484-6 - DOI - PMC - PubMed
    1. Rose M, Burgess JT, O’Byrne K, Richard DJ, Bolderson E. PARP Inhibitors: Clinical Relevance, Mechanisms of Action and Tumor Resistance. Front Cell Dev Biol (2020) 8:564601. doi: 10.3389/FCELL.2020.564601 - DOI - PMC - PubMed
    1. Biamonte F, Santamaria G, Sacco A, Perrone FM, Di Cello A, Battaglia AM, et al. . MicroRNA Let-7g Acts as Tumor Suppressor and Predictive Biomarker for Chemoresistance in Human Epithelial Ovarian Cancer. Sci Rep 2019 91 (2019) 9:1–12. doi: 10.1038/s41598-019-42221-x - DOI - PMC - PubMed
    1. Battaglia AM, Chirillo R, Aversa I, Sacco A, Costanzo F, Biamonte F. Ferroptosis and Cancer: Mitochondria Meet the “Iron Maiden” Cell Death. Cells (2020) 9(6):1505. doi: 10.3390/CELLS9061505 - DOI - PMC - PubMed
    1. Lin CC, Chi JT. Ferroptosis of Epithelial Ovarian Cancer: Genetic Determinants and Therapeutic Potential. Oncotarget (2020) 11:3562. doi: 10.18632/ONCOTARGET.27749 - DOI - PMC - PubMed