

Harmonic Distortion of Blood Pressure Waveform as a Measure of Arterial Stiffness
- PMID: 35433650
- PMCID: PMC9006055
- DOI: 10.3389/fbioe.2022.842754
Harmonic Distortion of Blood Pressure Waveform as a Measure of Arterial Stiffness
Abstract
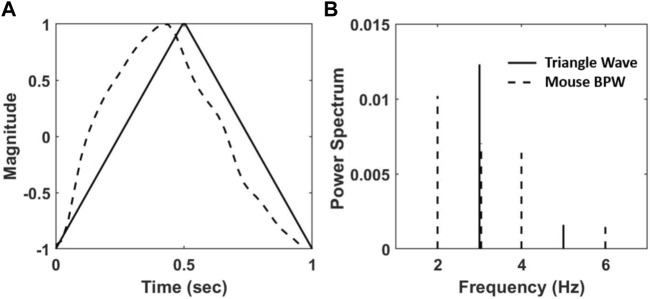
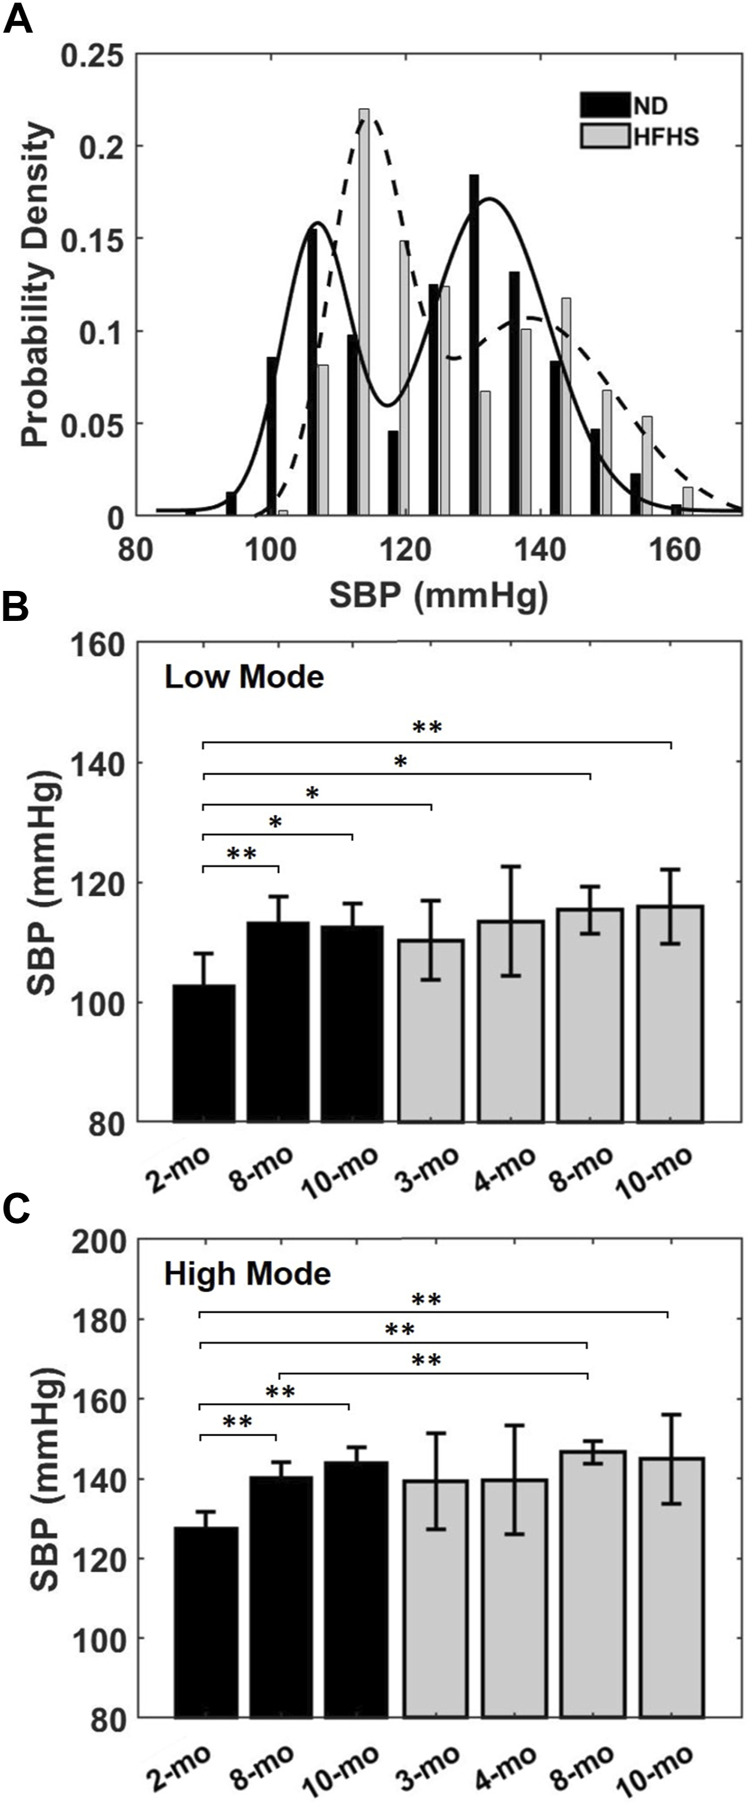
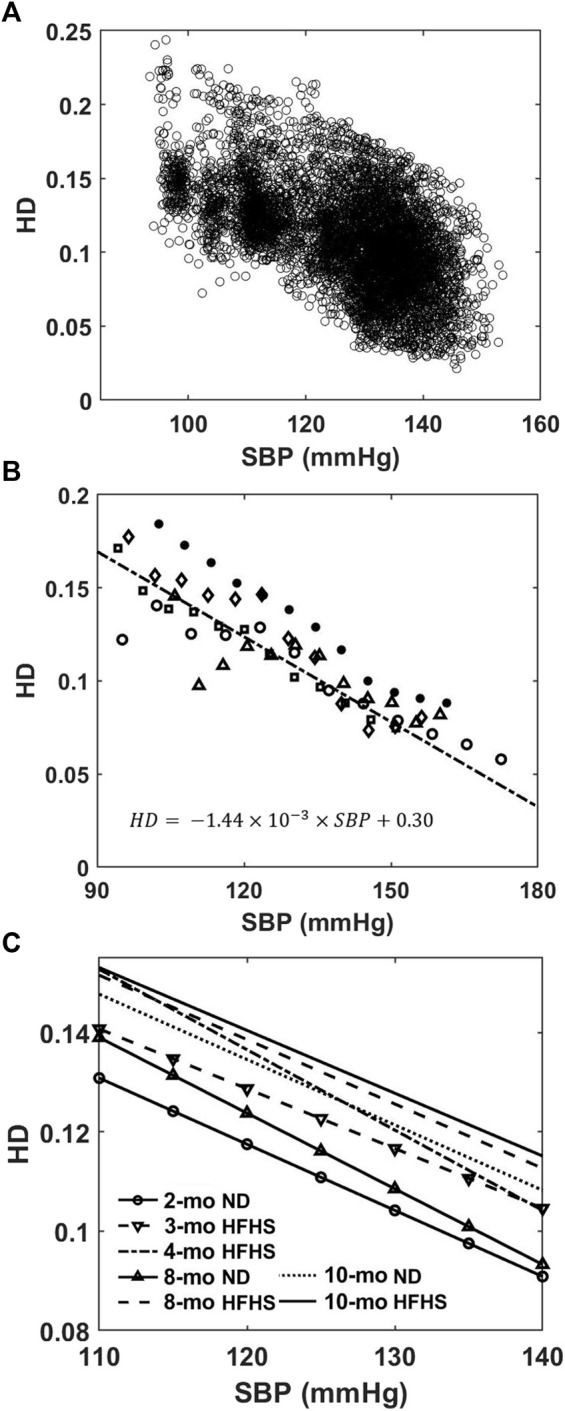
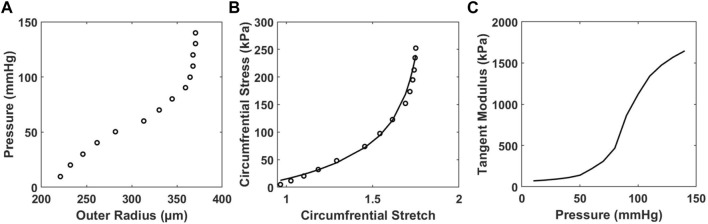
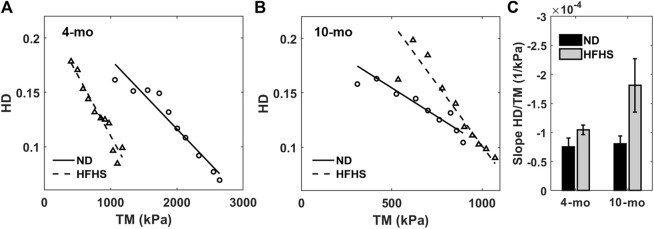
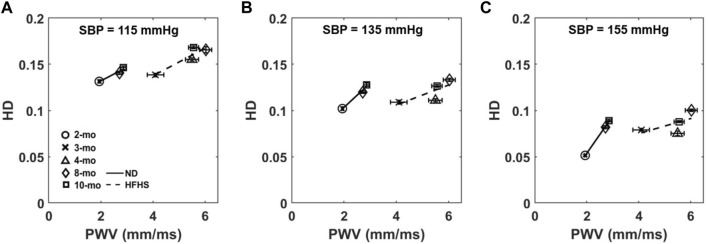
Aging and disease alter the composition and elastic properties of the aortic wall resulting in shape changes in blood pressure waveform (BPW). Here, we propose a new index, harmonic distortion (HD), to characterize BPW and its relationship with other in vitro and in vivo measures. Using a Fourier transform of the BPW, HD is calculated as the ratio of energy above the fundamental frequency to that at the fundamental frequency. Male mice fed either a normal diet (ND) or a high fat, high sucrose (HFHS) diet for 2-10 months were used to study BPWs in diet-induced metabolic syndrome. BPWs were recorded for 20 s hourly for 24 h, using radiotelemetry. Pulse wave velocity (PWV), an in vivo measure of arterial stiffness, was measured in the abdominal aorta via ultrasound sonography. Common carotid arteries were excised from a subset of mice to determine the tangent modulus using biaxial tension-inflation test. Over a 24-h period, both HD and systolic blood pressure (SBP) show a large variability, however HD linearly decreases with increasing SBP. HD is also linearly related to tangent modulus and PWV with slopes significantly different between the two diet groups. Overall, our study suggests that HD is sensitive to changes in blood pressure and arterial stiffness and has a potential to be used as a noninvasive measure of arterial stiffness in aging and disease.
Keywords: blood pressure waveform; harmonic distortion; pulse wave velocity; radio telemetry; tangent modulus.
Copyright © 2022 Milkovich, Gkousioudi, Seta, Suki and Zhang.
Conflict of interest statement
The authors declare that the research was conducted in the absence of any commercial or financial relationships that could be construed as a potential conflict of interest.
Figures

Similar articles
-
Assessment of the arterial stiffness in patients with acute ischemic stroke using longitudinal elasticity modulus measurements obtained with Shear Wave Elastography.Med Ultrason. 2016 Jun;18(2):182-9. doi: 10.11152/mu.2013.2066.182.wav. Med Ultrason. 2016. PMID: 27239652
-
Effects of acute variation of dialysate calcium concentrations on arterial stiffness and aortic pressure waveform.Nephrol Dial Transplant. 2009 Dec;24(12):3788-94. doi: 10.1093/ndt/gfp351. Epub 2009 Aug 4. Nephrol Dial Transplant. 2009. PMID: 19654232 Free PMC article. Clinical Trial.
-
Echo-Doppler assessment of arterial stiffness in pediatric patients with Kawasaki disease.J Am Soc Echocardiogr. 2013 Sep;26(9):1084-9. doi: 10.1016/j.echo.2013.05.015. Epub 2013 Jun 22. J Am Soc Echocardiogr. 2013. PMID: 23800509
-
Clinical measurement of arterial stiffness obtained from noninvasive pressure waveforms.Am J Hypertens. 2005 Jan;18(1 Pt 2):3S-10S. doi: 10.1016/j.amjhyper.2004.10.009. Am J Hypertens. 2005. PMID: 15683725 Review.
-
Aortic-Brachial Pulse Wave Velocity Ratio: A Measure of Arterial Stiffness Gradient Not Affected by Mean Arterial Pressure.Pulse (Basel). 2018 Mar;5(1-4):117-124. doi: 10.1159/000480092. Epub 2017 Oct 19. Pulse (Basel). 2018. PMID: 29761086 Free PMC article. Review.
Cited by
-
Estimation of Central Systolic Blood Pressure from Peripheral Pressure Waves using a Novel Second Systolic Pressure-Based Method in Normal and Heritable Hypercholesterolemic Rabbits.J Atheroscler Thromb. 2023 Sep 1;30(9):1132-1141. doi: 10.5551/jat.63793. Epub 2023 Jan 14. J Atheroscler Thromb. 2023. PMID: 36642536 Free PMC article.
-
Effect of Nonlinear Hyperelastic Property of Arterial Tissues on the Pulse Wave Velocity Based on the Unified-Fiber-Distribution (UFD) Model.Ann Biomed Eng. 2023 Nov;51(11):2441-2452. doi: 10.1007/s10439-023-03275-1. Epub 2023 Jun 16. Ann Biomed Eng. 2023. PMID: 37326947
-
Blood pressure waveform morphology assessed using a transmission line model and harmonic distortion analysis.Sci Rep. 2025 Mar 17;15(1):9076. doi: 10.1038/s41598-025-93129-8. Sci Rep. 2025. PMID: 40097550 Free PMC article.
-
Comprehensive characterization of nonlinear viscoelastic properties of arterial tissues using guided-wave optical coherence elastography.ArXiv [Preprint]. 2025 Jul 27:arXiv:2507.20107v1. ArXiv. 2025. PMID: 40740519 Free PMC article. Preprint.
-
Increasing the sensor channels: a solution for the pressing offsets that cause the physiological parameter inaccuracy in radial artery pulse signal acquisition.Front Bioeng Biotechnol. 2024 Feb 15;12:1359297. doi: 10.3389/fbioe.2024.1359297. eCollection 2024. Front Bioeng Biotechnol. 2024. PMID: 38425993 Free PMC article.
References
-
- Baek S., Gleason R. L., Rajagopal K. R., Humphrey J. D. (2007). Theory of Small on Large: Potential Utility in Computations of Fluid-Solid Interactions in Arteries. Computer Methods Appl. Mech. Eng. 196, 3070–3078. 10.1016/j.cma.2006.06.018 - DOI
Grants and funding
LinkOut - more resources
Full Text Sources