. 2022 Apr 1:10:842342.
doi: 10.3389/fcell.2022.842342. eCollection 2022.

SuRVoS 2: Accelerating Annotation and Segmentation for Large Volumetric Bioimage Workflows Across Modalities and Scales

Affiliations

SuRVoS 2: Accelerating Annotation and Segmentation for Large Volumetric Bioimage Workflows Across Modalities and Scales

Avery Pennington et al. Front Cell Dev Biol. .

Abstract

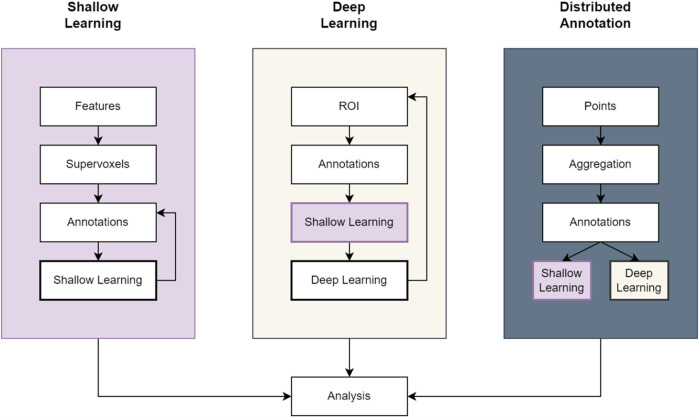
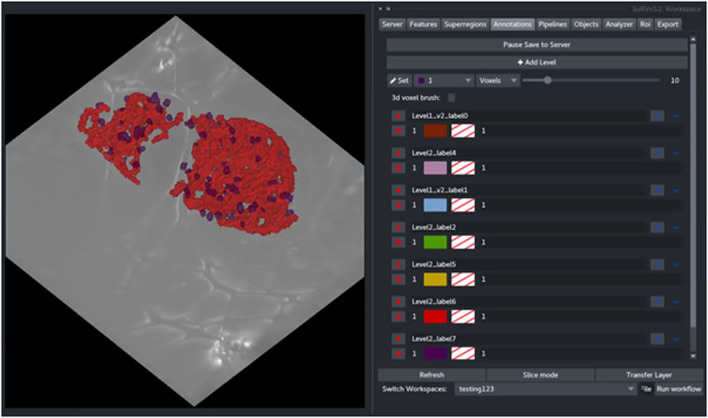
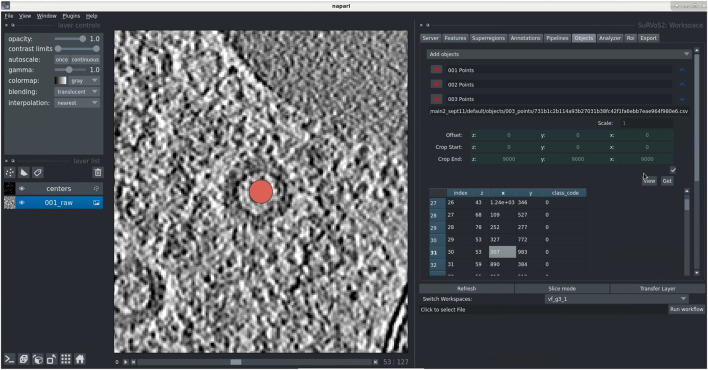
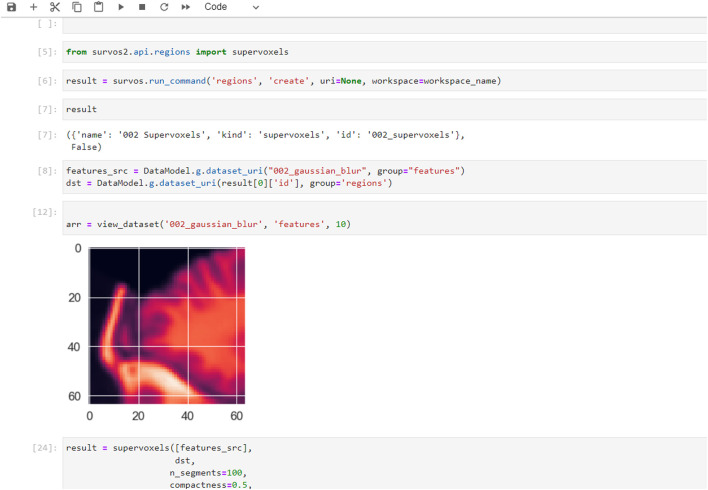
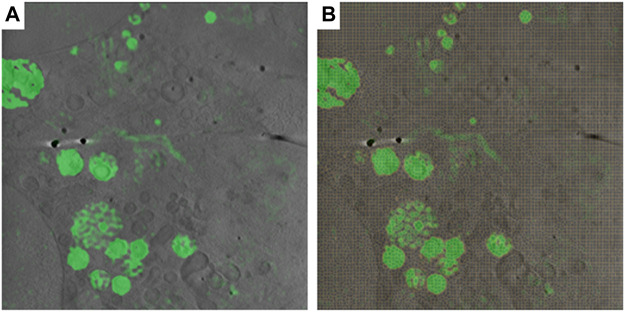
As sample preparation and imaging techniques have expanded and improved to include a variety of options for larger sized and numbers of samples, the bottleneck in volumetric imaging is now data analysis. Annotation and segmentation are both common, yet difficult, data analysis tasks which are required to bring meaning to the volumetric data. The SuRVoS application has been updated and redesigned to provide access to both manual and machine learning-based segmentation and annotation techniques, including support for crowd sourced data. Combining adjacent, similar voxels (supervoxels) provides a mechanism for speeding up segmentation both in the painting of annotation and by training a segmentation model on a small amount of annotation. The support for layers allows multiple datasets to be viewed and annotated together which, for example, enables the use of correlative data (e.g. crowd-sourced annotations or secondary imaging techniques) to guide segmentation. The ability to work with larger data on high-performance servers with GPUs has been added through a client-server architecture and the Pytorch-based image processing and segmentation server is flexible and extensible, and allows the implementation of deep learning-based segmentation modules. The client side has been built around Napari allowing integration of SuRVoS into an ecosystem for open-source image analysis while the server side has been built with cloud computing and extensibility through plugins in mind. Together these improvements to SuRVoS provide a platform for accelerating the annotation and segmentation of volumetric and correlative imaging data across modalities and scales.

Keywords: U-net; X-ray microscopy imaging; annotation; computer vision; open source software; python (programming language); segmentation (image processing); volume electron microscopy (vEM).


Conflict of interest statement

Authors AP, OK, WT, IL, and MB were employed by the company Diamond Light Source Ltd. EH was employed by the Rosalind Franklin Institute. The remaining authors declare that the research was conducted in the absence of any commercial or financial relationships that could be construed as a potential conflict of interest.

Figures

FIGURE 1
FIGURE 1
Example workflow pipelines in SuRVoS2. The Shallow Learning pipeline is the same as previously available in SuRVoS using an iterative painting and predicting cycle to produce an output segmentation. The Deep Learning pipeline incorporates the Shallow Learning pipeline to quickly generate expert segmentations on a region of interest (ROI) which can subsequently be used to train a deep learning model for application to the full volume. And finally, the Distributed Annotation pipeline uses geometric data alongside either the Shallow Learning or Deep Learning pipelines to segment objects marked by 3D points.
FIGURE 2
FIGURE 2
Blood vessels from an X-ray micro-tomography dataset of human placenta segmented using the SuRVoS2 deep learning pipeline. Images (AF) show a central slice of a 256 × 256 × 256 pixel region of interest (ROI), marked in (G) with a black box. (A) Raw data. (B) Data with a total variation denoising filter applied. (C) Supervoxels generated from the denoised data. (D) Annotations applied to the supervoxels (red: background, blue: blood vessels). (E) Supervoxel-based prediction of segmentation labels using a random forest classifier trained on the annotations shown in (D). (F) Voxel-based prediction of segmentation labels using a 2D U-Net model trained on the segmentation output from (E) and the raw data (A). (G) Voxel-based predictions of segmentation labels for a central 100 slices of the full 2520 × 2520 dataset using the 2D U-Net model trained as described in (F).
FIGURE 3
FIGURE 3
SuRVoS2 plugin integrated into the Napari viewer. The output blood vessel segmentations from the deep learning pipeline in SuRVoS2 visualized using the 3D rendering option and overlaid on the raw data in the Napari viewer.
FIGURE 4
FIGURE 4
The Label Splitter tool for application of classification rules using inherent characteristics of the segmented objects. Information about each object is displayed on a table and graph. The graph is split by a line at the location of the chosen rule value and double clicking on an entry in the table takes the user to the chosen object in the data.
FIGURE 5
FIGURE 5
The output of the Label Splitter can be visualized as annotation layers within the SuRVoS2 plugin. Rules are applied sequentially to all selected objects and after splitting, each new class can be visualized and given a unique label and color.
FIGURE 6
FIGURE 6
Use of geometric data in SuRVoS2 to analyze crowdsourced annotations. (A) Data were imported into the Napari viewer using a simple CSV file format indicating 3D centroid locations and object class. The tools in SuRVoS2 can be used to visualize, edit, and delete geometric data, including a function to take the user directly to an object of interest by double clicking on its entry in the table view.
FIGURE 7
FIGURE 7
Examples of additional features and use-cases available when using the SuRVoS2 API from within Jupyter notebooks. Example of the SuRVoS2 API being used through a notebook with results which can be visualized using the SuRVoS2 GUI.
FIGURE 8
FIGURE 8
3D CryoSXT with correlated 3D cryoSIM in SuRVoS2. (A) Multimodal imaging can be displayed together as individual layers with control over opacity and color. (B) SuRVoS2 specific functionality, such as supervoxels (shown in yellow) can be calculated using one of the datasets for use during segmentation or annotation of the other.

References

    1. Abràmoff M. D., Magalhães P. J., Ram S. J. (2004). Image Processing with ImageJ. Biophotonics Int. 11 (7), 36–42.
    1. Alvarez-Borges F. J., King O. N. F., Madhusudhan B. N., Connolley T., Basham M., Ahmed S. I. (2021). U-Net Segmentation Methods for Variable-Contrast XCT Images of Methane-Bearing Sand. Earth and Space Science Open Archive. 10.1002/essoar.10506807.1 - DOI
    1. Basham (2021). GitHub - DiamondLightSource/SuRVoS2: Next Generation of SuRVoS. [online] Available at: https://github.com/DiamondLightSource/SuRVoS2 (Accessed December 13, 2021).
    1. Belevich I., Jokitalo E. (2021). DeepMIB: User-Friendly and Open-Source Software for Training of Deep Learning Network for Biological Image Segmentation. Plos Comput. Biol. 17 (3), e1008374. 10.1371/journal.pcbi.1008374 - DOI - PMC - PubMed
    1. Bepler T., Kelley K., Noble A. J., Berger B. (2020). Topaz-Denoise: General Deep Denoising Models for cryoEM and cryoET. Nat. Commun. 11 (1), 5208. 10.1038/s41467-020-18952-1 - DOI - PMC - PubMed