. 2022 Mar 30:9:858603.
doi: 10.3389/fnut.2022.858603. eCollection 2022.

Identification and Spatial Visualization of Dysregulated Bile Acid Metabolism in High-Fat Diet-Fed Mice by Mass Spectral Imaging

Affiliations

Identification and Spatial Visualization of Dysregulated Bile Acid Metabolism in High-Fat Diet-Fed Mice by Mass Spectral Imaging

Qi Zhang et al. Front Nutr. .

Abstract

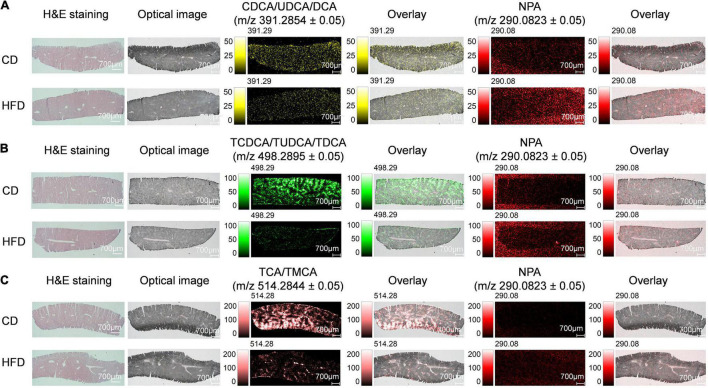
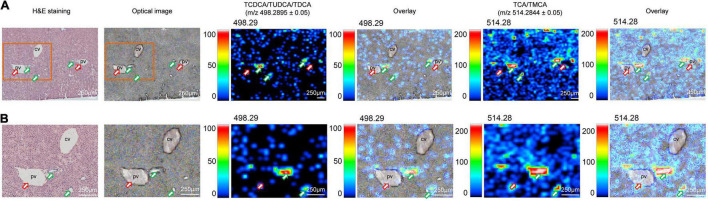
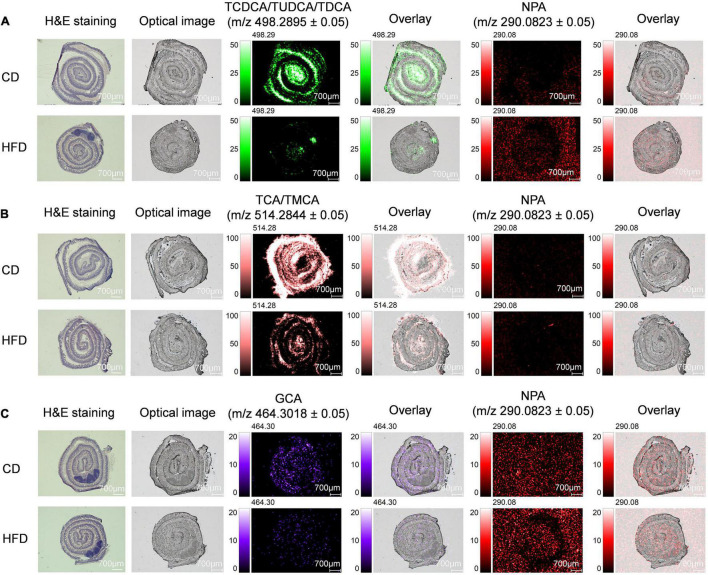
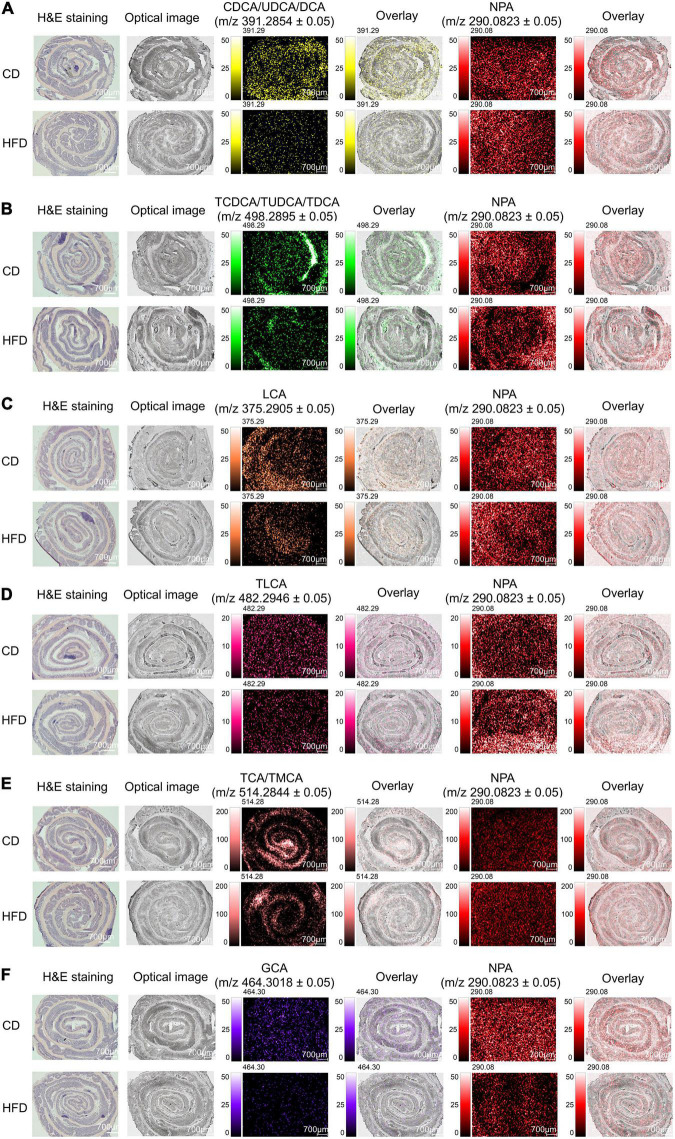
Changes in overall bile acid (BA) levels and specific BA metabolites are involved in metabolic diseases, gastrointestinal, and liver cancer. BAs have become established as important signaling molecules that enable fine-tuned inter-tissue communication within the enterohepatic circulation. The liver, BAs site of production, displayed physiological and functional zonal differences in the periportal zone versus the centrilobular zone. In addition, BA metabolism shows regional differences in the intestinal tract. However, there is no available method to detect the spatial distribution and molecular profiling of BAs within the enterohepatic circulation. Herein, we demonstrated the application in mass spectrometry imaging (MSI) with a high spatial resolution (3 μm) plus mass accuracy matrix-assisted laser desorption ionization (MALDI) to imaging BAs and N-1-naphthylphthalamic acid (NPA). Our results could clearly determine the zonation patterns and regional difference characteristics of BAs on mouse liver, ileum, and colon tissue sections, and the relative content of BAs based on NPA could also be ascertained. In conclusion, our method promoted the accessibility of spatial localization and quantitative study of BAs on gastrointestinal tissue sections and demonstrated that MALDI-MSI was a valuable tool to investigate and locate several BA molecules in different tissue types leading to a better understanding of the role of BAs behind the gastrointestinal diseases.

Keywords: MALDI; bile acid; enterohepatic circulation; mass spectrometry imaging (MSI); metabolic disease; zonation pattern.


Conflict of interest statement

The authors declare that the research was conducted in the absence of any commercial or financial relationships that could be construed as a potential conflict of interest.

Figures

FIGURE 1
FIGURE 1
MS imaging-based visual mapping profiles of BAs distributed within regions of liver. MS ion images representing spatial distributions of NPA (m/z 290.0823 ± 0.05) and the identified BAs at CDCA/UDCA/DCA m/z 391.2854 ± 0.05 (A), TCDCA/TUDCA/TDCA m/z 498.2895 ± 0.05 (B) and TCA/TMCA m/z 514.2844 ± 0.05 (C) for the whole section of mouse liver (Scale bars: 1,000 μm). Overlay: Overlay of each MS ion image and optical image. All ion images were normalized to the 9AA matrix signal. Abbreviation: CD, control diet group; HFD, high-fat diet group.
FIGURE 2
FIGURE 2
Imaging MS visualize the zonation patterns of BA metabolism in liver of HFD-fed mice. MS ion images representing spatial distributions of the identified taurine-conjugated BAs at m/z 498.2895 ± 0.05 (TCDCA/TUDCA/TDCA) and m/z 514.2844 ± 0.05 (TCA/TMCA) for the mouse liver in same tissue section at high spatial resolution. Overlay: Overlay of each MS ion image and optical image. All ion images were normalized to the 9AA matrix signal. The green arrows indicated bile ducts, whereas the red arrows showed blood vessels. Scale bars: 250 μm.
FIGURE 3
FIGURE 3
MS imaging-based visual mapping profiles of BAs distributed within regions of ileum. MS ion images representing spatial distributions of NPA (m/z 290.0823 ± 0.05) and the identified BAs at TCDCA/TUDCA/TDCA m/z 498.2895 ± 0.05 (A), TCA/TMCA m/z 514.2844 ± 0.05 (B) and GCA m/z 464.3018 ± 0.05 (C) for the whole section of mouse ileum (Scale bars: 700 μm). Overlay: Overlay of each MS ion image and optical image. All ion images were normalized to the 9AA matrix signal. Abbreviation: CD, control diet group; HFD, high-fat diet group.
FIGURE 4
FIGURE 4
MS imaging-based visual mapping profiles of BAs distributed within regions of colon. MS ion images representing spatial distributions of NPA (m/z 290.0823 ± 0.05) and the identified BAs at CDCA/UDCA/DCA m/z 391.2854 ± 0.05 (A), TCDCA/TUDCA/TDCA m/z 498.2895 ± 0.05 (B), LCA m/z 375.2905 ± 0.05 (C), TLCA m/z 482.2946 ± 0.05 (D), TCA/TMCA m/z 514.2844 ± 0.05 (E) and GCA m/z 464.3018 ± 0.05 (F) for the whole section of mouse colon (Scale bars: 700 μm). Overlay: Overlay of each MS ion image and optical image. All ion images were normalized to the 9AA matrix signal. Abbreviation: CD, control diet group; HFD, high-fat diet group.
FIGURE 5
FIGURE 5
Distribution profiles of BAs in colon were studied through comparison of relative intensities of BAs by the values of p between ROI-1 and ROI-2. Signal intensities of targeted BAs in ROI of two different regions of colon were depicted and signal normalization was performed by pixel. ROI-1: submucosa, muscular layer and adventitia; ROI-2: mucosa layer. The letter ‘p’ denotes the statistical p-value of the comparison, significant differences were highlighted in green font while insignificant differences were highlighted in red font (A). The spectrum of each ROI which set in (A). The spectra were vertically inverted, with that of ROI-1 above in red and that of ROI-2 below in blue (B).

References

    1. Liu HX, Keane R, Sheng L, Wan YJ. Implications of microbiota and bile acid in liver injury and regeneration. J Hepatol. (2015) 63:1502–10. 10.1016/j.jhep.2015.08.001 - DOI - PMC - PubMed
    1. Liu HX, Rocha CS, Dandekar S, Wan YJ. Functional analysis of the relationship between intestinal microbiota and the expression of hepatic genes and pathways during the course of liver regeneration. J Hepatol. (2016) 64:641–50. 10.1016/j.jhep.2015.09.022 - DOI - PMC - PubMed
    1. Hu Y, Liu HX, Jena PK, Sheng L, Ali MR, Wan YY. miR-22 inhibition reduces hepatic steatosis via FGF21 and FGFR1 induction. JHEP Rep. (2020) 2:100093. 10.1016/j.jhepr.2020.100093 - DOI - PMC - PubMed
    1. Sheng L, Jena PK, Liu HX, Hu Y, Nagar N, Bronner DN, et al. Obesity treatment by epigallocatechin-3-gallate-regulated bile acid signaling and its enriched Akkermansia muciniphila. FASEB J. (2018) 32:fj201800370R. 10.1096/fj.201800370R - DOI - PMC - PubMed
    1. Sheng L, Jena PK, Hu Y, Liu HX, Nagar N, Kalanetra KM, et al. Hepatic inflammation caused by dysregulated bile acid synthesis is reversible by butyrate supplementation. J Pathol. (2017) 243:431–41. 10.1002/path.4983 - DOI - PMC - PubMed

LinkOut - more resources