. 2022 Apr 1:9:801309.
doi: 10.3389/fmolb.2022.801309. eCollection 2022.

A Rapid, Highly Sensitive and Open-Access SARS-CoV-2 Detection Assay for Laboratory and Home Testing

Affiliations

A Rapid, Highly Sensitive and Open-Access SARS-CoV-2 Detection Assay for Laboratory and Home Testing

Max J Kellner et al. Front Mol Biosci. .

Abstract

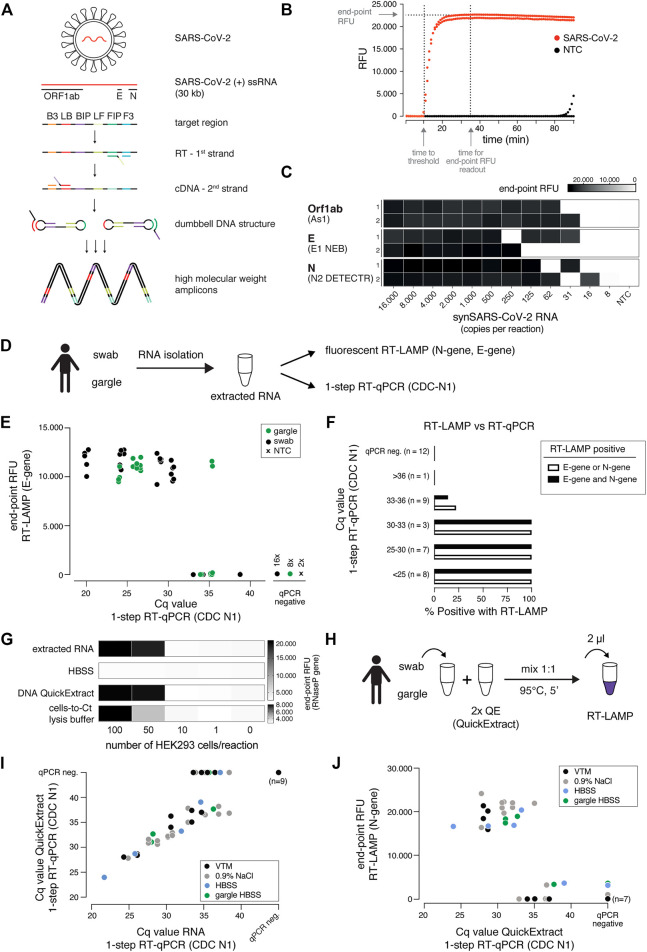
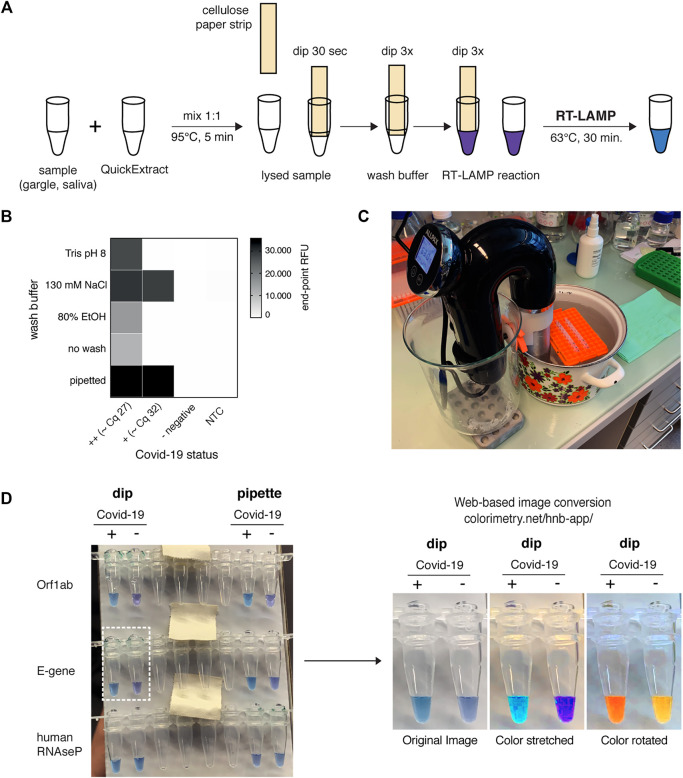
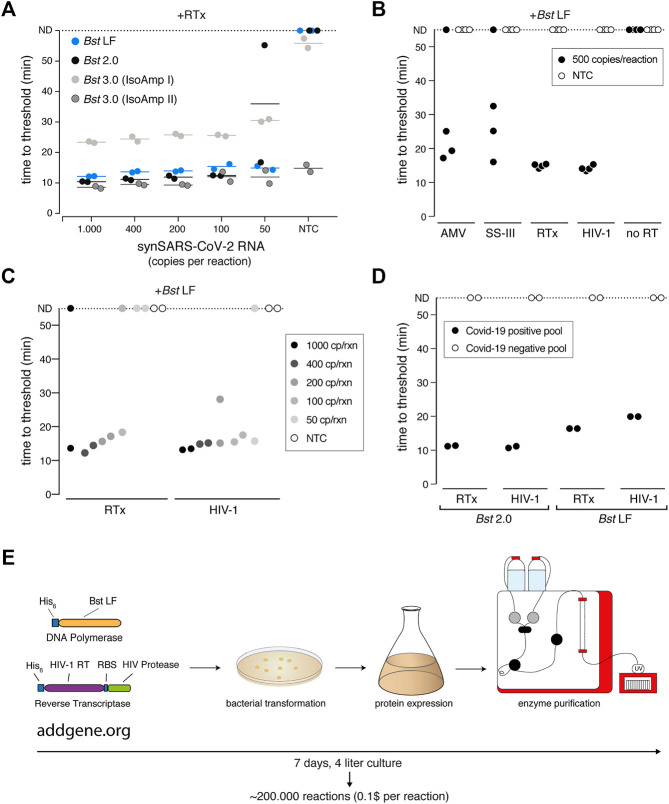
RT-qPCR-based diagnostic tests play important roles in combating virus-caused pandemics such as Covid-19. However, their dependence on sophisticated equipment and the associated costs often limits their widespread use. Loop-mediated isothermal amplification after reverse transcription (RT-LAMP) is an alternative nucleic acid detection method that overcomes these limitations. Here, we present a rapid, robust, and sensitive RT-LAMP-based SARS-CoV-2 detection assay. Our 40-min procedure bypasses the RNA isolation step, is insensitive to carryover contamination, and uses a colorimetric readout that enables robust SARS-CoV-2 detection from various sample types. Based on this assay, we have increased sensitivity and scalability by adding a nucleic acid enrichment step (Bead-LAMP), developed a version for home testing (HomeDip-LAMP), and identified open-source RT-LAMP enzymes that can be produced in any molecular biology laboratory. On a dedicated website, rtlamp.org (DOI: 10.5281/zenodo.6033689), we provide detailed protocols and videos. Our optimized, general-purpose RT-LAMP assay is an important step toward population-scale SARS-CoV-2 testing.

Keywords: COVID-19 diagnostics; RT-LAMP; SARS-CoV-2; coronavirus; isothermal amplification; open-source.


Conflict of interest statement

The authors declare that the research was conducted in the absence of any commercial or financial relationships that could be construed as a potential conflict of interest.

Figures

FIGURE 1
FIGURE 1
A sensitive, robust RT-LAMP assay compatible with crude patient samples. (A) Schematic illustrating loop-mediated amplification (LAMP) of SARS-CoV-2 RNA and the regions targeted in this study (Orf1ab, E and N genes; depicted above). Each target region is recognized by a defined set of primers (B3, LB, BIP, LF, FIP, F3). The RNA template (red) is reverse transcribed and displaced after first-strand synthesis; the outer primer binding sites are added in the subsequent amplification step. The resulting dumbbell DNA structure acts as template for further rounds of amplification, ultimately leading to high molecular weight amplicons. (B) Readout of a real-time fluorescence RT-LAMP reaction using 500 copies of synthetic SARS-CoV-2 (red) or water as non-targeting control (NTC, black) as input. “Time to threshold” indicates the time at which the fluorescence value reaches threshold level (equivalent to Cq value in RT-qPCR assays), “end-point RFU” indicates the fluorescence value (FAM filter set, absorption/emission at 494 nm/518 nm) after 35 min reaction time (used throughout this study unless indicated otherwise); RFU: relative fluorescence units. (C) Performance of the three top primer sets for RT-LAMP-based SARS-CoV-2 detection. End-point relative fluorescence units (RFUs) of RT-LAMP reactions (in duplicates) using the indicated primer sets and serially diluted synthetic SARS-CoV-2 RNA standard as input. Water was used as no-target control (NTC). (D) Cartoon indicating the workflow for SARS-CoV-2 detection by either RT-LAMP or 1-step RT-qPCR from patient samples (nasopharyngeal swab or gargle) with prior RNA isolation. (E) Comparison of RT-LAMP and RT-qPCR performance. Plotted are RT-LAMP end-point fluorescence values after 35 min versus the respective RT-qPCR Cq values. RNA was derived from gargle (green) or nasopharyngeal swabs (black); two no-target controls were included (black cross). Reactions in which no amplification was recorded are labelled as qPCR negative. (F) Detection rate for RT-LAMP reactions compared to a gold standard 1-step RT-qPCR assay. Shown are percentages of positive (detected in RT-LAMP and RT-qPCR) predictive agreement for sample groups (defined by RT-qPCR-derived Cq values) between RT-LAMP (using E- and/or N-gene primers) and 1-step RT-qPCR. (G) Performance of different crude sample preparation methods in RT-LAMP. Shown are end-point relative fluorescence units (RFUs) for RT-LAMP reactions targeting human RNAseP on sample inputs derived from defined numbers of HEK293 cells mixed 1:1 with indicated 2x buffers (extracted RNA served as a positive control). (H) Cartoon indicating the workflow for RT-LAMP using QuickExtract crude lysate as sample input. (I) Comparison of QuickExtract crude sample input versus extracted RNA as input using 1-step RT-qPCR. COVID-19 patient nasopharyngeal swabs or gargle samples (color coded according to the indicated collection medium) were either processed with the QuickExtract workflow (crude sample input) or RNA was extracted using an automated King Fisher RNA bead purification protocol. Reactions in which no amplification was recorded are labelled as qPCR negative. (J) Performance of RT-LAMP with QuickExtract treated crude COVID-19 patient sample input (same samples as in I). Depicted is the comparison of Cq values from RT-qPCR performed on QuickExtract treated samples versus corresponding end-point relative fluorescence units (RFUs) from RT-LAMP reactions.
FIGURE 2
FIGURE 2
The dUTP/UDG system prevents carry-over cross-contamination in RT-LAMP. (A) Schematic depicting the principle of the dUTP/UDG system in preventing carry-over contamination. dUTP is incorporated into LAMP amplicons in a primary reaction (pre-RT-LAMP). dUTP containing LAMP products carried over into a subsequent reaction (RT-LAMP) are cleaved by UDG prior to LAMP-based amplification, making them unavailable as amplification templates. This allows robust discrimination between target and no-target control (left), which is challenged by cross-over contamination in the absence of UDG-mediated cleavage (right). (B) The dUTP/UDG system minimizes cross-over contamination. Shown are performances (time to threshold) of RT-LAMP reactions in the absence (left) or presence (right) of thermolabile UDG when using synthetic SARS-CoV-2 (filled circles) or water (open circles) as input. Reactions were supplemented with the indicated dilution of a dUTP-containing pre-LAMP reaction. All reactions were performed in duplicates.
FIGURE 3
FIGURE 3
HNB RT-LAMP enables colorimetric SARS-CoV-2 detection from crude patient samples. (A) Schematic illustrating the properties of pH-sensitive (Phenol Red, top) and Mg2+ concentration sensitive (hydroxynaphthol blue, HNB, bottom) colorimetric readouts for LAMP. Phenol Red interacts with protons (H+) generated during DNA amplification, which causes a color change from pink/red to yellow (right: the color range of the Phenol Red-containing colorimetric RT-LAMP mastermix (NEB) at relevant pH values). Magnesium pyrophosphate precipitate produced during DNA amplification lowers the free Mg2+ concentration, causing a color change of the HNB dye from purple to sky-blue (right: the color range of solutions with HNB at relevant Mg2+ concentrations). (B) Influence of QuickExtract on colorimetric RT-LAMP performance using HNB or Phenol Red. Shown are RT-LAMP reaction outcomes (upper panel: colorimetric readout after 35 min, lower panel: fluorescent end-point values) when using 500 copies of synthetic SARS-CoV-2 RNA standard in indicated sample media diluted 1:1 with water or 2x QuickExtract solution as input. (C) Shown is the result from the QuickExtract HNB RT-LAMP dilution series, uploaded and color-converted via our custom web-based colorimetry tool. The top row shows the original image, middle and bottom rows are the color-stretched and color-rotated versions. (D) HNB RT-LAMP performance on COVID-19 patient samples lysed in QuickExtract solution. Shown is the binary colorimetric HNB readout of RT-LAMP reactions (N gene) using indicated patient samples (sputum (orange), swab (black), gargle (green)) plotted against the corresponding Cq values from RT-qPCR. (E) End-point 650 nm absorbance measurements from a HNB RT-LAMP dilution series. The raw and color-rotated images of the reactions are shown on the top, while the 650 nm absorbance measured by a Synergy H1 plate reader is shown below. (F) Scatter plot showing HNB RT-LAMP performance (measured by 650 nm absorbance) versus qPCR-determined Cq values on a serial dilution grid (see methods for details), including no-target controls (NTC) and a COVID-19-negative patient sample (qPCR negative). Horizontal dashed line indicates the absorbance (mean + 3SD) from five negative controls (y = 0.67). (G) Simple logistic regression analysis (Probit Model) of HNB RT-LAMP reaction outcomes performed on QuickExtract patient samples shown in Figure 3D and F using Graphpad Prism. Shown is the regression line representing detection limits, expressed as “Fraction positive rate”, at a given RT-qPCR Ct value with corresponding 95% confidence intervals (grey shading).
FIGURE 4
FIGURE 4
bead-LAMP increases sensitivity of RT-LAMP assays. (A) Schematic illustrating the bead-LAMP workflow in comparison to the regular RT-LAMP workflow. AMPure XP RNA capture beads were used at 0.6x of the volume of the sample lysate (0.6x beads). (B) Performance of bead-LAMP (+ bead enrichment) vs. regular RT-LAMP (− bead enrichment) using a synthetic SARS-CoV-2 RNA standard spiked-in at the indicated concentration in the original sample into HeLa cell QuickExtract (QE) lysate. 50 µl of crude sample in QE, adjusted to 100 µl final volume with 1x HBSS was used for bead-enrichment. The image shows HNB end-point colorimetric readout of bead-LAMP and RT-LAMP reactions, as well as the color-converted images produced with colorimetry.net on the right. All reactions were performed in technical quadruplicates. (C) End-point relative fluorescence units (RFUs), with or without prior bead enrichment for reactions shown in (B). (D) Performance of 1-step RT-qPCR using 2 µl of the same crude sample preparations as used in (B) and (C). (E) Positive detection rates of 1-step RT-qPCR, RT-LAMP and bead-LAMP for reactions shown in (B–D). (F) Performance of bead-LAMP on a COVID-19 positive panel of patient samples in QuickExtract. The images depict the original HNB (top) and color-rotated (middle) version from colorimetric end-point readouts, and the heatmaps underneath show co-measured end-point relative fluorescence units (RFUs) of RT-LAMP reactions, with or without prior bead enrichment, using eight COVID-19-positive and five negative samples as input (P1-P11, COVID-19 patient sample; CS42 and CS46, healthy controls). 100 µl of crude sample in QE was used for bead-enrichment. Corresponding Cq values were obtained by measuring 2 µl of the same QuickExtract (QE) patient samples by 1-step RT-qPCR prior to bead enrichment. (G) Bead enrichment increases the sensitivity of RT-LAMP. Patient samples from (F) were classified as detected or not detected based on the HNB RT-LAMP assay before (left, open circles) and after (right, filled circles) bead enrichment and plotted against their respective Cq values obtained from QuickExtract (QE) RT-qPCR (Cq values for qPCR negative samples are labelled as not detected, ND). (H) Schematic illustrating the pooled testing strategy using bead-LAMP. A single COVID-19 positive patient gargle sample in QuickExtract (Cq ∼28; black) was mixed with different amounts of 95 pooled SARS-CoV-2 negative samples (all in QuickExtract; white) yielding seven sample pools with indicated ratios of positive to negative samples. 40–100 µl of crude sample in QE was used for bead-enrichment depending on the pool sizes. For lysate volumes smaller than 100 μl, 1x HBSS was added to obtain a final volume of 100 µl for bead-LAMP. (I) Shown is the performance (measured as time to threshold) of bead-LAMP (filled circles) compared to regular RT-LAMP (open circles) on the patient pools defined in (H). ND = not detected within 60 min of RT-LAMP incubation. (J) Images showing the endpoint HNB colorimetric readout (top) and a color-rotated version underneath.
FIGURE 5
FIGURE 5
HomeDip-LAMP enables SARS-CoV-2 detection in low-resource and home settings. (A) Schematic depicting the HomeDip-LAMP workflow. Samples are mixed 1:1 with QuickExtract lysis buffer and inactivated at 95°C for 5 min. Cellulose paper dipsticks are loaded by dipping into the crude sample for 30 s. After a brief washing step (3x dipping into wash buffer), RNA is released into pre-distributed RT-LAMP reaction mixes by 3x dipping. RT-LAMP reactions are performed in a water bath at 63°C and read out after 35 min. (B) Influence of different wash conditions on SARS-CoV-2 detection using RT-LAMP with paper dipstick sample transfer. Heatmap showing end-point relative fluorescence units (RFUs) at 30 min of RT-LAMP reactions after transferring 2 µl of high titer (++, Cq ∼27), medium-to-low titer (+, Cq ∼32) or negative COVID-19 patient samples in QuickExtract into 8 µl of RT-LAMP reaction mix using cellulose paper dipsticks. Dipsticks were washed in between in indicated solutions or transferred without washing. A sample series where 2 µl were transferred by pipetting (“pipette”) is shown alongside (NTC = no target control). (C) Image showing the water bath setup with a Sous Vide heater (black) for HomeDip-LAMP. Reaction tubes were kept upright and submerged using floating plastic pipette tip racks (orange). (D) Detection of SARS-CoV-2 using HomeDip-LAMP. Left image shows true color readout (HNB dye) of HomeDip-LAMP (left 2 tubes) and pipetted LAMP (right 2 tubes) reactions using a COVID-19-positive (+) and -negative (−) patient sample in QuickExtract as input (35 min end-point; water bath incubation at 63°C). Amplicons are indicated to the left; the human RNAseP amplicon served as positive control. The images to the right show color-manipulations via the web-app (https://colorimetry.net/hnb-app/) of the two PCR tubes highlighted on the left for easier readout.
FIGURE 6
FIGURE 6
A sensitive RT-LAMP assay based on open-access enzymes. (A) RT-LAMP performance (measured as “time to threshold”) of different Bst DNA polymerase variants in combination with NEB’s RTx reverse transcriptase on synthetic SARS-CoV-2 RNA standard. For reactions in which no amplification was recorded, “time to threshold” is reported as “not detected” (ND) throughout Figures 6A–D. Reactions were performed in duplicates; water was used as no-target control (NTC). (B) RT-LAMP performance (measured as “time to threshold”) of different patent-protected (RTx, SuperScript III (SS-III)) and non-patent protected (AMV, HIV-1) reverse transcriptase enzymes in combination with Bst LF DNA polymerase on 500 copies/reaction of synthetic SARS-CoV-2 RNA standard. Reactions were performed in technical quadruplicates; water was used as no-target control (NTC) (C) RT-LAMP sensitivity performance (measured as “time to threshold”) of reactions containing NEB RTx or home-made HIV-1 RT, in combination with Bst LF DNA polymerase. Reactions contained different amounts of synthetic SARS-CoV-2 RNA standard. Reactions were performed in technical duplicates; water was used as no-target control (NTC). (D) Performance of RT-LAMP (measured as “time to threshold”) with different enzymatic compositions and QuickExtract patient sample as input. A pool of COVID-19 positive patient crude lysates (Pool N1-CDC, Cq 25) and a pool of COVID-19 negative crude lysates were tested in technical duplicates. (E) Deployment of open-access RT-LAMP. Bacterial expression plasmids can be obtained from Addgene (https://www.addgene.org/159148/, https://www.addgene.org/159149/). HIV-1 RT and Bst LF sufficient for ∼220.000 reactions of RT-LAMP can be obtained within 1 week, starting from 4 L of E. coli cultures.

References

    1. Álvarez M., Matamoros T., Menéndez-Arias L. (2009). Increased Thermostability and Fidelity of DNA Synthesis of Wild-type and Mutant HIV-1 Group O Reverse Transcriptases. J. Mol. Biol. 392 (4), 872–884. 10.1016/j.jmb.2009.07.081 - DOI - PubMed
    1. Anahtar M. N., McGrath G. E. G., Rabe B. A., Tanner N. A., White B. A., Lennerz J. K. M., et al. (2021). Clinical Assessment and Validation of a Rapid and Sensitive SARS-CoV-2 Test Using Reverse Transcription Loop-Mediated Isothermal Amplification without the Need for RNA Extraction. Open Forum Infect. Dis. 8 (2), ofaa631. 10.1093/ofid/ofaa631 - DOI - PMC - PubMed
    1. Artesi M., Bontems S., Göbbels P., Franckh M., Maes P., Boreux R., et al. (2020). A Recurrent Mutation at Position 26340 of SARS-CoV-2 Is Associated with Failure of the E Gene Quantitative Reverse Transcription-PCR Utilized in a Commercial Dual-Target Diagnostic Assay. J. Clin. Microbiol. 58 (10), e01598–20. 10.1128/JCM.01598-20 - DOI - PMC - PubMed
    1. Baba M. M., Bitew M., Fokam J., Lelo E. A., Ahidjo A., Asmamaw K., et al. (2021). Diagnostic Performance of a Colorimetric RT -LAMP for the Identification of SARS-CoV-2: A Multicenter Prospective Clinical Evaluation in Sub-saharan Africa. EClinicalMedicine 40, 101101. 10.1016/j.eclinm.2021.101101 - DOI - PMC - PubMed
    1. Bhadra S., Pothukuchy A., Shroff R., Cole A. W., Byrom M., Ellefson J. W., et al. (2018). Cellular Reagents for Diagnostics and Synthetic Biology. PLOS ONE 13 (8), e0201681. 10.1371/journal.pone.0201681 - DOI - PMC - PubMed