. 2022 Mar 16:25:190-204.
doi: 10.1016/j.omtm.2022.03.007. eCollection 2022 Jun 9.

AAV-mediated BMP7 gene therapy counteracts insulin resistance and obesity

Affiliations

AAV-mediated BMP7 gene therapy counteracts insulin resistance and obesity

Estefania Casana et al. Mol Ther Methods Clin Dev. .

Abstract

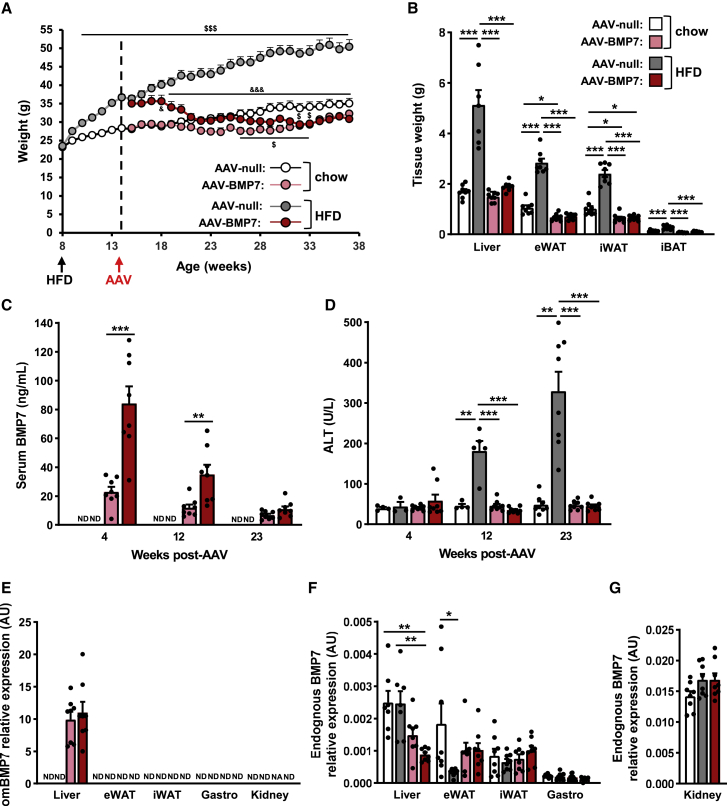
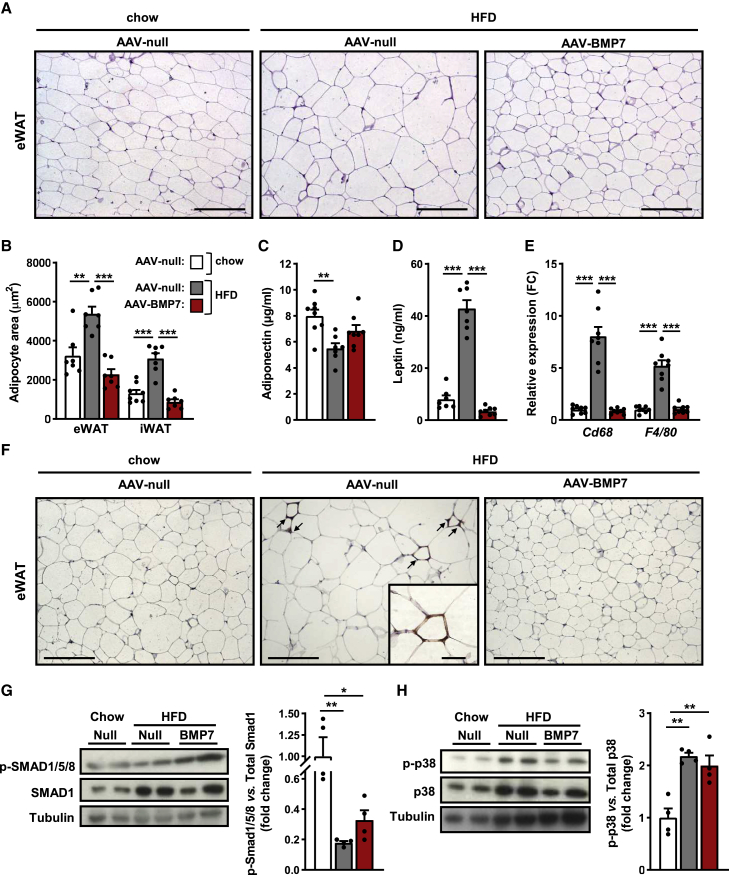
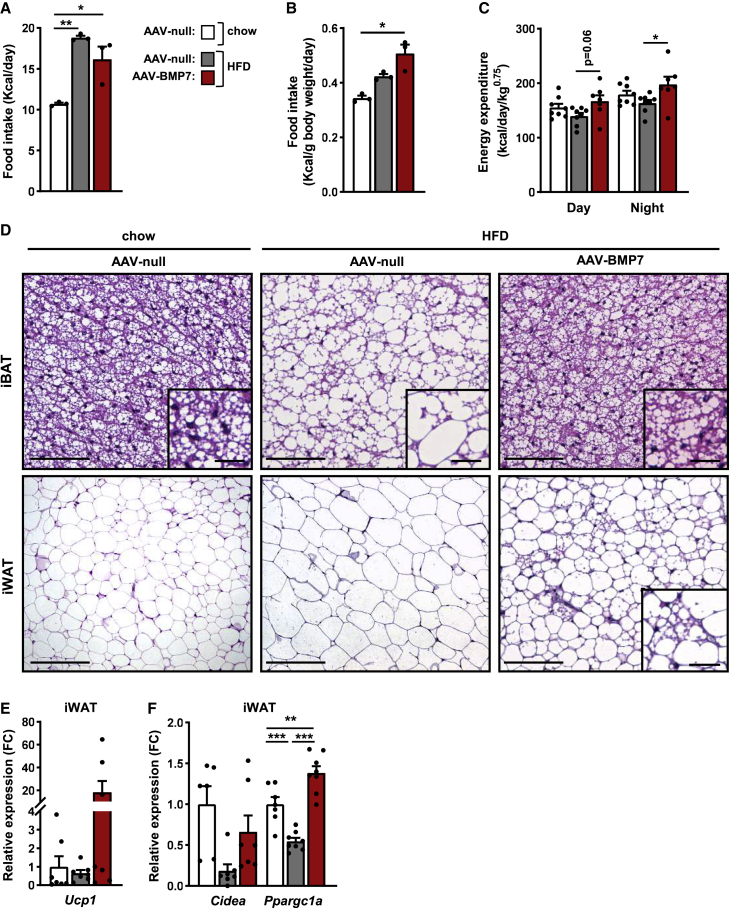
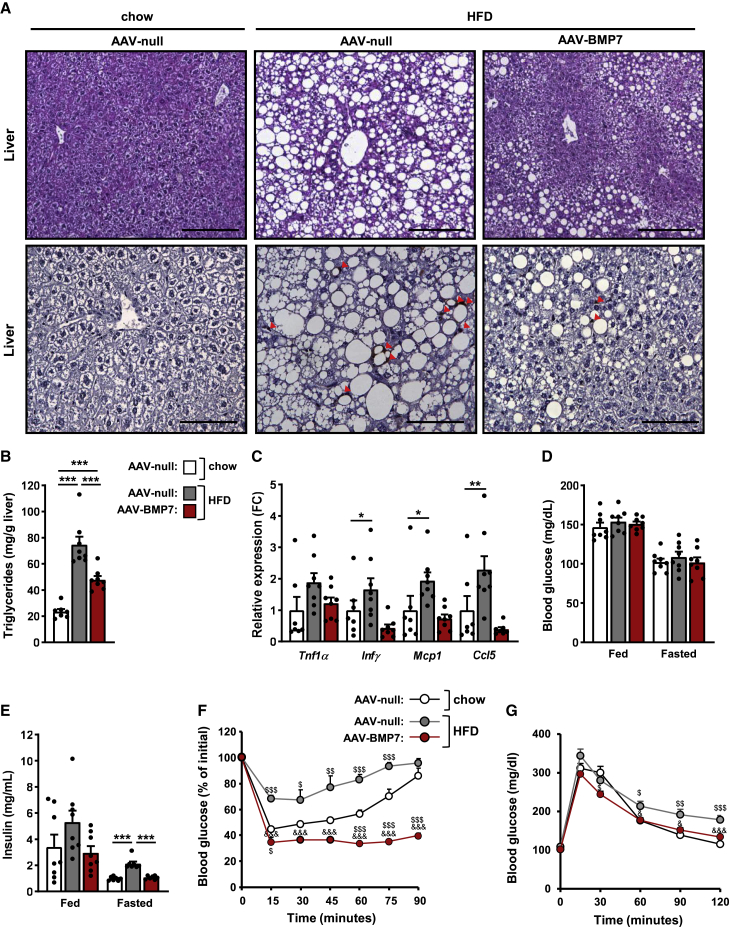
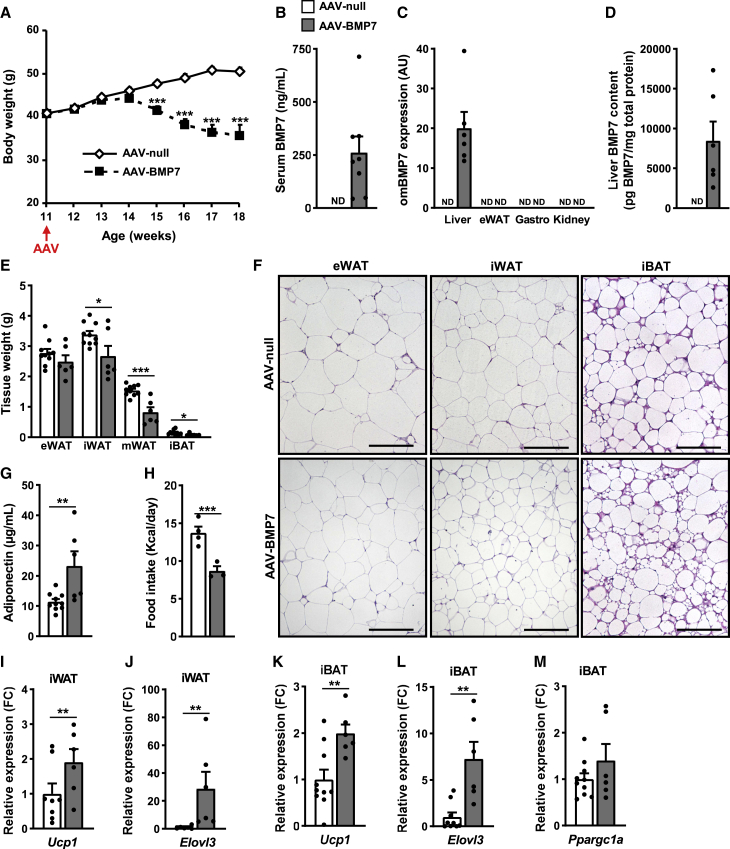
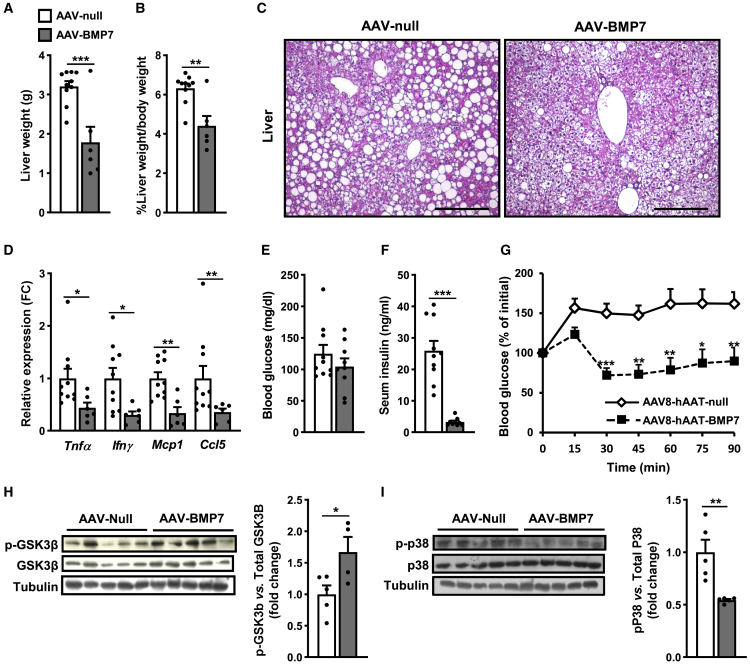
Type 2 diabetes, insulin resistance, and obesity are strongly associated and are a major health problem worldwide. Obesity largely results from a sustained imbalance between energy intake and expenditure. Therapeutic approaches targeting metabolic rate may counteract body weight gain and insulin resistance. Bone morphogenic protein 7 (BMP7) has proven to enhance energy expenditure by inducing non-shivering thermogenesis in short-term studies in mice treated with the recombinant protein or adenoviral vectors encoding BMP7. To achieve long-term BMP7 effects, the use of adeno-associated viral (AAV) vectors would provide sustained production of the protein after a single administration. Here, we demonstrated that treatment of high-fat-diet-fed mice and ob/ob mice with liver-directed AAV-BMP7 vectors enabled a long-lasting increase in circulating levels of this factor. This rise in BMP7 concentration induced browning of white adipose tissue (WAT) and activation of brown adipose tissue, which enhanced energy expenditure, and reversed WAT hypertrophy, hepatic steatosis, and WAT and liver inflammation, ultimately resulting in normalization of body weight and insulin resistance. This study highlights the potential of AAV-BMP7-mediated gene therapy for the treatment of insulin resistance, type 2 diabetes, and obesity.

Keywords: AAV; BMP7; gene therapy; insulin resistance; obesity; type 2 diabetes.


Conflict of interest statement

The authors declare no competing interests.

Figures

None
Graphical abstract
Figure 1
Figure 1
AAV-mediated liver gene transfer of BMP7 counteracts HFD-induced obesity (A) Body-weight follow-up of C57BL/6 mice fed either chow or an HFD for 6 weeks and then administered intravenously with 1 × 1012 vg of AAV-BMP7 vector per mouse. Control obese mice and control chow-fed mice were treated with AAV-null vectors (n = 8/group). &p < 0.05 and &&&p < 0.001 versus the HFD-fed null-injected group. $p < 0.05 and $$$p < 0.001 versus the chow-fed null-injected group. (B) Weight of the liver, epididymal (eWAT) and inguinal (iWAT) white adipose tissue depots, and interscapular brown adipose tissue (iBAT) of the same cohorts as in (A) (n = 7–8/group). (C) Circulating levels of BMP7 (n = 8/group). (D) Alanine aminotransferase (ALT) serum levels (n = 3–8/group). (E) Quantitative PCR analysis of Bmp7 expression in the liver, eWAT, iWAT, gastrocnemius, and kidney was performed with primers that specifically detected vector-derived BMP7 mRNA (omBMP7) (n = 7–8/group). (F) Quantitative PCR analysis of endogenous Bmp7 expression in liver, eWAT, iWAT, and gastrocnemius (n = 7–8/group). (G) Quantitative PCR analysis of endogenous Bmp7 expression in kidney (n = 8/group). All values are expressed as the mean ± SEM. ND, not detected; NA, not available; AU, arbitrary units; HFD, high-fat diet. ∗p < 0.05, ∗∗p < 0.01, and ∗∗∗p < 0.001.
Figure 2
Figure 2
Reversal of WAT hypertrophy and inflammation by AAV-BMP7 treatment (A) Representative images of hematoxylin-eosin staining of eWAT. Scale bars: 200 μm. (B) Morphometric analysis of the area of eWAT and iWAT adipocytes (n = 7–8/group). (C and D) Circulating levels of adiponectin (C) and leptin (D) (n = 7–8/group). (E) Quantitative PCR analysis of the expression of the macrophage markers Cd68 and F4/80 in eWAT (n = 8/group). (F) Immunohistochemistry for the macrophage-specific marker Mac2 in eWAT sections. Scale bars: 200 and 50 μm (inset). (G) Determination of phosphorylated SMAD1/5/8 (p-SMAD1/5/8) protein abundance in eWAT: immunoblot and densitometric analysis (n = 4/group). (H) Determination of phosphorylated p38 (p-p38) protein abundance in eWAT: immunoblot and densitometric analysis (n = 4/group). All values are expressed as the mean ± SEM. HFD, high-fat diet; FC, fold change. ∗p < 0.05, ∗∗p < 0.01, and ∗∗∗p < 0.001.
Figure 3
Figure 3
AAV-BMP7 increases energy expenditure, decreases fat accumulation in iBAT and iWAT, and induces browning (A) Histogram depicting the mean food intake per day from week 15 to week 36 of age of HFD-fed mice treated with either AAV-BMP7 or AAV-null vectors and of chow-fed mice administered AAV-null vectors (n = 3 cages/group and 2–3 mice/cage). (B) Food intake normalized by body weight from week 15 to week 36 of age (n = 3 cages/group and 2–3 mice/cage). (C) Energy expenditure was measured with an indirect open-circuit calorimeter 10 weeks after AAV vector delivery. Data were taken during the light and dark cycles (n = 7–8/group). (D) Hematoxylin-eosin staining of iBAT and iWAT sections. Scale bars: 200 and 50 μm (inset). (E and F) Quantitative PCR analysis in iWAT of the expression of the thermogenic markers Ucp1 (E) and Cidea and Ppargc1a (F) (n = 6–8/group). All values are expressed as the mean ± SEM. HFD, high-fat diet; FC, fold change. ∗p < 0.05, ∗∗p < 0.01, and ∗∗∗p < 0.001.
Figure 4
Figure 4
Treatment with BMP7-encoding vectors improves hepatic steatosis and reverses insulin resistance (A) Hematoxylin-eosin staining (top) and immunostaining for the macrophage-specific marker Mac2 (bottom) of liver sections. Red arrows indicate macrophages. Scale bars: 200 μm (hematoxylin-eosin) and 100 μm (Mac2). (B) Hepatic triglyceride content (n = 7–8/group). (C) Quantitative PCR analysis of the expression of the pro-inflammatory cytokines Tnfα, Ifnγ, Mcp1, and Ccl5 in the liver (n = 7–8/group). (D) Fed and fasted blood glucose levels 19 and 8 weeks after vector administration, respectively (n = 8/group). (E) Fed and fasted serum insulin levels 19 and 20 weeks after vector delivery, respectively (n = 7–8/group). (F) Insulin sensitivity was determined after an intraperitoneal injection of insulin (0.75 units insulin/kg body weight) 17 weeks post-AAV delivery. Results were calculated as the percentage of initial blood glucose levels (n = 8, chow AAV-null; n = 8, HFD AAV-null; and n = 7, HFD AAV-BMP7). (G) Glucose tolerance was performed 8 weeks post-AAV (1 g glucose/kg body weight) (n = 8/group). Fasted refers to 16 h of food deprivation. All values are expressed as the mean ± SEM. HFD, high-fat diet; FC, fold change. ∗p < 0.05, ∗∗p < 0.01, and ∗∗∗p < 0.001. &p < 0.05 and &&&p < 0.001 versus the HFD-fed null-injected group. $p < 0.05, $$p < 0.01, and $$$p < 0.001 versus the chow-fed null-injected group.
Figure 5
Figure 5
Reduced obesity in ob/ob mice treated with AAV-BMP7 vectors. ob/ob mice were administered intravenously with 1 × 1013 vg of either AAV-BMP7 or AAV-null vector per mouse and followed up for 7 weeks (A) Follow-up of the body weight (n = 10, AAV-null, and n = 9, AAV-BMP7). (B) Serum BMP7 levels at 7 weeks after vector administration (n = 8–10/group). (C) Quantitative PCR analysis of omBMP7 expression in the liver, eWAT, gastrocnemius (Gastro), and kidney. The qPCR was performed with primers that specifically detected vector-derived BMP7 mRNA (omBMP7) (n = 6–10/group). (D) Liver BMP7 content 7 weeks after vector administration (n = 6–10/group). (E) Weight of the eWAT, iWAT, mesenteric white adipose tissue (mWAT), and iBAT (n = 6–10/group). (F) Representative images of the hematoxylin-eosin staining of eWAT, iWAT, and iBAT tissue sections obtained from ob/ob animals injected with either null or BMP7-encoding AAV. Scale bars: 100 μm. (G) Serum adiponectin levels (n = 6–10/group). (H) Histogram depicting the mean food intake per day from week 13 to week 17 of age of ob/ob mice treated with either AAV-BMP7 or AAV-null vectors (n = 4 cages, AAV-null; n = 3 cages, AAV-BMP7; 1–3 mice/cage). (I–M) Quantitative PCR analysis in iWAT (I, J) or iBAT (K, L, M) of the expression of the thermogenic markers Ucp1 (I, K), Elovl3 (J, L), or Ppargc1a (M) (n = 6–10/group). All values are expressed as the mean ± SEM. ND, not detected; FC, fold change; AU, arbitrary units. ∗p < 0.05, ∗∗p < 0.01, and ∗∗∗p < 0.001.
Figure 6
Figure 6
Improved insulin sensitivity in ob/ob mice treated with AAV-BMP7 vectors (A) Liver weight (n = 6–10/group). (B) Liver weight normalized by body weight (n = 6–10/group). (C) Representative images of the hematoxylin-eosin staining of liver tissue sections obtained from ob/ob animals injected with either null or BMP7-encoding AAV. Scale bars: 200 μm. (D) Quantitative PCR analysis of the expression of the pro-inflammatory cytokines Tnfα, Ifnγ, Mcp1, and Ccl5 in liver (n = 6–10/group). (E) Fed blood glucose levels at 5 weeks after vector administration (n = 9–10/group). (F) Fed serum insulin levels at 6 weeks after vector administration (n = 9–10/group). (G) Insulin tolerance test after intraperitoneal injection of insulin at a dose of 0.75 units insulin/kg body weight. Results were calculated as the percentage of initial blood glucose levels (n = 10, AAV-null, and n = 6, AAV-BMP7). (H) Determination of phosphorylated GSK3β (p-GSK3β) protein abundance in the liver: immunoblot and densitometric analysis (n = 4–5/group). (I) Determination of phosphorylated p38 (p-p38) protein abundance in the liver: immunoblot and densitometric analysis (n = 5/group). All values are expressed as the mean ± SEM. ∗p < 0.05, ∗∗p < 0.01, and ∗∗∗p < 0.001.

References

    1. Duclos M. Osteoarthritis, obesity and type 2 diabetes: the weight of waist circumference. Ann. Phys. Rehabil. Med. 2016;59:157–160. - PubMed
    1. Van Gaal L.F., Mertens I.L., De Block C.E. Mechanisms linking obesity with cardiovascular disease. Nature. 2006;444:875–880. - PubMed
    1. Renehan A.G., Tyson M., Egger M., Heller R.F., Zwahlen M. Body-mass index and incidence of cancer: a systematic review and meta-analysis of prospective observational studies. Lancet. 2008;371:569–578. - PubMed
    1. Kim B., Feldman E.L. Insulin resistance as a key link for the increased risk of cognitive impairment in the metabolic syndrome. Exp. Mol. Med. 2015;47:e149. - PMC - PubMed
    1. Association A.D. Classification and diagnosis of diabetes: standards of medical care in Diabetesd2018. Diabetes Care. 2018;41:S13–S27. - PubMed

LinkOut - more resources