

Mechanical dispersion combined with global longitudinal strain estimated by three dimensional speckle tracking in patients with ST elevation myocardial infarction
- PMID: 35434256
- PMCID: PMC9010606
- DOI: 10.1016/j.ijcha.2022.101028
Mechanical dispersion combined with global longitudinal strain estimated by three dimensional speckle tracking in patients with ST elevation myocardial infarction
Abstract
Background: The role of left ventricular (LV) mechanical dispersion estimated after an ST elevation acute myocardial infarction (STEMI) remains unclear.
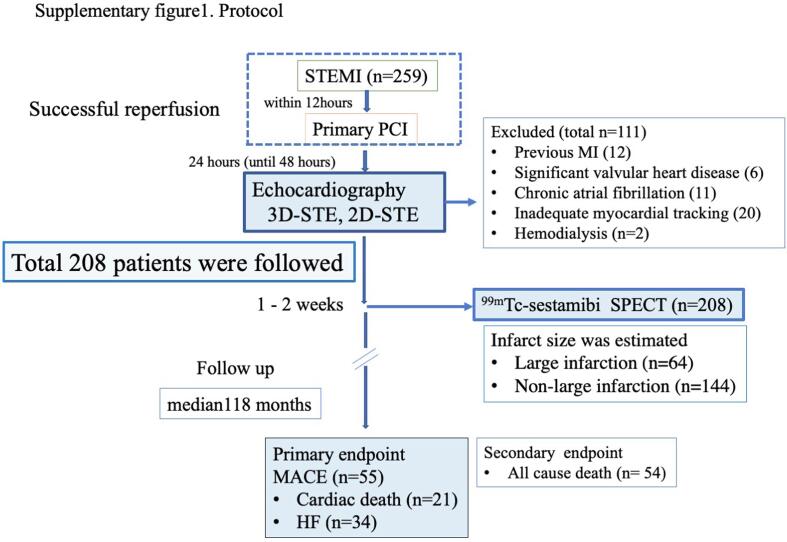
Methods: The study participants were 208 consecutive patients (152 men, age = 72 years) presenting with STEMI for the first time who underwent primary percutaneous coronary intervention (PCI) within 12 h of STEMI onset. Within 48 h of PCI (mean = 24 h), 2D and 3D speckle-tracking echocardiography were performed. The global longitudinal strain (GLS) was calculated using 3D (3D-GLS) and 2D (2D-GLS) speckle tracking. Mechanical dispersion was defined using the standard deviation (SD) of the time to regional peak longitudinal strain (LS) for all 16 segments for both 2D-STE and 3D-STE (2D-LS-SD, 3D-LS-SD). Infarct size was estimated by Tc99m-sestamibi as the total area of < 50% of the uptake area at 2 weeks. The patients were followed up for a longer period of time (median118months) and checked for major adverse cardiac events (MACE: cardiac death, heart failure).
Results: During follow-up, 55 patients experienced MACE. The cut-off values were determined using receiver operating characteristic curves. The multivariate analysis revealed that a 3D-LS-SD > 56.7 ms was a significant predictor of MACEs (hazard ratio = 1.991, 95% confidence interval 1.033-3.613, p = 0.03), but 2D-LS-SD > 58.1 ms was not an independent predictor of MACEs (hazard ratio = 1.577, 95% confidence interval 0.815-3.042, p = 0.1). Furthermore, the combination of 3D-GLS and 3D-LS-SD had accurate predictability for MACE, as shown by the Kaplan-Meier curves (log rank, χ2 = 94.1, p < 0.0001).
Conclusions: LV mechanical dispersion besides 3D-GLS assessed by 3D-STE immediately after PCI can predict long-term prognosis.
Keywords: 2D, two-dimensional; 3D, three-dimensional; AMI, acute myocardial infarction; CI, confidence interval; GLS, global longitudinal strain; HF, heart failure; IQR, interquartile range; LV, left ventricular; Mechanical dispersion; Prognosis; STEMI; STEMI, ST-segment elevation myocardial infarction; Speckle tracking; Three dimensional echocardiography.
© 2022 The Authors.
Conflict of interest statement
The authors declare that they have no known competing financial interests or personal relationships that could have appeared to influence the work reported in this paper.
Figures


References
-
- Shin S.-H., Hung C.-L., Uno H., Hassanein A.H., Verma A., Bourgoun M., Køber L., Ghali J.K., Velazquez E.J., Califf R.M., Pfeffer M.A., Solomon S.D. Mechanical dyssynchrony after myocardial infarction in patients with left ventricular dysfunction, heart failure, or both. Circulation. 2010;121(9):1096–1103. - PubMed
-
- Kosmidou I., Redfors B., Selker H.P., Thiele H., Patel M.R., Udelson J.E., et al. Infarct size, left ventricular function, and prognosis in women compared to men after primary percutaneous coronary intervention in ST-segment elevation myocardial infarction: results from an individual patient-level pooled analysis of 10 randomized trials. Eur. Heart J. 2017;38:1656–1663. - PubMed
-
- Hensen L.C.R., Goossens K., Podlesnikar T., Rotmans J.I., Jukema J.W., Delgado V., et al. Left Ventricular Mechanical Dispersion and Global Longitudinal Strain and Ventricular Arrhythmias in Predialysis and Dialysis Patients. J. Am. Soc. Echocardiog.: Official Publication Am. Soc. Echocardiog. 2018;31:777–783. - PubMed
-
- Sutton M.G.S.J., Sharpe N. Left ventricular remodeling after myocardial infarction: pathophysiology and therapy. Circulation. 2000;101(25):2981–2988. - PubMed
LinkOut - more resources
Full Text Sources
Research Materials
Miscellaneous
