. 2022 Feb 5;7(4):100910.
doi: 10.1016/j.adro.2022.100910. eCollection 2022 Jul-Aug.

Comprehensive Commissioning and Clinical Implementation of GammaTiles STaRT for Intracranial Brain Cancer

Affiliations

Comprehensive Commissioning and Clinical Implementation of GammaTiles STaRT for Intracranial Brain Cancer

Gregory P Penoncello et al. Adv Radiat Oncol. .

Abstract

Purpose: To validate the dose calculation accuracy and dose distribution of GammaTiles for brain tumors, and to suggest a surgically targeted radiation therapy (STaRT) workflow for planning, delivery, radiation safety documentation, and posttreatment validation.

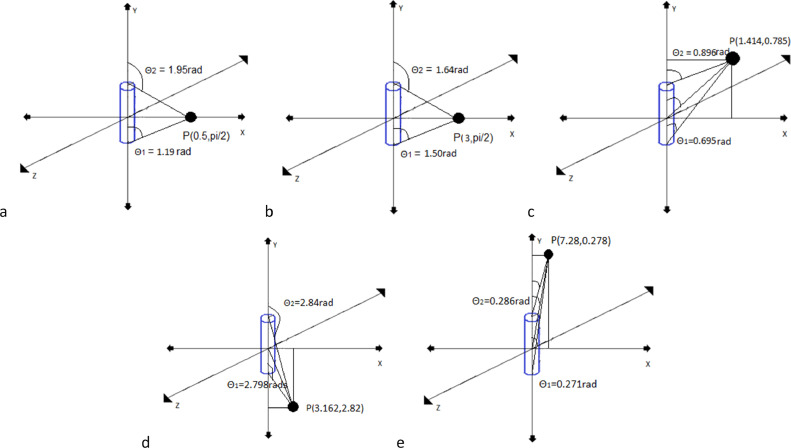
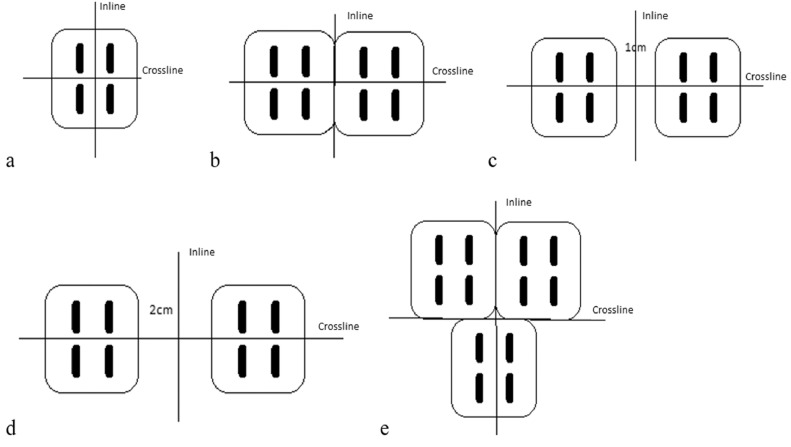
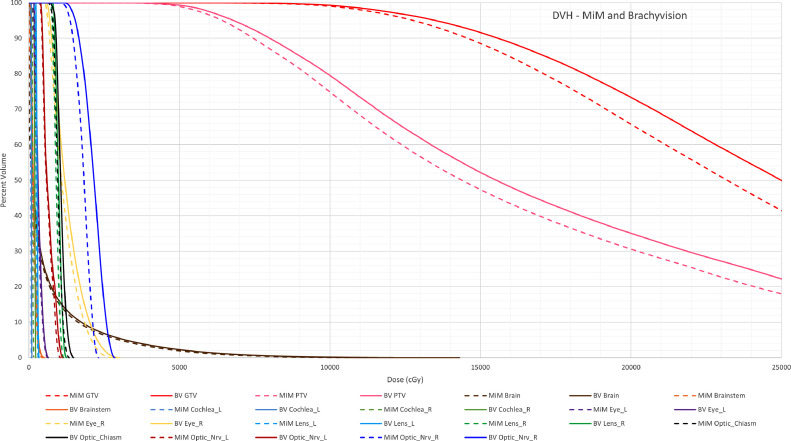
Methods and materials: Novel surgically targeted radiation therapy, GammaTiles, uses Cs-131 radiation isotopes embedded in collagen-based tiles that can be resorbed after surgery. GammaTile target delineation and dose calculation were performed on MIM Symphony software. Point-based and complex seed distribution calculations in MIM Symphony were verified with hand calculations and BrachyVision calculations. Vendor-provided 2-dimensional dose distribution calculation accuracy was validated using gafchromic EBT3 film measurements at various depths. A workflow was established for safe and effective GammaTile implants.

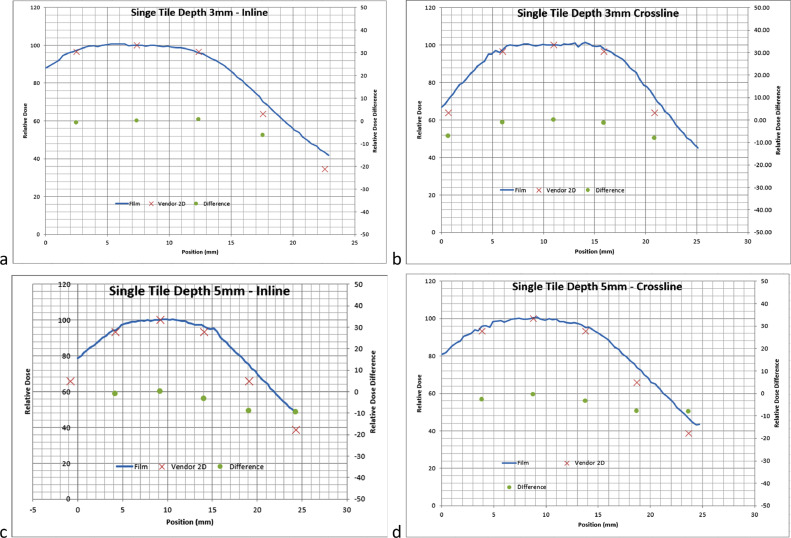
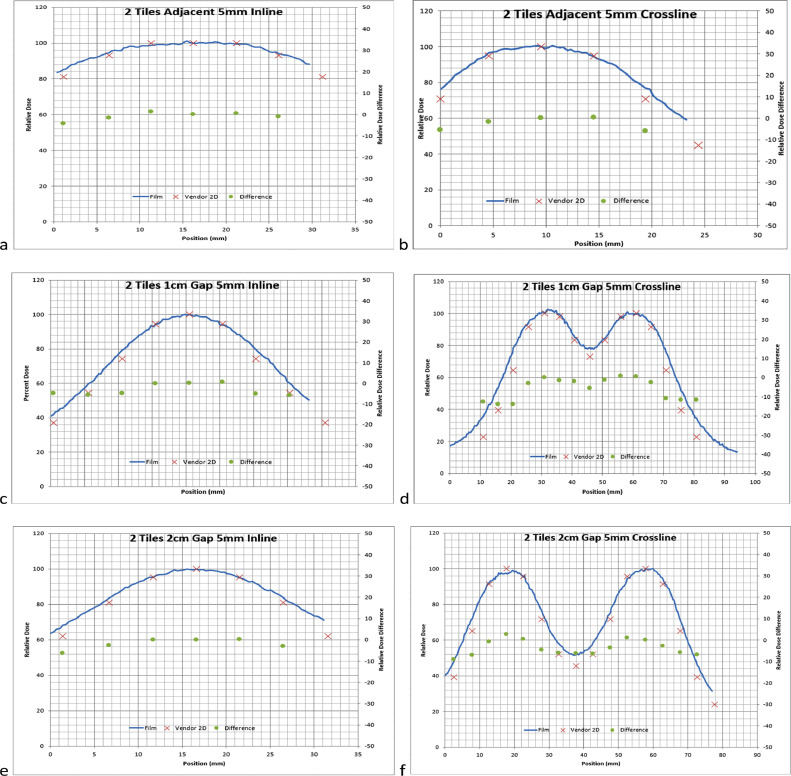
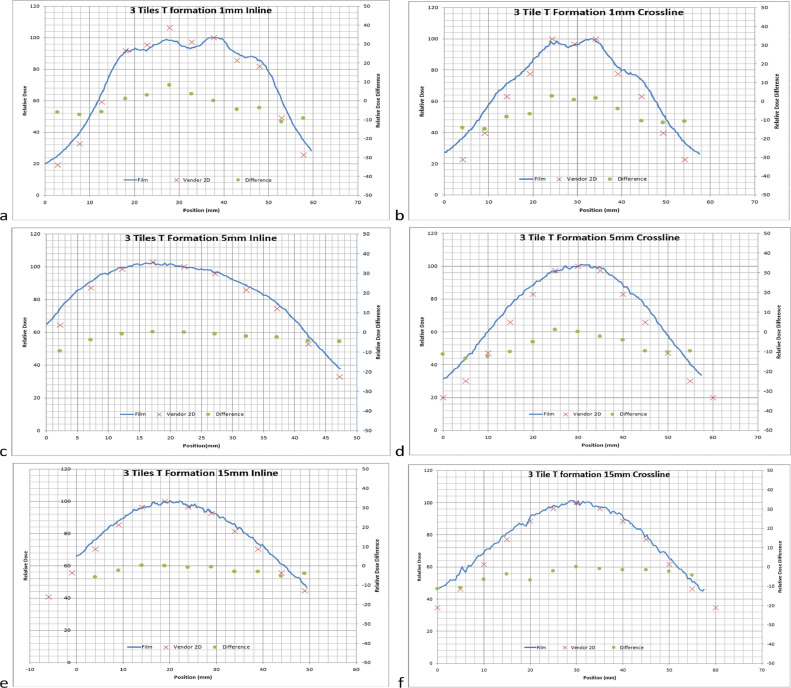
Results: Good agreement was observed between different calculations. Calculation accuracy of less than 0.5% was achieved for all points except one, which had rounding issues for very low doses and resulted in just below 5% difference. Differences in anisotropy and geometry positioning were noticed in the delineation of Cs-131 IsoRay seeds in the compared systems, resulting in minor discrepancies in the calculated dosimetry distributions. Film measurements showed profiles with relatively good agreement of 0% to 5% in nongradient regions with higher differences between 5% to 10% in the sharp dose fall-off regions.

Conclusions: A comprehensive evaluation of GammaTile geometry, dose distribution, and clinical workflow was conducted. Safe intro-operative implantation of GammaTiles requires extensive preplanning and interdisciplinary collaboration. A STaRT workflow was outlined to provide a guideline for an accurate treatment planning and safe implant process at other institutions.


Figures

Fig 1
Fig. 1
Simple geometry, point dose calculation point relative to a single seed. A, Point 1: cartesian: (0.5, 0, 0); polar: (0.5, π/2); B, point 2: cartesian: (3, 0, 0); polar: (3, π/2); C, point 3: cartesian: (1, 1, 0); polar: (1.414, 0.785); D, point 4: cartesian: (3, −1,0); polar: (3.162, 2.82); E, point 5: cartesian: (0.5,4,0); polar: (7.28, 0.278).
Fig 2
Fig. 2
Tile arrangements for film measurements and the corresponding locations (2 crossed lines) of the profiles relative to the tile arrangements. A, single tile; B, 2 adjacent tiles; C, 2 tiles spaced by 1 cm; D, 2 tiles spaced by 2 cm; E, 3 adjacent tiles in a T formation.
Fig 3
Fig. 3
A, 1 Tile profiles at 3 mm in the inline direction. B, 1 Tile profiles at 3 mm in the crossline direction. C, 1Tile profiles at 5 mm in the inline direction. D, 1 Tile profiles at 5 mm in the crossline direction. Solid lines: film profiles, and red Xs: vendor provided profiles (x-axis: position in mm; left y-axis: normalized to the maximum of vendor provided profiles). Green dots: percent difference between film and vendor data, normalized to maximum of vendor provided profiles (right y-axis: percent difference).
Fig 4:
Fig. 4
A, Shows 2 tiles adjacent profiles at 5 mm in the inline direction. B, Shows 2 tiles profiles adjacent at 5 mm in the crossline direction. C, Shows 2 tiles separated by 1-cm profiles at 5 mm in the inline direction. D, Shows 2 tiles profiles separated by 1 cm at 5 mm in the crossline direction. E, Shows 2 tiles separated by 2-cm profiles at 5 mm in the inline direction. F, Shows 2 Tiles profiles separated by 2 cm at 5 mm in the crossline direction. Solid lines: film profiles, and red Xs: vendor provided profiles (x-axis: position in mm; Left y-axis: normalized to the maximum of vendor provided profiles). Green dots: percent difference between film and vendor data, normalized to maximum of vendor provided profiles (right y-axis: percent difference).
Fig 5
Fig. 5
A, Shows 3 tiles in a T formation profiles at 1 mm in the inline direction. B, Shows 3 tiles in a T formation profiles at 1 mm in the crossline direction. C, 3 Tiles in a T formation profiles at 5 mm in the inline direction. D, 3 Tiles in a T formation profiles at 5 mm in the crossline direction. E, 3 tiles in a T formation profiles at 15 mm in the inline direction. F, 3 tiles in a T formation profiles at 15 mm in the crossline direction. Solid lines: film profiles, and red Xs: vendor provided profiles (x-axis: position in mm; left y-axis: normalized to the maximum of vendor provided profiles). Green dots: percent difference between film and vendor data, normalized to maximum of vendor provided profiles (right y-axis: percent difference).
Fig 6
Fig. 6
Dose volume histogram of plans created in MIM and BrachyVision. The dose file and structure set from the MIM plan was imported into BrachyVision to overlay and export to txt file together. Dashed Lines are Structures from the plan generated in MIM, Solid Lines are Structures from the plan generated in BrachyVision. x-axis: dose in cGy; y-axis is percent volume.

References

    1. DeAngelis LM. Brain tumors. N Engl J Med. 2001;344:114–123. - PubMed
    1. Ohgaki H, Kleihues P. The definition of primary and secondary glioblastoma. Clin Cancer Res. 2013;19:764–772. - PubMed
    1. Ostrom QT, Gittleman H, Xu J, et al. CBTRUS statistical report: Primary brain and other central nervous system tumors diagnosed in the United States in 2009-2013. Neuro-Oncol. 2016;18(Suppl 5):v1–v75. - PMC - PubMed
    1. Ali-Reza F, Ulrich R. Meningioma. Curr Neurol Neurosci Rep. 2013;13:337. - PubMed
    1. Wen PY, Black PM, Loeffler JS. In: Cancer: Principles and Practice of Oncology. DeVita V, Hellman S, Rosenberg SA, editors. Lippincott, Williams, & Wilkins; Philadelphia, PA: 2001. Metastatic brain cancer; pp. 2655–2670.

LinkOut - more resources