. 2022 Mar 9;5(4):216-225.
doi: 10.1021/acsptsci.1c00207. eCollection 2022 Apr 8.

Canagliflozin and Dapagliflozin Attenuate Glucolipotoxicity-Induced Oxidative Stress and Apoptosis in Cardiomyocytes via Inhibition of Sodium-Glucose Cotransporter-1

Affiliations

Canagliflozin and Dapagliflozin Attenuate Glucolipotoxicity-Induced Oxidative Stress and Apoptosis in Cardiomyocytes via Inhibition of Sodium-Glucose Cotransporter-1

Deepika Dasari et al. ACS Pharmacol Transl Sci. .

Abstract

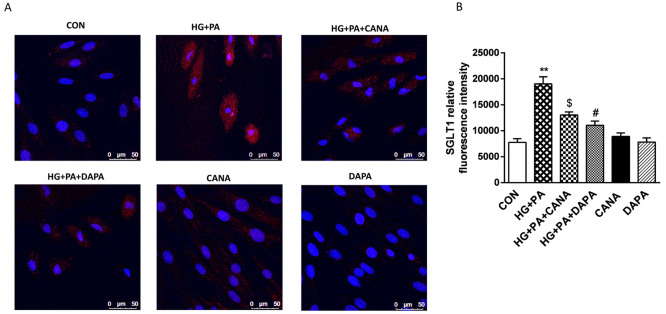
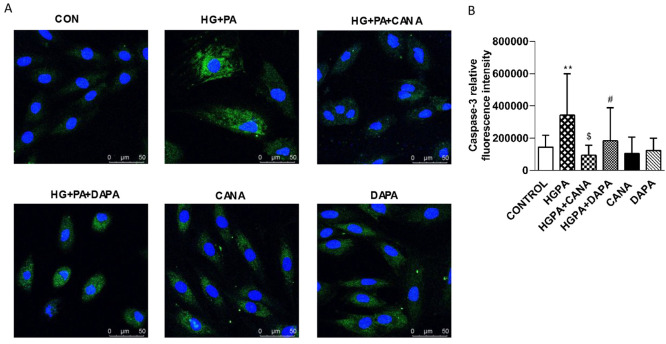
Sodium-dependent glucose cotransporter 2 inhibitors (SGLT2) are recently approved drugs for the treatment of diabetes that regulate blood glucose levels by inhibiting reabsorption of glucose and sodium in the proximal tubules of the kidney. SGLT2 inhibitors have also shown cardiovascular (CV) benefits in diabetic patients. However, the therapeutic efficacy of SGLT2 inhibitors with respect to CV disease needs further investigation. Thus, the aim of the present study was to examine the effects of SGLT2 inhibitors, canagliflozin (CANA) and dapagliflozin (DAPA) in vitro under glucolipotoxic condition by treating cultured cardiomyocytes (H9C2) with high glucose (HG) and high lipid, palmitic acid (PA), to investigate whether inhibition of sodium glucose cotransporter could prevent any harmful effects of glucolipotoxicity in these cells. SGLT1 expression was measured by immunofluorescence staining and quantitative polymerase chain reaction. Oxidative stress and apoptosis were measured by flow cytometry. Hypertrophy was measured by hematoxylin and eosin (H&E) and crystal violet staining. A significant increase in SGLT1 expression was observed in HG- and PA-treated cardiomyocytes. Also, a significant increase in reactive oxygen species generation and apoptosis was observed in HG+PA-treated cultured cardiomyocytes. HG- and PA-treated cardiomyocytes developed significant structural alterations. All these effects of HG and PA were attenuated by CANA and DAPA. In conclusion, our study demonstrates upregulation of SGLT1 induces oxidative stress and apoptosis in cultured cardiomyocytes. Thus, inhibition of SGLT1 may be used as a possible approach for the treatment of CVD in diabetic patients.


Conflict of interest statement

The authors declare no competing financial interest.

Figures

Figure 1
Figure 1
Chemical structures of CANA (a) and DAPA (b).
Figure 2
Figure 2
Concentration-dependent effect of CANA and DAPA on the viability of cultured cardiomyocytes. Cultured rat cardiomyocyte H9C2 cells were incubated with normal culture medium (control, Con) or medium containing high glucose (25 mM) for 24 h. CANA (0.3, 1, 3, 10, and 30 μM) and DAPA (0.3, 1, 3, 10, and 30 μM) were incubated alone or with HG for 24 h. Cytotoxicity (A) and cell viability (B) were measured by the MTT assay kit. n = 5 for each treatment. *, P < 0.05 vs respective control (Con) group.
Figure 3
Figure 3
Time-dependent expression of SGLT1 and SGLT2 in cultured H9C2 cardiomyocytes: Cultured rat H9C2 cardiomyocyte cells were incubated with normal culture medium (control, Con) or medium containing HG (25 mM) or PA (500 μM) (A) for 3, 6, 12, and 24 h. SGLT1 expression was measured by immunofluorescence staining. n = 5 for each treatment. (B) $$, P < 0.01 vs respective control (Con) at 3 h; #, P < 0.05 vs respective control at 6 h; %, P < 0.05 vs respective control at 12 h; *, P < 0.05; **, P < 0.01; ***, P < 0.001 vs respective control at 24 h. Cultured rat H9C2 cardiomyocyte cells were incubated with normal culture medium (control, Con) or medium containing HG (25 mM) and PA (500 μM) (C) for 24, 48, and 72 h. SGLT1 and SGLT2 expression was measured by RT-PCR. n = 5 for each treatment. (C, D) *, P < 0.05 vs respective control (Con); $, P < 0.05; #, P < 0.05 vs respective HG+PA at 24, 48, and 72 h time point.
Figure 4
Figure 4
Glucolipotoxicity induces SGLT1 expression in rat H9C2: Cultured H9C2 cardiomyocytes were treated with HG (25 mM) and PA (500 μM) (A) for 24 h. CANA and DAPA (10 μM) were incubated alone or with HG and PA for 24 h. SGLT1 expression was determined by immunofluorescence staining (A, B). n = 5 for each treatment. **, P < 0.01 vs respective control. $, P < 0.05; #, P < 0.05 vs HG+PA group.
Figure 5
Figure 5
Effect of SGLT1 inhibition on oxidative stress: Cultured H9C2 cardiomyocytes were treated with HG (25 mM) and PA (500 μM) (A, B) for 24 h. CANA, DAPA (10 μM), and NAC (600 μM) were incubated alone or with HG and PA for3 h. ROS production was measured by FACS analysis using DCFDA (A, B), *, P < 0.05 vs respective control. $$, P < 0.01; #,P < 0.05 vs HG+PA group. (C) mRNA expression of catalase was measured in cultured cardiomyocytes incubated with HG+PA along with CANA, DAPA (10 μM) where * denotes P < 0.05 vs respective HG+PA. Data is expressed as the mean ± SD of at least three separate experiments.
Figure 6
Figure 6
SGLT1 inhibition protects glucolipotoxicity induced apoptosis in rat H9C2 cardiomyocytes: Cultured H9C2 cardiomyocytes were treated with HG (25 mM) and PA (500 μM) (A, B) for 24 h. CANA, DAPA (10 μM), and NAC (600 μM) were incubated alone or with HG and PA for 24 h. Apoptosis was measured by FACS analysis using Annexin-IV assay kit (A, B). n = 4 for each group. **, P < 0.01; $, P < 0.05; #, P < 0.05; %, P < 0.05 vs respective control (Con). +++, P < 0.001; +2, P < 0.01; +, P < 0.05; @, P < 0.05 vs HG+PA group.
Figure 7
Figure 7
SGLT1 inhibition protects glucolipotoxicity induced apoptosis in rat H9C2 cardiomyocytes: Cultured H9C2 cardiomyocytes were treated with HG (25 mM) and PA (500 μM) (A, B) for 24 h. CANA and DAPA (10 μM) were incubated alone or with HG and PA for 24 h. Caspase-3 expression was determined by immunofluorescence staining (A,B). **, P < 0.01 vs respective control; $, P < 0.05; #, P < 0.05 vs HG+PA group. Data is expressed as mean ± SD of at least three separate experiments.
Figure 8
Figure 8
SGLT1 inhibition protects glucolipotoxicity-induced structural changes in rat H9C2 cardiomyocytes: Hematoxylin and eosin and crystal violet staining was performed for assessment of cellular hypertrophy. Cellular hypertrophy/growth has been observed in cultured cardiomyocytes incubated with HG and PA for 24 h. Both CANA and DAPA (A, B) were able to reverse the structural changes induced by HG and PA (A, B).
Figure 9
Figure 9
Effect of SGLT1 inhibition on glucose uptake: Cultured H9C2 cardiomyocytes were treated with HG (25 mM) and PA (500 μM) (A, B) for 24 h. Cells were stimulated with insulin (100 nM) for 10 min. CANA and DAPA (10 μM) were incubated alone or with HG and PA for 24 h. Glucose uptake was measured by immunofluorescence staining. (A, B) **, P < 0.05 vs respective control. $, P < 0.05; #, P < 0.05 vs HG+PA group. Data is expressed as mean ± SD of at least three separate experiments.

Similar articles

Cited by

References

    1. Wang J.; Song Y.; Wang Q.; Kralik P. M.; Epstein P. N. Causes and characteristics of diabetic cardiomyopathy. Review of Diabetic Studies. 2006, 3 (3), 108.10.1900/RDS.2006.3.108. - DOI - PMC - PubMed
    1. Kalra J.; Mangali S. B.; Dasari D.; Bhat A.; Goyal S.; Dhar I.; Sriram D.; Dhar A. SGLT1 inhibition boon or bane for diabetes-associated cardiomyopathy. Fundam. Clin. Pharmacol. 2020, 34 (2), 173–88. 10.1111/fcp.12516. - DOI - PubMed
    1. Marsh S. A.; Dell'Italia L. J.; Chatham J. C. Interaction of diet and diabetes on cardiovascular function in rats. Am. J. Physiol.: Heart Circ. Physiol. 2009, 296 (2), H282–H292. 10.1152/ajpheart.00421.2008. - DOI - PMC - PubMed
    1. GH R. P.; Goff D. C. Jr.; Bigger J. T.; Buse J. B.; Cushman W. C.; Genuth S.; Ismail-Beigi F.; Grimm R. H. Jr; Probstfield J. L.; Simons-Morton D. G.; Friedewald W. T. Effects of intensive glucose lowering in type 2 diabetes. N. Engl. J. Med. 2008, 358 (24), 2545–2559. 10.1056/NEJMoa0802743. - DOI - PMC - PubMed
    1. Duckworth W.; Abraira C.; Moritz T.; Reda D.; Emanuele N.; Reaven P. D.; Zieve F. J.; Marks J.; Davis S. N.; Hayward R.; et al. Glucose control and vascular complications in veterans with type 2 diabetes. N. Engl. J. Med. 2009, 360 (2), 129–139. 10.1056/NEJMoa0808431. - DOI - PubMed

LinkOut - more resources