. 2022 Jul;14(4):e1796.
doi: 10.1002/wnan.1796. Epub 2022 Apr 17.

A multimodal nanoparticles-based theranostic method and system

Affiliations

A multimodal nanoparticles-based theranostic method and system

Israel Gannot. Wiley Interdiscip Rev Nanomed Nanobiotechnol. 2022 Jul.

Abstract

We propose a nanoparticles-based system for the early detection of tumors, treatment under real-time feedback, and monitoring. The building blocks of the system comprise a few modalities that are integrated into one powerful system which can operate at the patient's bedside in an outpatient clinic setting. The method relies on the unique characteristics of superparamagnetic nanoparticles. It takes advantage of their ability to produce acoustical signals under alternating magnetic fields (AMFs) and to produce heat under these same AMFs with different parameters. It utilizes the nanoparticles' coating for specific binding. The manuscript describes the various parts of this method for localization, source separation, confined heat elevation, triggering of cell death, and monitoring the response to treatment through fluorescence signaling. The entire system continues to evolve into a minimally invasive trans-endoscopic set-up. This article is categorized under: Diagnostic Tools > In Vivo Nanodiagnostics and Imaging Therapeutic Approaches and Drug Discovery > Nanomedicine for Oncologic Disease.

Keywords: fluorescence; magneto-acoustics; nano-particles; theranostic; thermal imaging.


Conflict of interest statement

The author has declared no conflicts of interest for this article.

Figures

FIGURE 1
FIGURE 1
The two types of relaxation losses: (a) the Neel mode losses (magnetization rotate in core) and (b) the Brownian mode losses (entire nanoparticle rotates in tissue)
FIGURE 2
FIGURE 2
(a) System schematic diagram. (b) Picture of the set‐up in the lab
FIGURE 3
FIGURE 3
Schematic illustration of the main stages of the detection algorithm
FIGURE 4
FIGURE 4
A block diagram description of the full magnetoacoustic model
FIGURE 5
FIGURE 5
A schematic description of the whole acoustic setup. The DC PSU supplies power to the modulator circuit. The modulator drives both solenoids with inverse square waves. An acoustic bath with an MNP‐conjugated tumor phantom is placed between the solenoids. Under the influence of the magnetic field, the tumor vibrates and sends pressure waves. An acoustic sensor picks the pressure waves and sends the signal to the amplifier. The oscilloscope is used for sampling the acoustic signal and the shape of the square current wave from the modulator. DC PSU, DC power Supply; MNP, magnetic nanoparticle
FIGURE 6
FIGURE 6
Acoustical signal for tumor at depths (from top to bottom) of 3, 2, and 1 cm. These peaks correspond to the upward or downward acceleration of the tumor. Small fluctuations can be attributed to the finite number of frequencies (100) that were considered in the model
FIGURE 7
FIGURE 7
Object localization using triangulation. Two sensors are positioned along a triangle basis and the object at the third vertex. The object's 3D location is encoded within the α and β angles
FIGURE 8
FIGURE 8
Object localization using trilateration. The two‐dimensional location of the object can be calculated using the location of three sensors (circle's centers) and their radii
FIGURE 9
FIGURE 9
A three‐step algorithm for acoustic source localization. For illustration only, the sensor array is located around a hemisphere. First, the time delay between each pair of sensors is calculated (gray integral marks that symbolize the cross‐correlation technique). Then, these time delays generate a set of nonlinear equations for which their solution is the source location. In the final step, a numerical algorithm is used to provide the source location estimation
FIGURE 10
FIGURE 10
Tumor localization's results for one specific case. The simulated location is marked with a red cross. The algorithm's estimation is given with a purple circle
FIGURE 11
FIGURE 11
The experimental setup used in the magneto‐acoustic experiment. On the right is a sketch of the system, presenting the sensor array along with the two solenoids and the tissue phantom. On the left is a picture of the actual system containing the tumor phantom within the hemisphere tissue phantom
FIGURE 12
FIGURE 12
The extracted acoustic signal (blue line) gathered by the reduction of the electromagnetic noise from the actual signal. The red line represents the current trigger and highlights the connection between the excitation to the MNP's response. MNP, magnetic nanoparticle
FIGURE 13
FIGURE 13
Localization results. The acoustic source and its location estimation are marked by the red and purple circles, respectively
FIGURE 14
FIGURE 14
Front cover: IEEE Transactions on Biomedical Engineering, Vol. 61, Issue 8, August 2014
FIGURE 15
FIGURE 15
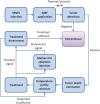
A basic procedure concept of the multimodal system for detection, treatment and treatment monitoring of cancer
FIGURE 16
FIGURE 16
Surface thermal response to an AC‐stimulated source at different depths. Presented are the different depths and frequency combinations for the DC (constant RF excitation amplitude) and AC (amplitude‐modulated RF excitation amplitude) components. A cross‐section (marked in a dashed white line) through both components is also plotted (a–c: 3 mm and 0.1 Hz; d–f: 5 mm and 0.04 Hz; g–i: 7 mm and 0.033 Hz). RF, radio frequency
FIGURE 17
FIGURE 17
Fully integrated system with four modalities. RF generator located around the organ of interest for nanoparticle excitation, acoustic sensors array for localization thermal camera for capturing temperature map on the surface, and a fluorescence camera to detect the apoptosis sensing markers. RF, radio frequency
FIGURE 18
FIGURE 18
A coherent bundle composed from 900 individual hollow waveguides, internally coated with silver and silver iodide layers, optimized to deliver energy in the mid‐infrared spectral range to enable thermal image capture
FIGURE 19
FIGURE 19
Trans endoscopic theranostic system for procedures within body cavities. 1, endoscope; 2, endoscope distal end; 3, annular optical aperture; 4, thermal imaging bundle (see Figure 18); 5, RF applicator; 6, acoustical sensor (with inflatable balloon to ensure sensor touches the esophagus); 7, nanoparticles on the inner lining of the esophagus

References

    1. Anderson, R. , & Parrish, J. (1981). The optics of human skin. Journal of Investigative Dermatology, 77(1), 13–19. - PubMed
    1. Andrä W, Nowak H. (2007) Magnetism in medicine: A handbook. Wiley‐VCH Verlag GmbH & Co. 10.1002/9783527610174 - DOI
    1. Becker, W. (2019). The Bh TCSPC handbook (8th ed.). Becker and Hickl. http://www.becker-hickl.de/handbook.htm
    1. Bulte, J. W. M. , & Kraitchman, D. L. (2004). Iron oxide MR contrast agents for molecular and cellular imaging. NMR in Biomedicine, 17, 484–499. 10.1002/nbm.924 - DOI - PubMed
    1. Cohen, R., Lide, D., & Trigg, G. (2003). AIP Physics Desk Reference. Springer.

LinkOut - more resources