. 2022 Aug 24;75(1):e1-e9.
doi: 10.1093/cid/ciac278.

Severe Acute Respiratory Syndrome Coronavirus 2 (SARS-CoV-2)-Specific T Cells and Antibodies in Coronavirus Disease 2019 (COVID-19) Protection: A Prospective Study

Ivan A Molodtsov  1 Evgenii Kegeles  2 Alexander N Mitin  3 Olga Mityaeva  2 Oksana E Musatova  4 Anna E Panova  5 Mikhail V Pashenkov  3 Iuliia O Peshkova  6 Almaqdad Alsalloum  2 Walaa Asaad  2 Anna S Budikhina  3 Alexander S Deryabin  4 Inna V Dolzhikova  7 Ioanna N Filimonova  4 Alexandra N Gracheva  5 Oxana I Ivanova  1   8 Anastasia Kizilova  2 Viktoria V Komogorova  3 Anastasia Komova  2   9 Natalia I Kompantseva  5 Ekaterina Kucheryavykh  10 Denis А Lagutkin  5 Yakov A Lomakin  4 Alexandra V Maleeva  6 Elena V Maryukhnich  1   8 Afraa Mohammad  2 Vladimir V Murugin  3 Nina E Murugina  3 Anna Navoikova  2 Margarita F Nikonova  3 Leyla A Ovchinnikova  4 Yana Panarina  10 Natalia V Pinegina  1   8 Daria M Potashnikova  1   8 Elizaveta V Romanova  1 Aleena A Saidova  1 Nawar Sakr  2 Anastasia G Samoilova  5 Yana Serdyuk  6 Naina T Shakirova  6 Nina I Sharova  3 Saveliy A Sheetikov  6 Anastasia F Shemetova  5 Liudmila V Shevkova  2   9 Alexander V Shpektor  1   8 Anna Trufanova  2 Anna V Tvorogova  1 Valeria M Ukrainskaya  4 Anatoliy S Vinokurov  5 Daria A Vorobyeva  1   8 Ksenia V Zornikova  6 Grigory A Efimov  6 Musa R Khaitov  3   11 Ilya A Kofiadi  3   11 Alexey A Komissarov  1   8 Denis Y Logunov  7 Nelli B Naigovzina  8 Yury P Rubtsov  4 Irina A Vasilyeva  5 Pavel Volchkov  2   9 Elena Vasilieva  1   8
Affiliations

Severe Acute Respiratory Syndrome Coronavirus 2 (SARS-CoV-2)-Specific T Cells and Antibodies in Coronavirus Disease 2019 (COVID-19) Protection: A Prospective Study

Ivan A Molodtsov et al. Clin Infect Dis. .

Abstract

Background: During the ongoing coronavirus disease 2019 (COVID-19) pandemic, many individuals were infected with and have cleared the virus, developing virus-specific antibodies and effector/memory T cells. An important unanswered question is what levels of T-cell and antibody responses are sufficient to protect from the infection.

Methods: In 5340 Moscow residents, we evaluated anti-severe acute respiratory syndrome coronavirus 2 (SARS-CoV-2) immunoglobulin M (IgM)/immunoglobulin G (IgG) titers and frequencies of the T cells specific to the membrane, nucleocapsid, and spike proteins of SARS-CoV-2, using interferon gamma (IFN-γ) enzyme-linked immunosorbent spot (ELISpot) assay. Additionally, we evaluated the fractions of virus-specific CD4+ and CD8+ T cells using intracellular staining of IFN-γ and interleukin 2 followed by flow cytometry. We analyzed the COVID-19 rates as a function of the assessed antibody and T-cell responses, using the Kaplan-Meier estimator method, for up to 300 days postinclusion.

Results: We showed that T-cell and antibody responses are closely interconnected and are commonly induced concurrently. Magnitudes of both responses inversely correlated with infection probability. Individuals positive for both responses demonstrated the highest levels of protectivity against the SARS-CoV-2 infection. A comparable level of protection was found in individuals with antibody response only, whereas the T-cell response by itself granted only intermediate protection.

Conclusions: We found that the contribution of the virus-specific antibodies to protection against SARS-CoV-2 infection is more pronounced than that of the T cells. The data on the virus-specific IgG titers may be instructive for making decisions in personalized healthcare and public anti-COVID-19 policies. Clinical Trials Registration. NCT04898140.

Keywords: COVID-19; SARS-CoV-2; T cells; immune response; protective effect.


Conflict of interest statement

Conflicts of interest. The authors declare no competing interests. All authors have submitted the ICMJE Form for Disclosure of Potential Conflicts of Interest.

Figures

Figure 1.
Figure 1.
Study overview and experimental cohort description. (A), Schematic study design. We tested volunteers for severe acute respiratory syndrome coronavirus 2–specific antibodies (blue circle) and virus-specific T cells using interferon-γ enzyme-linked immunosorbent spot (ELISpot) assay (pink circle) and flow cytometry with intracellular staining (green circle) (Figure was created using Biorender.com). (B), Age and sex distribution of volunteers included in the study. (C), Coronavirus disease 2019 (COVID-19) status of volunteers included in the study according to the Moscow State COVID-19 registry provided by the Moscow Department of Healthcare. (D), COVID-19 cases among study participants per week from April 2020 to August 2021.
Figure 2.
Figure 2.
Evaluation of coronavirus disease 2019 (COVID-19)–specific antibody immunity. (A), Percentages of patients positive for virus-specific immunoglobulin M (IgM) and immunoglobulin G (IgG). (B), Venn diagram showing the number of participants positive for severe acute respiratory syndrome coronavirus 2–specific IgG (green), IgM (red), and both antibody types (orange). (C) and (D), Time dependence of the IgM and IgG levels among a subgroup of 854 nonvaccinated participants who had previous polymerase chain reaction–confirmed coronavirus disease 2019 (COVID-19). Each dot represents a single patient. Time is counted from the date of disease onset according to the Moscow State COVID-19 registry to the day of inclusion in the study. Time interval presented in each boxplot is 30 days. Abbreviation: COI, cutoff index.
Figure 3.
Figure 3.
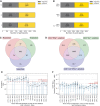
Evaluation of coronavirus disease 2019 (COVID-19)–specific T-cell immunity. Freshly isolated peripheral blood mononuclear cells (PBMCs) were stimulated with peptide pools covering severe acute respiratory syndrome coronavirus 2 (SARS-CoV-2) proteins, and cytokine responses were assessed with enzyme-linked immunosorbent spot (ELISpot) assay or flow cytometry. The percentages of patients exceeding the positivity threshold for M, N, and S proteins in the ELISpot assay (A) or exceeding the percentage of cells expressing both interleukin 2 (IL-2) and interferon gamma (IFN-γ), or either of these cytokines, in the flow cytometry assay (B) are shown. Venn diagrams showing relation in positivity between different SARS-CoV-2 proteins in the ELISpot assay (C) or between expression of different cytokines in response to activation with SARS-CoV-2 proteins in the flow cytometry assay (D). The time dependence of the spot-forming units (SFU) per 106 PBMC for S protein in the ELISpot assay is shown in (E) and that of the fraction of CD4+ T cells expressing IL-2 out of total CD4+ cells in the flow cytometry assay is shown in (F). Each dot represents a single participant. Time is counted from the date of disease onset according to the Moscow State COVID-19 registry to the day of inclusion in the study, and thus serology testing. Time interval presented in each boxplot is 30 days. The dashed line represents a positivity threshold for ELISpot. For flow cytometry, the positivity threshold was variable (see Supplementary Material 2).
Figure 4.
Figure 4.
Evaluation of the effects of antibody and T-cell immune responses on coronavirus disease 2019 (COVID-19) infection rates. The patients were split into 5 nearly equal groups by quantiles of immunoglobulin G (IgG) levels (A, top) or by S protein–specific spot-forming units estimated from enzyme-linked immunosorbent spot (ELISpot) assay (B, top) from quartile (Q) 1 to Q5. Additionally, participants were split into 4 groups (C, top): positive only by antibodies (A+T), positive only by S protein–specific T cells estimated from ELISpot (AT+), double-positive (A+T+), and double-negative (AT). Corresponding Kaplan–Meier curves were generated for each group, and COVID-19 rates were analyzed. AC (bottom), Age-adjusted Cox proportional hazard models were fitted (with age measured in decades for ease of representation) and hazard ratios in comparison with either Q1 or the AT group were calculated together with the model concordance index (c-index). ✢, decades were used as units for age measurements. *p < 0.05; **p < 0.01; ***p < 0.001; ****p < 0.0001. Abbreviations: CI, confidence interval; HR, hazard ratio; IgG, immunoglobulin G; PBMC, peripheral blood mononuclear cells; Q, quartile; SFU, spot-forming units.

References

    1. Le Bert N, Tan AT, Kunasegaran K, et al. SARS-CoV-2-specific T cell immunity in cases of COVID-19 and SARS, and uninfected controls. Nature 2020; 584:457–62. - PubMed
    1. Weiskopf D, Schmitz KS, Raadsen MP, et al. Phenotype and kinetics of SARS-CoV-2-specific T cells in COVID-19 patients with acute respiratory distress syndrome. Sci Immunol 2020; 5:eabd2071. - PMC - PubMed
    1. Payne RP, Longet S, Austin JA, et al. Immunogenicity of standard and extended dosing intervals of BNT162b2 mRNA vaccine. Cell 2021; 184:5699–714.e11. - PMC - PubMed
    1. Chi X, Yan R, Zhang J, et al. A neutralizing human antibody binds to the N-terminal domain of the spike protein of SARS-CoV-2. Science 2020; 369:650–5. - PMC - PubMed
    1. Lu S, Xie XX, Zhao L, et al. The immunodominant and neutralization linear epitopes for SARS-CoV-2. Cell Rep 2021; 34:108666. - PMC - PubMed

Publication types

Associated data