. 2022 Sep;49(11):3917-3928.
doi: 10.1007/s00259-022-05787-9. Epub 2022 Apr 18.

Infiltrative growth pattern of prostate cancer is associated with lower uptake on PSMA PET and reduced diffusion restriction on mpMRI

Affiliations

Infiltrative growth pattern of prostate cancer is associated with lower uptake on PSMA PET and reduced diffusion restriction on mpMRI

Riccardo Laudicella et al. Eur J Nucl Med Mol Imaging. 2022 Sep.

Abstract

Purpose: Recently, a significant association was shown between novel growth patterns on histopathology of prostate cancer (PCa) and prostate-specific membrane antigen (PSMA) uptake on [68Ga]PSMA-PET. It is the aim of this study to evaluate the association between these growth patterns and ADC (mm2/1000 s) values in comparison to [68Ga]PSMA uptake on PET/MRI.

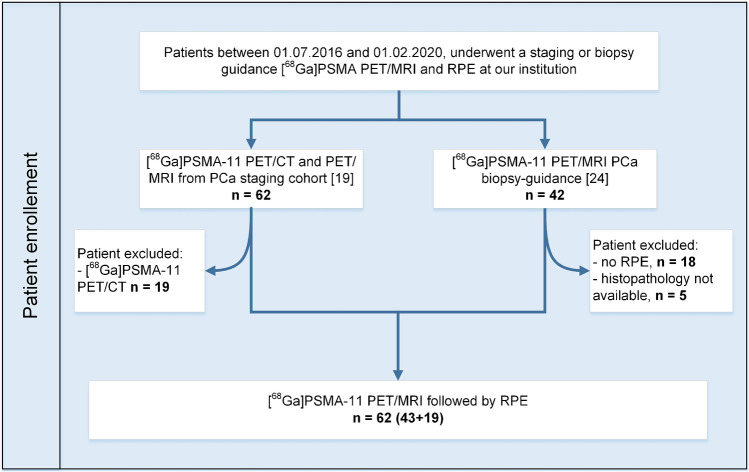
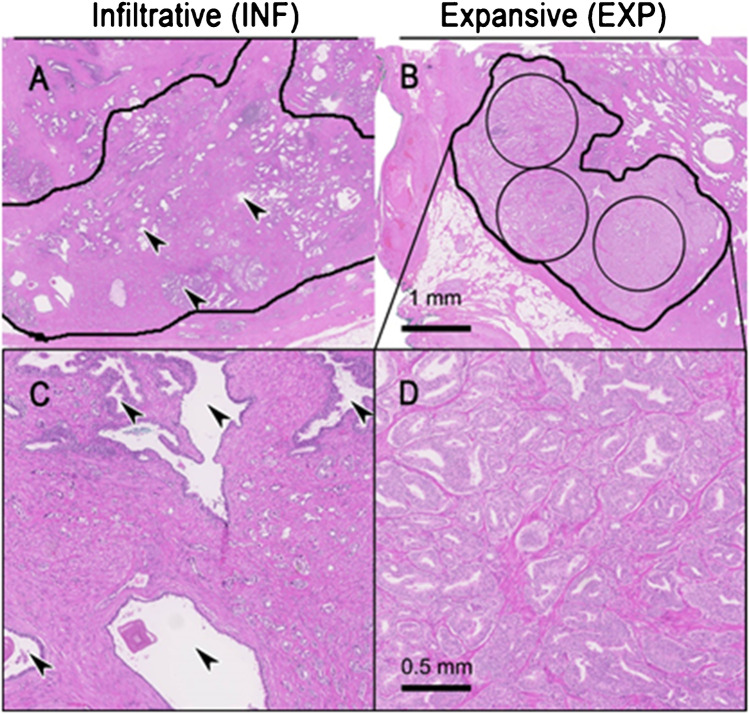
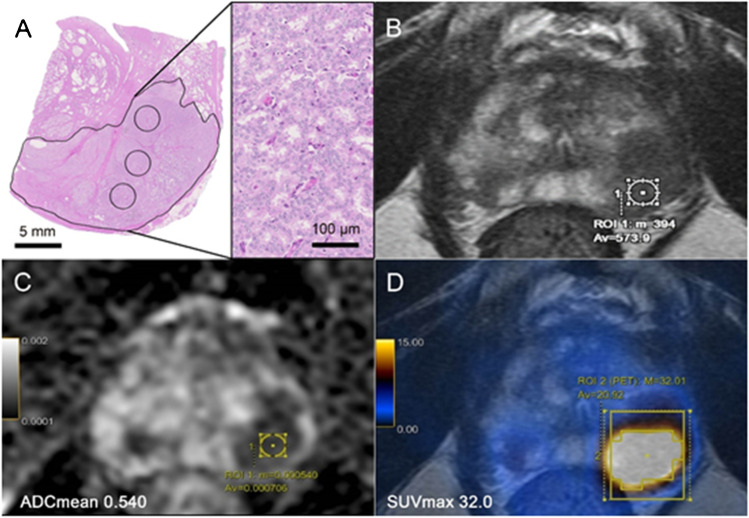
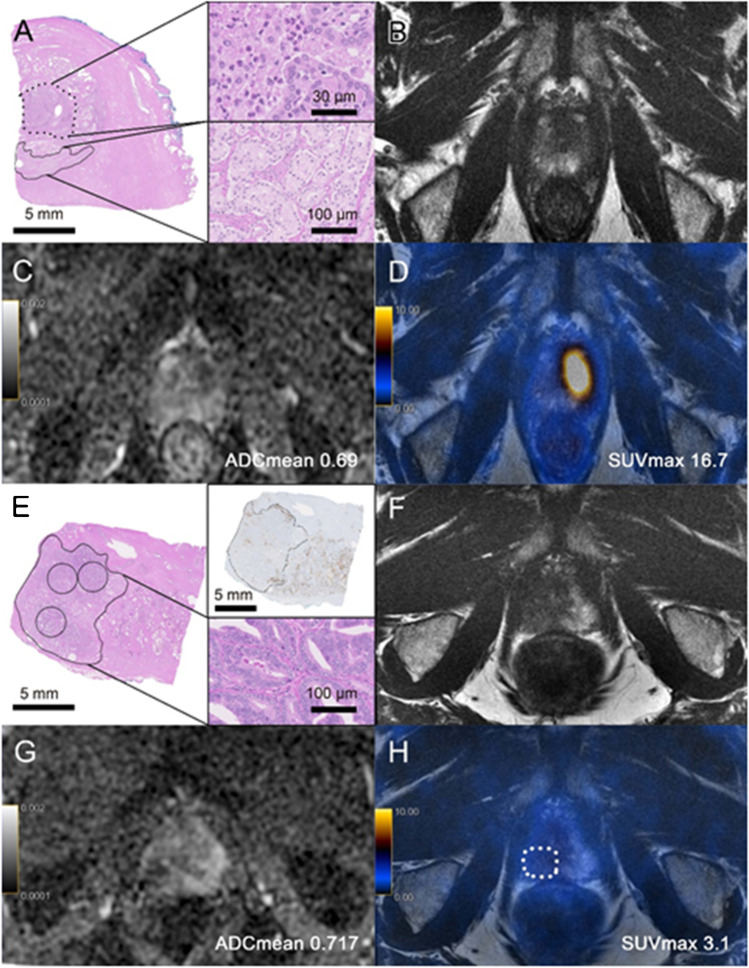
Methods: We retrospectively evaluated patients who underwent [68Ga]PSMA PET/MRI for staging or biopsy guidance, followed by radical prostatectomy at our institution between 07/2016 and 01/2020. The dominant lesion per patient was selected based on histopathology and correlated to PET/MRI in a multidisciplinary meeting, and quantified using SUVmax for PSMA uptake and ADCmean for diffusion restriction. PCa growth pattern was classified as expansive (EXP) or infiltrative (INF) according to its properties of forming a tumoral mass or infiltrating diffusely between benign glands by two independent pathologists. Furthermore, the corresponding WHO2016 ISUP tumor grade was evaluated. The t test was used to compare means, Pearson's test for categorical correlation, Cohen's kappa test for interrater agreement, and ROC curve to determine the best cutoff.

Results: Sixty-two patients were included (mean PSA 11.7 ± 12.5). The interrater agreement between both pathologists was almost perfect with κ = 0.81. While 25 lesions had an EXP-growth with an ADCmean of 0.777 ± 0.109, 37 showed an INF-growth with a significantly higher ADCmean of 1.079 ± 0.262 (p < 0.001). We also observed a significant difference regarding PSMA SUVmax for the EXP-growth (19.2 ± 10.9) versus the INF-growth (9.4 ± 6.2, p < 0.001). Within the lesions encompassing the EXP- or the INF-growth, no significant correlation between the ISUP groups and ADCmean could be observed (p = 0.982 and p = 0.861, respectively).

Conclusion: PCa with INF-growth showed significantly lower SUVmax and higher ADCmean values compared to PCa with EXP-growth. Within the growth groups, ADCmean values were independent from ISUP grading.

Keywords: Diffusion-weighted imaging; MRI; PSMA PET/MRI; Prostate cancer; Radical prostatectomy.


Conflict of interest statement

The authors declare no competing interests.

Figures

Fig. 1
Fig. 1
Patients’ selection and inclusion in the study
Fig. 2
Fig. 2
Examples of different growth patterns. A, C Example of infiltrative growth pattern (INF) defined by prostate carcinoma (circled) growing between benign glands (arrowheads). B, D Expansive growth pattern (EXP), which homogenously comprises tumor glands containing at least 3 circles of 5 mm2 (radius 1.26 mm). A, B Scale bar 1 mm. C, D Scale bar 0.5 mm
Fig. 3
Fig. 3
Region of interest (ROI) selection. Example of a 74-year-old patient with PSA of 20 ng/ml. Subsequently, he underwent radical prostatectomy (GS = 4 + 4, ISUP 4). A Histopathology slide showing an expansive growth pattern of the “dominant lesion’’ on the left posterior part of the prostatic peripheral zone. B Corresponding axial T2-weighted MRI showing a large hypointense area. C Axial ADC MRI with low ADCmean values = 0.540. D axial [68Ga]PSMA PET/MRI with high PSMA-uptake (SUVmax of 32.0)
Fig. 4
Fig. 4
A Bar graphs for patients’ distribution according to RPE ISUP grade and growth pattern and box plot illustrations. B RPE ISUP distribution and C the maximum tumor diameter on histopathology according to growth-pattern. D Illustration of the distribution of PCa subtypes divided into either acinar or mixed (including combinations of acinar, ductal, intraductal and/or cribriform) according to growth pattern and E ISUP on histopathology
Fig. 5
Fig. 5
Box plots illustrating the relationship between imaging parameters and RPE ISUP grade. A PSMA SUVmax had a positive correlation to ISUP (r = 0.508, p < 0.001). B ADCmean a negative trend in correlation to ISUP (r =  − 0.192, p = 0.135) for all lesions. C A significant positive correlation for SUVmax with ISUP was confirmed for EXP growth (r = 0.415, p = 0.039) but not for INF growth (r = 0.284, p = 0.088). D For subdivided growth patterns, the ADCmean had no correlation to ISUP (p = 0.861 for EXP, and p = 0.982 for INF)
Fig. 6
Fig. 6
Two cases without correspondence between growth pattern and imaging parameters. AD A 62-year-old patient with PSA of 12.7 ng/ml, GS = 4 + 3 (ISUP 3). A Histopathology slide showing an infiltrative growth pattern of the “dominant lesion’’ (continuous circle, detail on the right lower right side) on the anterior left part of the prostate apex with a maximum diameter of 8.3 mm; next to the carcinomatous lesion, acute inflammation (dotted circle, detail on the upper right side) can be found. B Corresponding axial T2-weighted MRI with a hypointense area. C On ADC map, the lesion had a low ADCmean of 0.69. D On axial [68Ga]PSMA PET/MRI, the lesion showed high PSMA-uptake (SUVmax = 16.7). In direct correlation of imaging and histopathology, the acute inflammation was probably responsible for the low ADC value and high PSMA uptake. EH A 60-year-old patient with PSA of 1.3 ng/ml, GS = 4 + 3 (ISUP 3). E Histopathology slide showing an expansive growth pattern of the large “dominant lesion’’ on the posterior right part of the prostate apex with a maximum diameter of 17.3 mm. F Corresponding axial T2-weighted MRI with a hypointense area. G On ADC map, the lesion had a low ADCmean of 0.717. H On [68Ga]PSMA PET/MRI, the lesion showed low PSMA-uptake (SUVmax = 3.1)

References

    1. Siegel RL, Miller KD, Jemal A. Cancer statistics, 2020. CA Cancer J Clin. 2020;70:7–30. doi: 10.3322/caac.21590. - DOI - PubMed
    1. Schoots IG, Roobol MJ, Nieboer D, Bangma CH, Steyerberg EW, Hunink MG. Magnetic resonance imaging-targeted biopsy may enhance the diagnostic accuracy of significant prostate cancer detection compared to standard transrectal ultrasound-guided biopsy: a systematic review and meta-analysis. Eur Urol. 2015;68:438–450. doi: 10.1016/j.eururo.2014.11.037. - DOI - PubMed
    1. Moore CM, Kasivisvanathan V, Eggener S, et al. START Consortium. Standards of reporting for MRI-targeted biopsy studies (START) of the prostate: recommendations from an International Working Group. Eur Urol. 2013;64:544–52. doi: 10.1016/j.eururo.2013.03.030. - DOI - PubMed
    1. Mottet N, van den Bergh RCN, Briers E, et al. EAU-EANM-ESTRO-ESUR-SIOG Guidelines on prostate cancer-2020 update. Part 1: screening, diagnosis, and local treatment with curative intent. Eur Urol. 2021;79:243–262. doi: 10.1016/j.eururo.2020.09.042. - DOI - PubMed
    1. Turkbey B, Rosenkrantz AB, Haider MA, et al. Prostate imaging reporting and data system version 2.1: 2019 update of prostate imaging reporting and data system version 2. Eur Urol. 2019;76:340–351. - PubMed

MeSH terms

Substances