

Experimental colonization with Blastocystis ST4 is associated with protective immune responses and modulation of gut microbiome in a DSS-induced colitis mouse model
- PMID: 35435504
- PMCID: PMC9016058
- DOI: 10.1007/s00018-022-04271-9
Experimental colonization with Blastocystis ST4 is associated with protective immune responses and modulation of gut microbiome in a DSS-induced colitis mouse model
Abstract
Background: Blastocystis is a common gut protistan parasite in humans and animals worldwide, but its interrelationship with the host gut microbiota and mucosal immune responses remains poorly understood. Different murine models of Blastocystis colonization were used to examine the effect of a common Blastocystis subtype (ST4) on host gut microbial community and adaptive immune system.
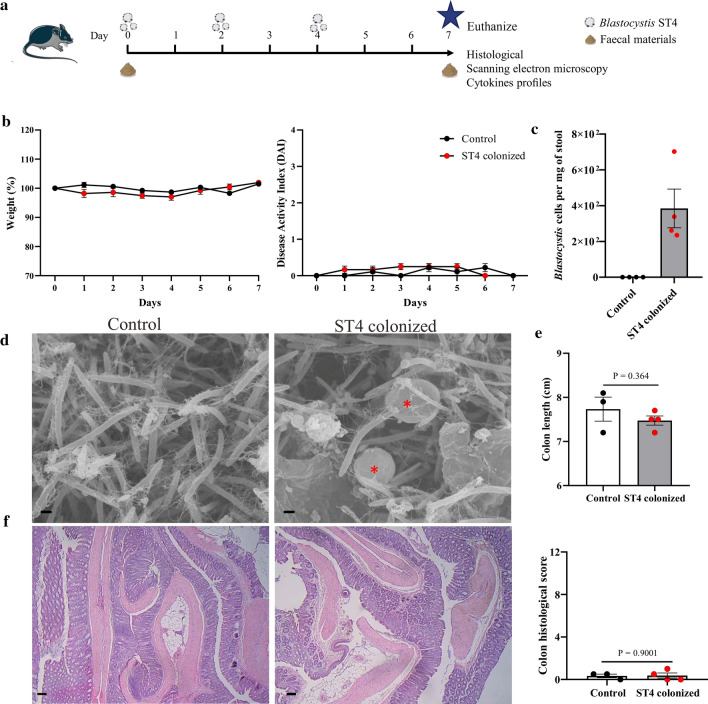
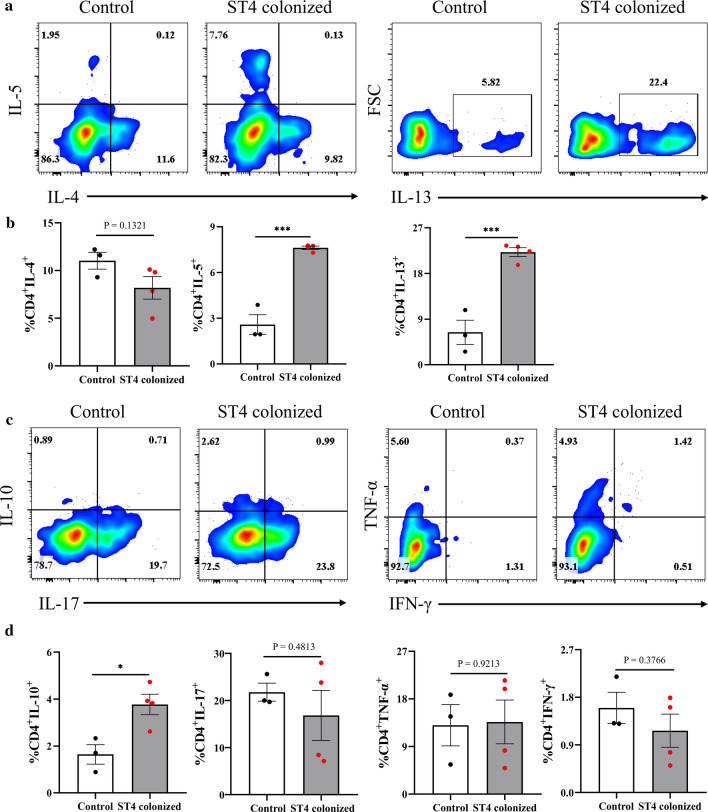
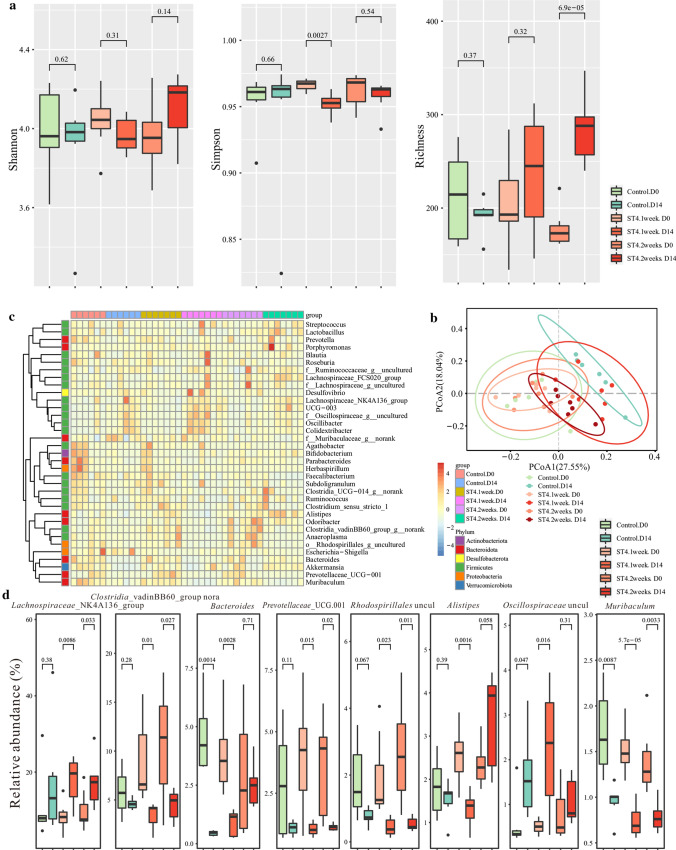
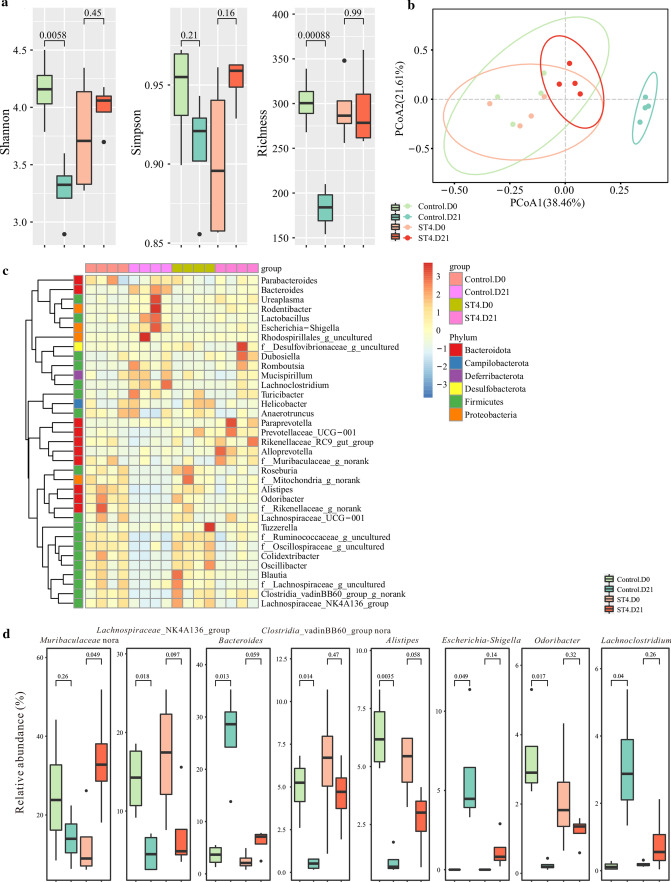
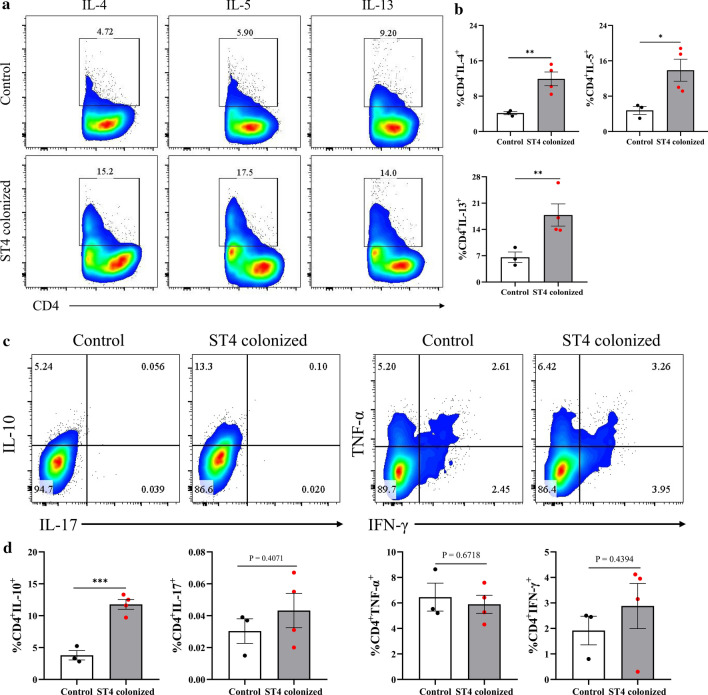
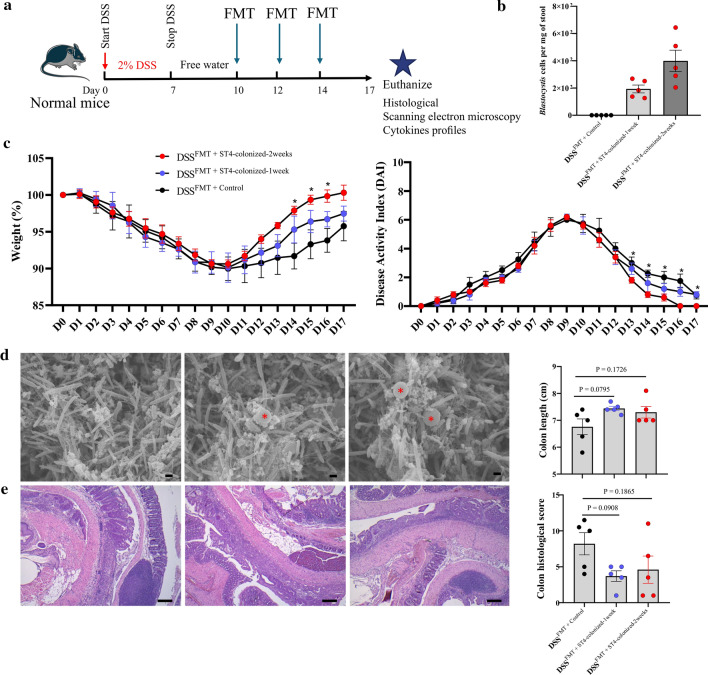
Results: Blastocystis ST4-colonized normal healthy mice and Rag1-/- mice asymptomatically and was able to alter the microbial community composition, mainly leading to increases in the proportion of Clostridia vadinBB60 group and Lachnospiraceae NK4A136 group, respectively. Blastocystis ST4 colonization promoted T helper 2 (Th2) response defined by interleukin (IL)-5 and IL-13 cytokine production, and T regulatory (Treg) induction from colonic lamina propria in normal healthy mice. Additionally, we observed that Blastocystis ST4 colonization can maintain the stability of bacterial community composition and induce Th2 and Treg immune responses to promote faster recovery from experimentally induced colitis. Furthermore, fecal microbiota transplantation of Blastocystis ST4-altered gut microbiome to colitis mice reduced the severity of colitis, which was associated with increased production of short-chain fat acids (SCFAs) and anti-inflammatory cytokine IL-10.
Conclusions: The data confirm our hypothesis that Blastocystis ST4 is a beneficial commensal, and the beneficial effects of Blastocystis ST4 colonization is mediated through modulating of the host gut bacterial composition, SCFAs production, and Th2 and Treg responses in different murine colonization models.
Keywords: Blastocystis; Colitis; Gut microbiota; Th2; Treg.
© 2022. The Author(s).
Conflict of interest statement
The authors declare no competing interests.
Figures


Similar articles
-
Decoding Blastocystis-Driven Mechanisms in Gut Microbiota and Host Metabolism.Adv Sci (Weinh). 2025 May;12(17):e2416325. doi: 10.1002/advs.202416325. Epub 2025 Apr 4. Adv Sci (Weinh). 2025. PMID: 40184630 Free PMC article. Review.
-
Colonization with two different Blastocystis subtypes in DSS-induced colitis mice is associated with strikingly different microbiome and pathological features.Theranostics. 2023 Feb 5;13(3):1165-1179. doi: 10.7150/thno.81583. eCollection 2023. Theranostics. 2023. PMID: 36793854 Free PMC article.
-
Colonization with ubiquitous protist Blastocystis ST1 ameliorates DSS-induced colitis and promotes beneficial microbiota and immune outcomes.NPJ Biofilms Microbiomes. 2023 Apr 25;9(1):22. doi: 10.1038/s41522-023-00389-1. NPJ Biofilms Microbiomes. 2023. PMID: 37185924 Free PMC article.
-
Interactions between Blastocystis subtype ST4 and gut microbiota in vitro.Parasit Vectors. 2022 Mar 8;15(1):80. doi: 10.1186/s13071-022-05194-x. Parasit Vectors. 2022. PMID: 35260166 Free PMC article.
-
New insights into the interactions between Blastocystis, the gut microbiota, and host immunity.PLoS Pathog. 2021 Feb 25;17(2):e1009253. doi: 10.1371/journal.ppat.1009253. eCollection 2021 Feb. PLoS Pathog. 2021. PMID: 33630979 Free PMC article. Review.
Cited by
-
Neglected gut microbiome: interactions of the non-bacterial gut microbiota with enteric pathogens.Gut Microbes. 2023 Jan-Dec;15(1):2226916. doi: 10.1080/19490976.2023.2226916. Gut Microbes. 2023. PMID: 37365731 Free PMC article. Review.
-
Decoding Blastocystis-Driven Mechanisms in Gut Microbiota and Host Metabolism.Adv Sci (Weinh). 2025 May;12(17):e2416325. doi: 10.1002/advs.202416325. Epub 2025 Apr 4. Adv Sci (Weinh). 2025. PMID: 40184630 Free PMC article. Review.
-
Profiling of the fecal microbiota and circulating microRNA-16 in IBS subjects with Blastocystis infection : a case-control study.Eur J Med Res. 2023 Nov 6;28(1):483. doi: 10.1186/s40001-023-01441-8. Eur J Med Res. 2023. PMID: 37932792 Free PMC article.
-
Hovenia dulcis Fruit Peduncle Polysaccharides Reduce Intestinal Dysbiosis and Hepatic Fatty Acid Metabolism Disorders in Alcohol-Exposed Mice.Foods. 2024 Apr 9;13(8):1145. doi: 10.3390/foods13081145. Foods. 2024. PMID: 38672817 Free PMC article.
-
Molecular Screening and Characterization of Enteric Protozoan Parasites and Microsporidia in Wild Ducks from Portugal.Animals (Basel). 2024 Oct 14;14(20):2956. doi: 10.3390/ani14202956. Animals (Basel). 2024. PMID: 39457886 Free PMC article.
References
-
- Shirvani G, Fasihi-Harandi M, Raiesi O, Bazargan N, Zahedi MJ, Sharifi I, Kalantari-Khandani B, Nooshadokht M, Shabandoust H, Mohammadi MA, et al. Prevalence and molecular subtyping of Blastocystis from patients with irritable bowel syndrome, inflammatory bowel disease and chronic urticaria in Iran. Acta Parasitol. 2020;65(1):90–96. doi: 10.2478/s11686-019-00131-y. - DOI - PubMed
MeSH terms
Substances
Grants and funding
LinkOut - more resources
Full Text Sources
