. 2022 Apr 18;17(4):e0267140.
doi: 10.1371/journal.pone.0267140. eCollection 2022.

The diagnostic value of nasal microbiota and clinical parameters in a multi-parametric prediction model to differentiate bacterial versus viral infections in lower respiratory tract infections

Affiliations

The diagnostic value of nasal microbiota and clinical parameters in a multi-parametric prediction model to differentiate bacterial versus viral infections in lower respiratory tract infections

Yunlei Li et al. PLoS One. .

Abstract

Background: The ability to accurately distinguish bacterial from viral infection would help clinicians better target antimicrobial therapy during suspected lower respiratory tract infections (LRTI). Although technological developments make it feasible to rapidly generate patient-specific microbiota profiles, evidence is required to show the clinical value of using microbiota data for infection diagnosis. In this study, we investigated whether adding nasal cavity microbiota profiles to readily available clinical information could improve machine learning classifiers to distinguish bacterial from viral infection in patients with LRTI.

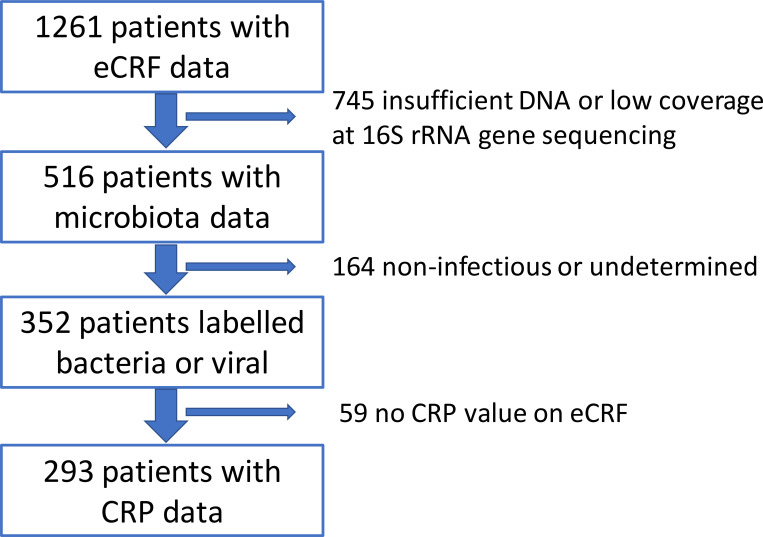
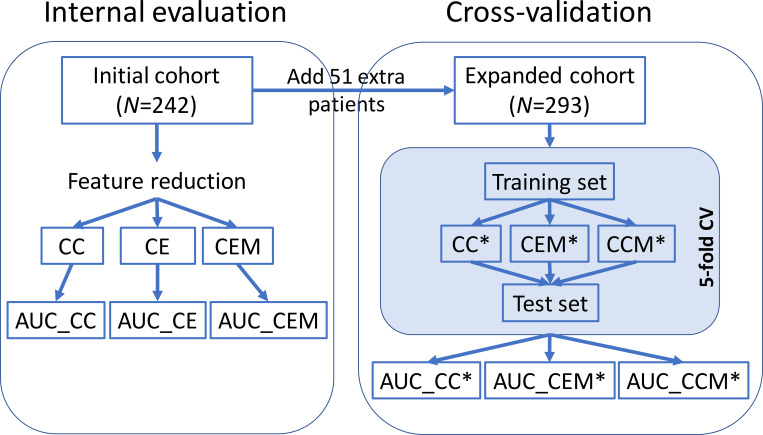
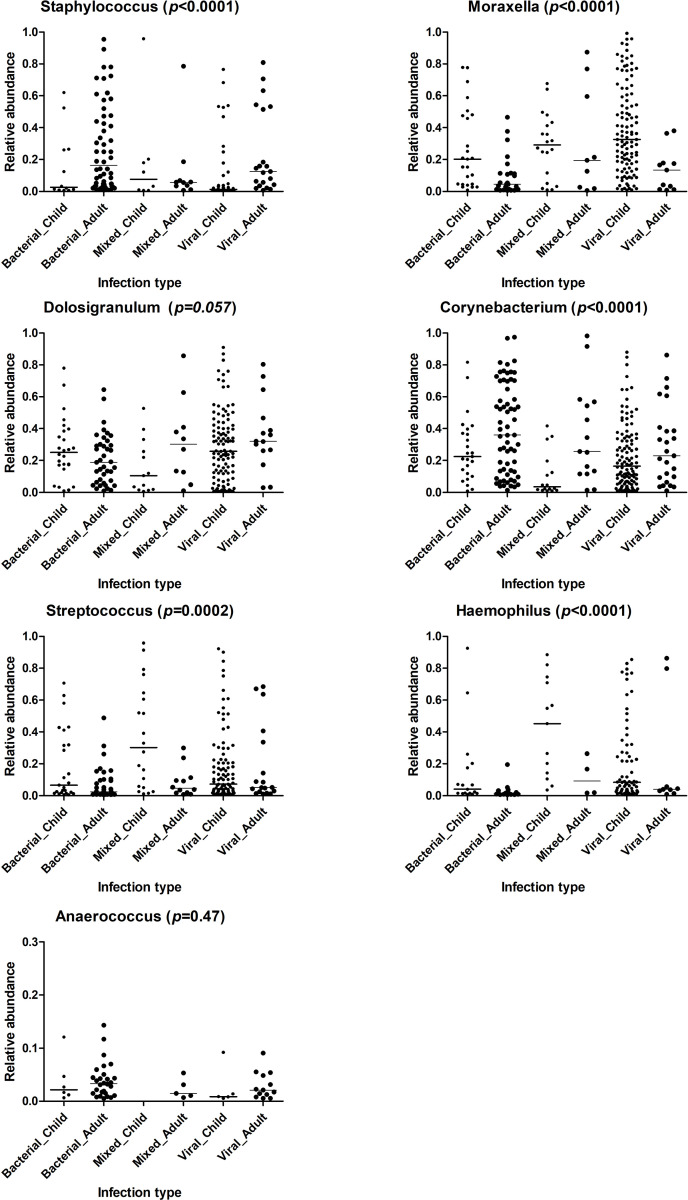
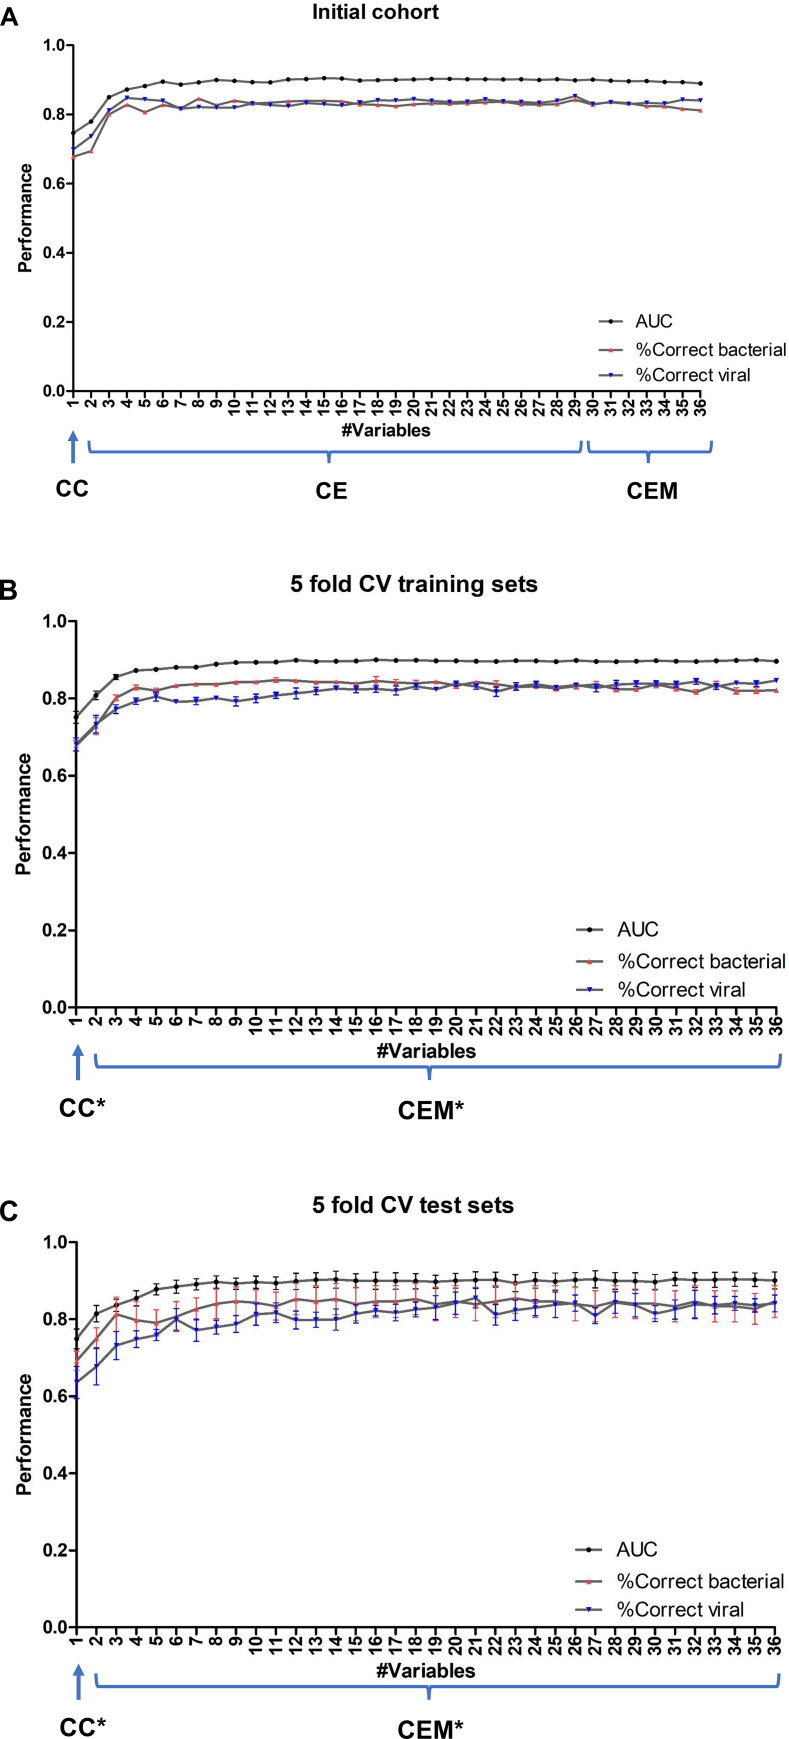
Results: Various multi-parametric Random Forests classifiers were evaluated on the clinical and microbiota data of 293 LRTI patients for their prediction accuracies to differentiate bacterial from viral infection. The most predictive variable was C-reactive protein (CRP). We observed a marginal prediction improvement when 7 most prevalent nasal microbiota genera were added to the CRP model. In contrast, adding three clinical variables, absolute neutrophil count, consolidation on X-ray, and age group to the CRP model significantly improved the prediction. The best model correctly predicted 85% of the 'bacterial' patients and 82% of the 'viral' patients using 13 clinical and 3 nasal cavity microbiota genera (Staphylococcus, Moraxella, and Streptococcus).

Conclusions: We developed high-accuracy multi-parametric machine learning classifiers to differentiate bacterial from viral infections in LRTI patients of various ages. We demonstrated the predictive value of four easy-to-collect clinical variables which facilitate personalized and accurate clinical decision-making. We observed that nasal cavity microbiota correlate with the clinical variables and thus may not add significant value to diagnostic algorithms that aim to differentiate bacterial from viral infections.


Conflict of interest statement

The authors have declared that no competing interests exist.

Figures

Fig 1
Fig 1. Patient filtering.
LRTI patients from TAILORED-Treatment study underwent several filtering steps before they entered the classifier development stage. The eCRF data utilized in this publication was obtained from the following patient cohort [21]. eCRF: electronic Case Report Forms. CRP: C-reactive protein.
Fig 2
Fig 2. Study overview.
A cohort of 242 patients were included in the internal evaluation phase according to the date of recruitment to the TAILORED-Treatment study. This cohort was used to compare the prediction performances of the classifiers using eCRF variables alone, as well as classifiers using both eCRF and microbiota variables (Internal evaluation phase). In the expanded cohort (51 extra patients), 5-fold cross-validation (CV) analysis was conducted to evaluate the contribution of eCRF and microbiota variables to prediction performance (Cross-validation phase). CC: Classifier using CRP only in the initial cohort. CE: Classifiers using two or more eCRF variables (incl. CRP) in the initial cohort. CEM: Classifiers using all input eCRF variables (incl. CRP) and at least one microbiota in the initial cohort. CC*: Classifier using CRP only in the 5-fold CV of the expanded cohort. CEM*: Classifiers using two or more variables (regardless eCRF or microbiota) in the 5-fold CV of the expanded cohort. CCM*: Classifiers using CRP and all input microbiota variables in the 5-fold CV of the expanded cohort. AUC: Area Under the ROC Curve.
Fig 3
Fig 3. Relative abundance of seven most common bacterial genera related to age and infection origin of TAILORED-Treatment cohort.
Kruskal-Wallis test was performed to calculate the p-values. Horizontal bars represent the median values.
Fig 4
Fig 4. Performance of the classifiers.
Classifier performance in A) the initial cohort, B) 5-fold cross-validation training sets in the expanded cohort, and C) 5-fold cross-validation test sets in the expanded cohort. X-axis shows the number of variables included in the classifier. The lines represent the mean of AUC, the accuracy of class ‘bacterial infection’, and the accuracy of class ‘viral infection’, respectively. The bars represent the standard error of the mean (SEM). In the initial cohort (Panel A), first eCRF variables were ranked separately and included in the classifier incrementally, followed by ranked microbiota variables. The ranking was based on their variable importance calculated by function vimp in the initial cohort. In the cross-validation (Panels B-C), the ranking of all eCRF and microbiota variables was calculated simultaneously based on the training set in the particular split and averaged across five splits. CC: Classifier using CRP only in the initial cohort. CE: Classifiers using two or more eCRF variables (incl. CRP) in the initial cohort. CEM: Classifiers using all input eCRF variables (incl. CRP) and at least one nasal cavity microbiota variable in the initial cohort. CC*: Classifier using only CRP in the 5-fold cross-validation of the expanded cohort. CEM*: Classifiers using two or more variables (regardless of eCRF or nasal cavity microbiota origin) in the 5-fold cross-validation of the expanded cohort. AUC: Area Under the ROC Curve. CV: cross-validation. SEM: standard error of the mean.

References

    1. Feldman C, Shaddock E. Epidemiology of lower respiratory tract infections in adults. Expert Rev Resp Med. 2019;13(1):63–77. doi: 10.1080/17476348.2019.1555040 WOS:000455021200005. - DOI - PubMed
    1. Hossain MZ, Bambrick H, Wraith D, Tong SL, Khan A, Hore SK, et al.. Sociodemographic, climatic variability and lower respiratory tract infections: a systematic literature review. Int J Biometeorol. 2019;63(2):209–19. doi: 10.1007/s00484-018-01654-1 WOS:000459790300011. - DOI - PubMed
    1. Marshall DC, Goodson RJ, Xu YW, Komorowski M, Shalhoub J, Maruthappu M, et al.. Trends in mortality from pneumonia in the Europe union: a temporal analysis of the European detailed mortality database between 2001 and 2014. Resp Res. 2018;19. doi: 10.1186/s12931-018-0781-4 WOS:000431832800001. - DOI - PMC - PubMed
    1. Moore A, Harnden A, Grant CC, Patel S, Irwin RS, Altman KW, et al.. Clinically Diagnosing Pertussis-associated Cough in Adults and Children CHEST Guideline and Expert Panel Report. Chest. 2019;155(1):147–54. doi: 10.1016/j.chest.2018.09.027 WOS:000454907500028. - DOI - PMC - PubMed
    1. Hill AT, Gold PM, El Solh AA, Metlay JP, Ireland B, Irwin RS, et al.. Adult Outpatients With Acute Cough Due to Suspected Pneumonia or Influenza CHEST Guideline and Expert Panel Report. Chest. 2019;155(1):155–67. doi: 10.1016/j.chest.2018.09.016 WOS:000454907500029. - DOI - PMC - PubMed

Publication types

Substances