. 2022 Jul:61:101500.
doi: 10.1016/j.molmet.2022.101500. Epub 2022 Apr 15.

SERPINA3C ameliorates adipose tissue inflammation through the Cathepsin G/Integrin/AKT pathway

Affiliations

SERPINA3C ameliorates adipose tissue inflammation through the Cathepsin G/Integrin/AKT pathway

Bai-Yu Li et al. Mol Metab. 2022 Jul.

Abstract

Objective: Due to the increasing prevalence of obesity and insulin resistance, there is an urgent need for better treatment of obesity and its related metabolic disorders. This study aimed to elucidate the role of SERPINA3C, an adipocyte secreted protein, in obesity and related metabolic disorders.

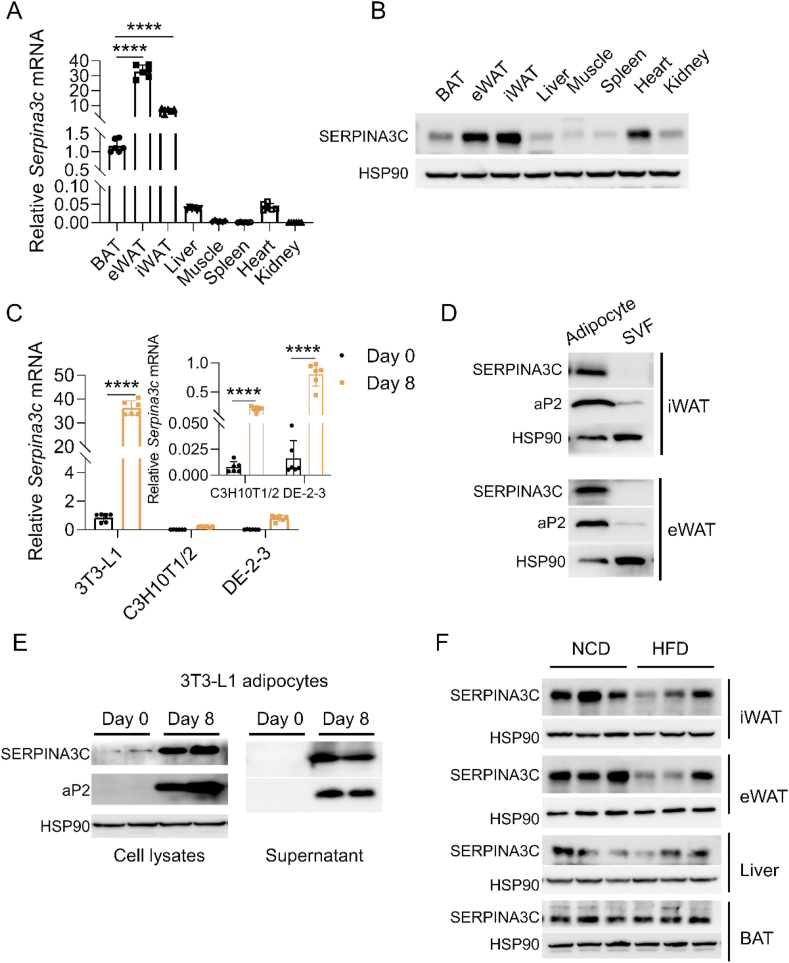
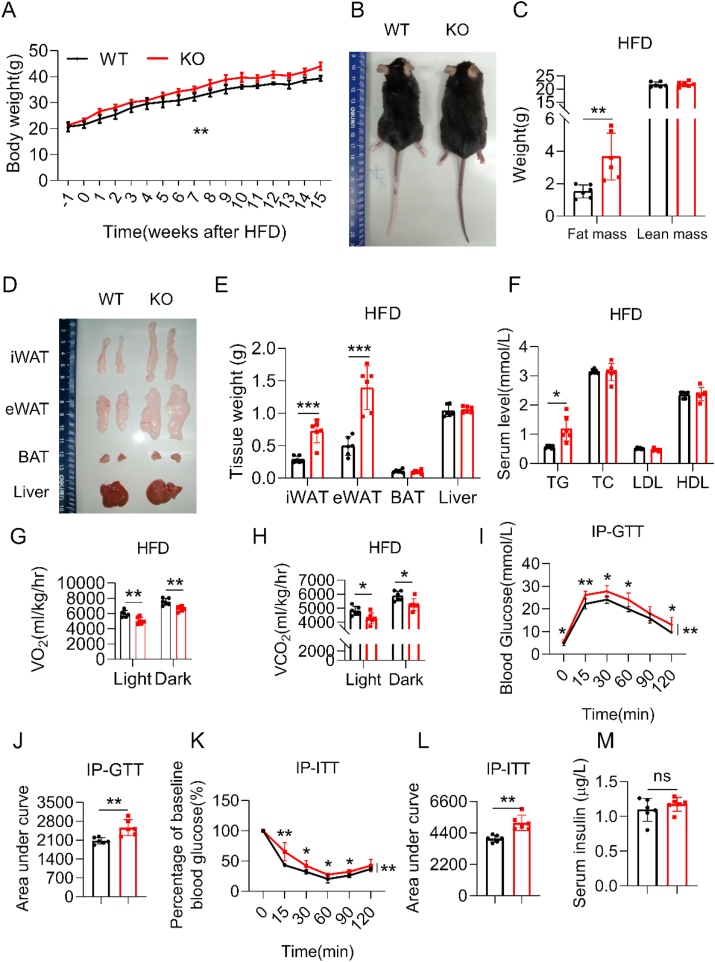
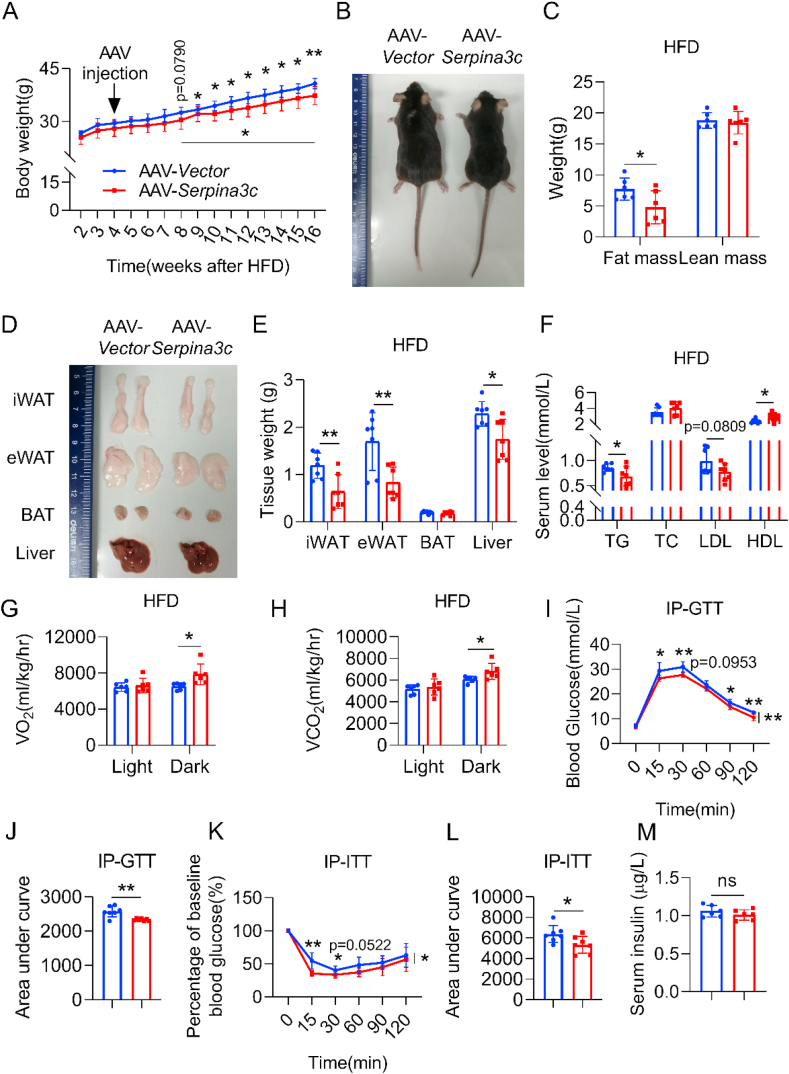
Methods: Male wild type (WT) and knockout (KO) mice were fed with high-fat diet (HFD) for 16 weeks, adiposity, insulin resistance, and inflammation were assessed. AAV-mediated overexpression of SERPINA3C was injected locally in inguinal white adipose tissue (iWAT) to examine the effect of SERPINA3C. In vitro analyses were conducted in 3T3-L1 adipocytes to explore the molecular pathways underlying the function of SERPINA3C.

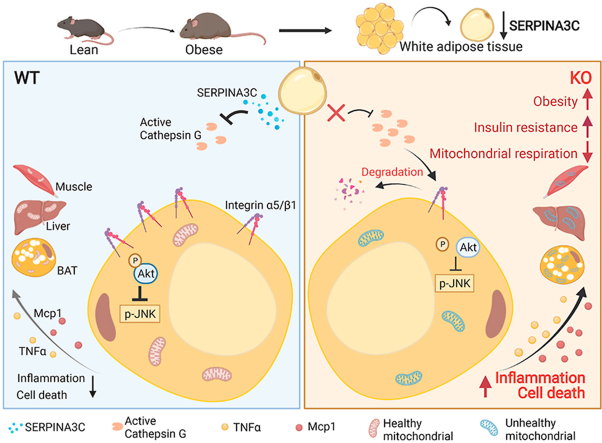
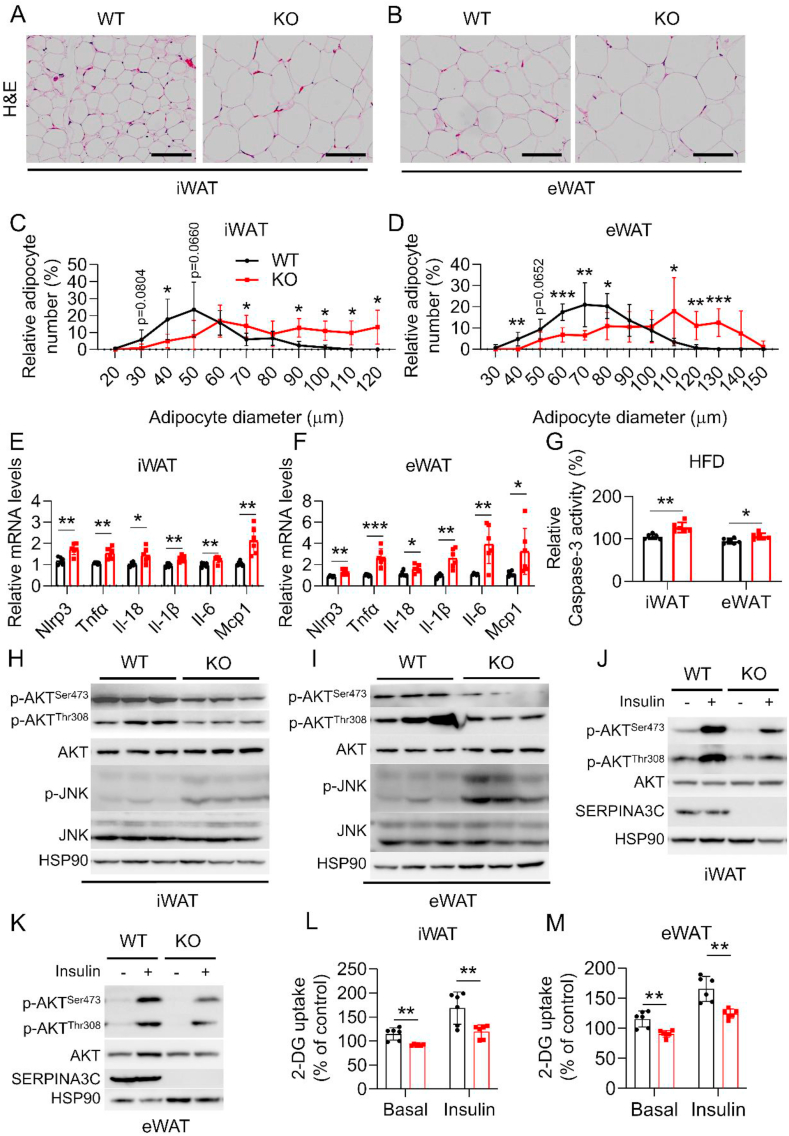
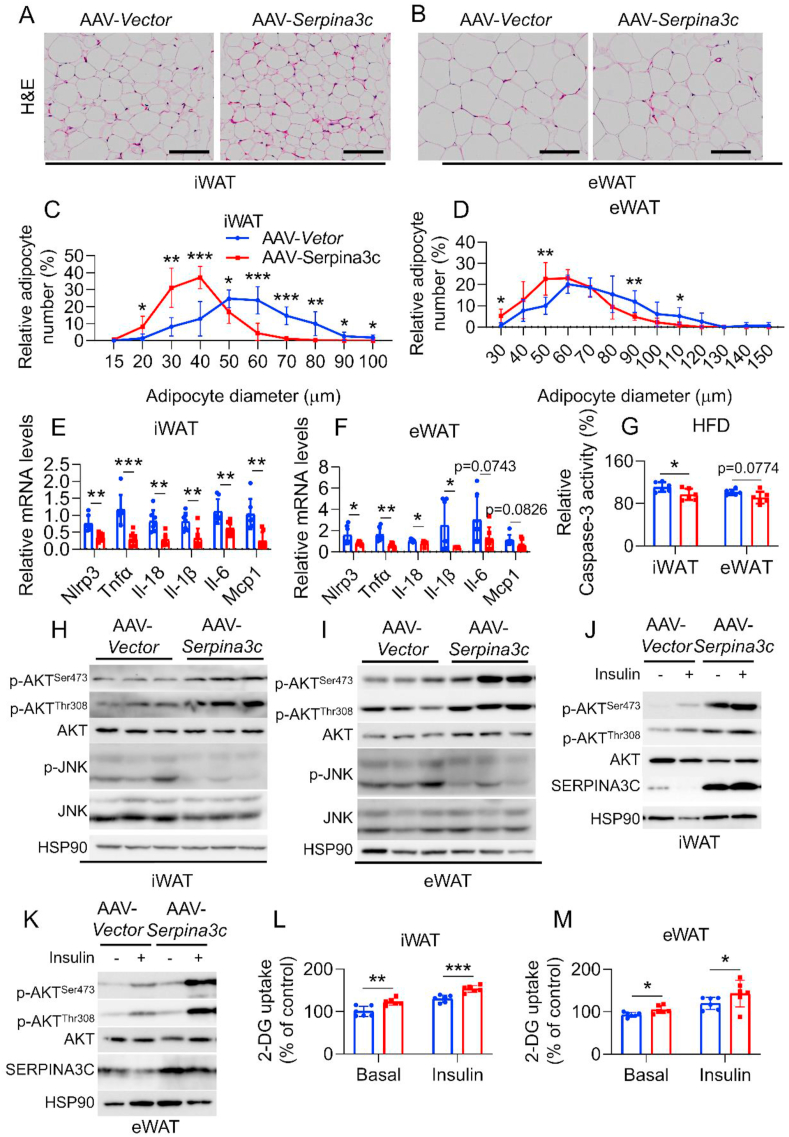
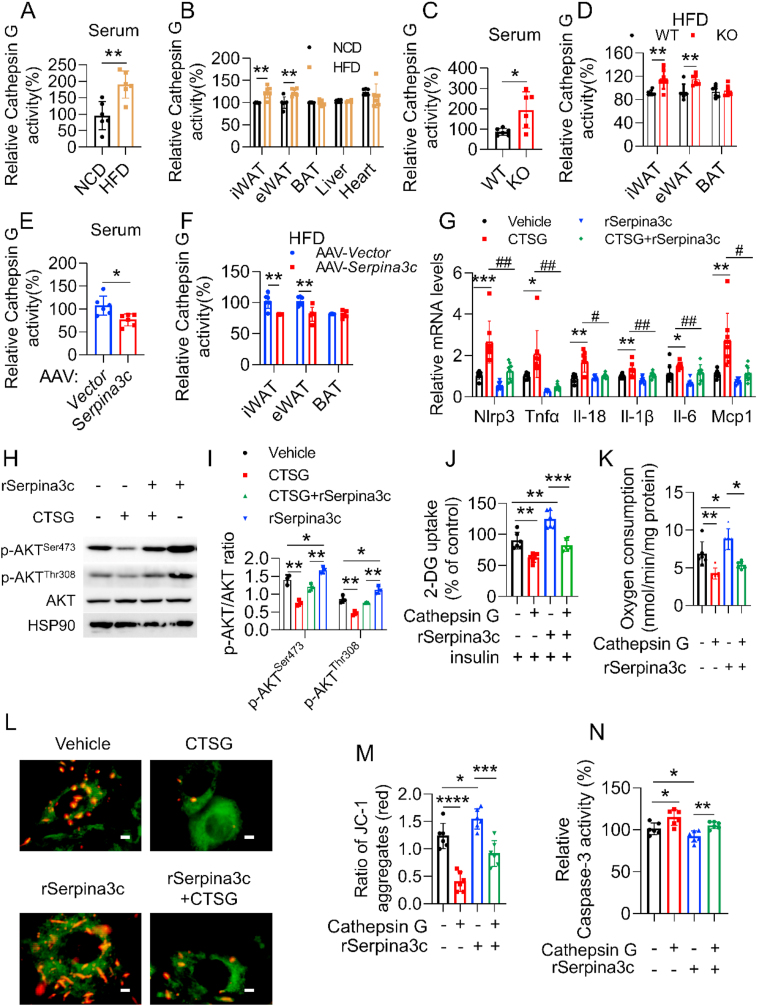
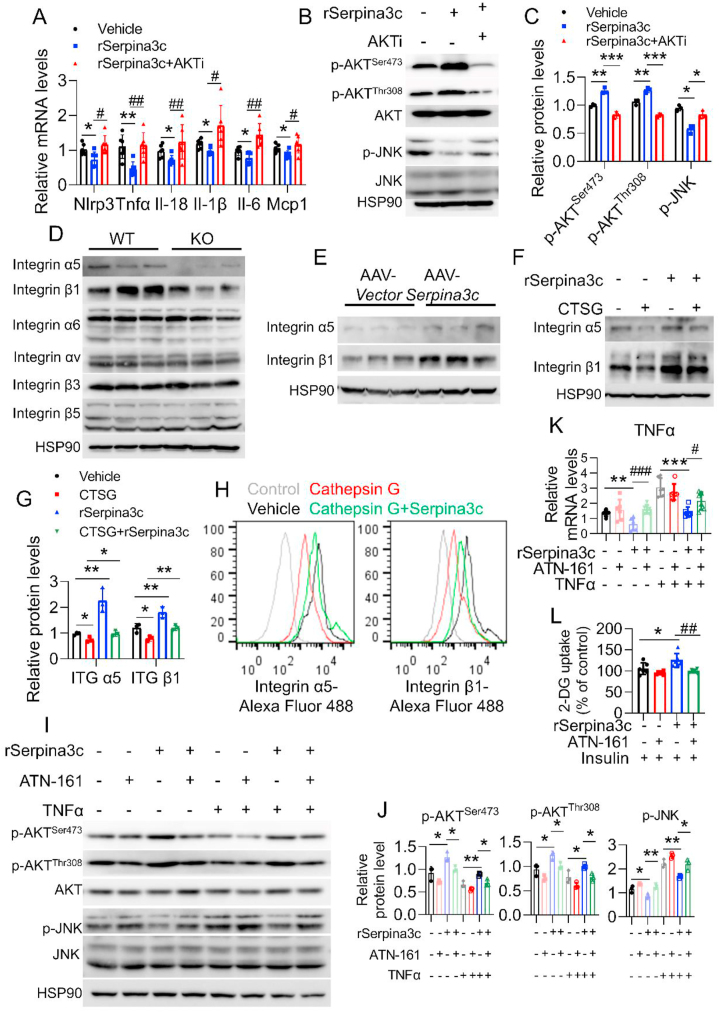
Results: Functional exploration of the SERPINA3C knockout mice revealed that SERPINA3C deficiency led to an impaired metabolic phenotype (more severe obesity, lower metabolic rates, worse glucose intolerance and insulin insensitivity), which was associated with anabatic inflammation and apoptosis of white adipose tissues. Consistent with these results, overexpression of SERPINA3C in inguinal adipose tissue protected mice against diet-induced obesity and metabolic disorders with less inflammation and apoptosis in adipose tissue. Mechanistically, SERPINA3C inhibited Cathepsin G activity, acting as a serine protease inhibitor, which blocked Cathepsin G-mediated turnover of α5/β1 Integrin protein. Then, the preserved integrity (increase) of α5/β1 Integrin signaling activated AKT to decrease JNK phosphorylation, thereby inhibiting inflammation and promoting insulin sensitivity in adipocytes.

Conclusions/interpretation: These findings demonstrate a previously unknown SERPINA3C/Cathepsin G/Integrin/AKT pathway in regulating adipose tissue inflammation, and suggest the therapeutic potential of targeting SERPINA3C/Cathepsin G axis in adipose tissue for the treatment of obesity and metabolic diseases.

Keywords: Adipokine; Inflammation; Insulin resistance; Integrin α5/β1; White adipose tissue.


Figures

Image 1
Graphical abstract
Figure 1
Figure 1
SERPINA3C is a secreted factor enriched in adipocytes and is downregulated in white adipose tissue (WAT) of mice after high-fat diet (HFD) feeding. A: The NCD-fed 16-week-old C57BL/6J male mice were sacrificed for analyses. qPCR analysis of SERPINA3C mRNA expression in multiple tissues of the mice was shown. B: SERPINA3C protein level in multiple tissues of the mice in (A). C: qPCR analysis of SERPINA3C mRNA expression before (Day 0) and after (Day 8) 3T3-L1, C3H10T1/2, DE-2-3 cell differentiation. D: SERPINA3C protein level in adipocyte and SVF from iWAT (above) and eWAT (below) of 12-week-old NCD-fed male mice. E: SERPINA3C protein level before (Day 0) and after (Day 8) 3T3-L1 cell differentiation. Left, cell lysates; right, supernatant. F: 8-week-old male C57BL/6J mice were fed with NCD or HFD for an additional 16 weeks; Western blot analysis of SERPINA3C protein expression in adipose tissue (iWAT, eWAT and BAT) and liver of the mice was shown. n = 3. For statistical analyses, one-way analysis of variance and Bonferroni’s post hoc tests were performed in (A), unpaired two-tailed Student’s t tests were performed in (C). All values are represented as means with error bars representing S.D. ∗∗∗∗, p < 0.0001. n = 6 for each group unless otherwise mentioned.
Figure 2
Figure 2
SERPINA3C ablation led to exacerbated diet-induced obesity (DIO) and metabolic disorders in mice. The 8-week-old WT and SERPINA3C-KO mice were fed a HFD for 16 weeks before being sacrificed for analysis. A: Body weight (BW) of these WT and KO mice. B: Representative pictures of the mice. C: Body composition of the mice measured by nuclear magnetic resonance. D: Representative images of adipose tissues and livers of the mice. E: Weights of adipose tissues and liver of the mice. F: Serum TG, TC, LDL, HDL levels of the mice after overnight fasting. G: The average values of the whole-body oxygen consumption rate (VO2) were measured by metabolic cages for the mice. H: The average values of the whole-body CO2 generation (VCO2) were measured by metabolic cages for the mice. I: Glucose concentrations during an i.p. glucose tolerance test (GTT) in mice after 10 weeks of HFD feeding. J: Area under the curve analysis of (I). K: Glucose concentrations during an insulin tolerance test (ITT) in mice after 11 weeks of HFD feeding. L: Area under the curve analysis of (K). M: Serum insulin level of the mice at basal condition of (K). For statistical analyses, two-way analysis of variance and Bonferroni’s post hoc tests were performed in (A), (I), and (K). Unpaired two-tailed Student’s t tests were performed in (C), (E), (F), (G), (H), (J), (L) and (M). For statistical analyses in (A), (C), (E)–(L), data were compared between the WT and KO mice. All values are represented as means with error bars representing S.D. ∗, p < 0.05; ∗∗, p < 0.01; ∗∗∗, p < 0.001. n = 6 for each group.
Figure 3
Figure 3
HFD-fed SERPINA3C knockout (KO) mice exhibit aggravated inflammation, apoptosis and insulin resistance in adipose tissue. Mice were treated as indicated in Figure 2. A and B: H&E staining of iWAT (A) and eWAT (B), respectively. Scale bar, 100 μm. C and D: Quantitative analyses of adipocyte size distribution of (A) and (B). E and F: mRNA levels of the indicated genes were determined by qPCR in iWAT (E) and eWAT (F), respectively. G: Caspase-3 activity was determined in iWAT and eWAT. H and I: Western blot analysis of the protein levels in iWAT and eWAT by using the indicated antibodies. HSP90 serves as an internal control. J and K: Western blot for detecting phosphorylated AKT in iWAT and eWAT. Mice were sacrificed 15 min after insulin injection (i.p.). n = 3. L and M: 2-DG uptake was determined in iWAT and eWAT. For statistical analyses, unpaired two-tailed Student’s t tests between the WT and KO mice were performed in (E)–(G), (L) and (M). All values are represented as means with error bars representing S.D. ∗, p < 0.05; ∗∗, p < 0.01; ∗∗∗, p < 0.001. n = 6 for each group unless otherwise mentioned.
Figure 4
Figure 4
Overexpression of SERPINA3C in inguinal white adipose tissue (iWAT) protects mice against DIO and metabolic disorders. 8-week-old C57BL/6J male mice with 4-week HFD feeding were injected with AAV in iWAT locally. HFD feeding was continued until mice were 24-week-old before mice were sacrificed for analyses. A: BW of the mice during 16-week HFD feeding. B: Representative picture of the mice after 16-week HFD feeding. C: Body composition in the mice was measured by nuclear magnetic resonance. n = 6. D: Representative images of adipose tissues and liver from the mice. E: Weights of adipose tissues and liver from the mice. F: Serum TG, TC, LDL, HDL levels of the mice after overnight fasting. G: The average values of the whole-body oxygen consumption rate (VO2) were measured by metabolic cages for the mice. n = 6. H: The average values of the whole-body CO2 generation (VCO2) were measured by metabolic cages for the mice. n = 6. I: Glucose concentrations during an i.p. glucose tolerance test (GTT) after mice were injected with AAV for 3 weeks. J: Area under the curve analysis of (I). K: Glucose concentrations during an insulin tolerance test (ITT) after mice were injected with AAV for 4 weeks. L: Area under the curve analysis of (K). M: Serum insulin level of the mice at basal condition of (K). For statistical analyses, two-way analysis of variance and Bonferroni’s post hoc tests were performed in (A), (I), and (K). Unpaired two-tailed Student’s t tests were performed in (C), (E), (F), (G), (H), (J), (L) and (M). For statistical analyses in (A), (C), (E)–(L), data were compared between the AAV-Vector and AAV-SERPINA3C mice. All values are represented as means with error bars representing S.D. ∗, p < 0.05; ∗∗, p < 0.01. n = 7 for each group unless otherwise mentioned.
Figure 5
Figure 5
HFD-fed mice with SERPINA3C overexpressing in the iWAT were protected from HFD-induced inflammation, apoptosis and insulin resistance in adipose tissue. Mice were treated as indicated in Figure 4. A and B: H&E staining of iWAT (A) and eWAT (B), respectively. Scale bar, 100 μm. C and D: Quantitative analyses of adipocyte size distribution of (A) and (B). E and F: mRNA levels of the indicated genes were determined by qPCR in iWAT (E) and eWAT (F), respectively. G: Caspase-3 activity was determined in iWAT and eWAT. H and I: Western blot analysis of the protein levels in iWAT and eWAT, respectively, by using the indicated antibodies. HSP90 serves as an internal control. J and K: Western blot for detecting phosphorylated AKT in iWAT and eWAT, respectively. Mice were sacrificed 15 min after insulin injection (i.p.). n = 3. L and M: 2-DG uptake was determined in iWAT and eWAT, respectively. n = 6. For statistical analyses, unpaired two-tailed Student’s t tests between the AAV-Vector and AAV-SERPINA3C mice were performed in (E)–(G), (L), and (M). All values are represented as means with error bars representing S.D. ∗, p < 0.05; ∗∗, p < 0.01; ∗∗∗, p < 0.001. n = 7 for each group unless otherwise mentioned.
Figure 6
Figure 6
SERPINA3C improves metabolic health at least partially via inhibiting Cathepsin G-mediated inflammation in adipocytes. A and B: 8-week-old C57BL/6J male mice was fed with NCD or HFD for 16 weeks before being sacrificed. Cathepsin G activity was determined in serum (A) and multiple tissues (B) of the mice, respectively. C and D: 8-week-old WT and SERPINA3C–KO male mice was fed with HFD for 16 weeks before being sacrificed. Cathepsin G activity was determined in serum (C) and fat tissues (D) of the mice, respectively. E and F: 8-week-old C57BL/6J male mice with 4-week HFD feeding was injected with AAV at iWAT, and then HFD feeding was continued for another 12 weeks before mice were sacrificed. Cathepsin G activity was determined in serum (E) and fat tissues (F) of the mice, respectively. G: 3T3-L1 adipocytes were treated with Cathepsin G and/or SERPINA3C for 12 h, then cells were harvested for analyses. mRNA levels of the indicated genes were determined by qPCR. n = 8. H: 3T3-L1 adipocytes were treated with Cathepsin G and/or SERPINA3C for 12 h, then cells were harvested. Western blot was used to detect phosphorylated AKT. I: Quantification of WB shown in (H). Image J was used to calculate band intensities. n = 3. J: 3T3-L1 adipocytes were pretreated with Cathepsin G and/or SERPINA3C for 12 h, then supplemented with insulin for 10min before harvest. 2-DG uptake assay was used to measure glucose uptake. K: OCR is measured by Clark oxygen electrode in Cathepsin G-treated mature 3T3-L1 adipocytes (Day 8) with or without SERPINA3C recombinant protein (100 ng/mL) for 12 h. L: JC-1 staining of Cathepsin G-treated mature 3T3-L1 adipocytes (Day 8) with or without SERPINA3C recombinant protein (100 ng/mL) for 12 h. The subcellular localization of JC-1 monomers (green) and JC-1 aggregates (red) was examined by using a fluorescence microscope. Scale bar: 200 μm. M: Quantification of JC-1 aggregates (red) shown in (L). N: 3T3-L1 adipocytes were treated with Cathepsin G and/or SERPINA3C for 12 h, then cells were harvested for analyses. Caspase-3 activity was determined. For statistical analyses, one-way analysis of variance and Bonferroni’s post hoc tests were performed in (G), (I), (J), (K), (M) and (N), unpaired two-tailed Student’s t tests were performed in (A)–(F). All values are represented as means with error bars representing S.D. ∗, p < 0.05; ∗∗, p < 0.01. #, p < 0.05; ##, p < 0.01. n = 6 for each group unless otherwise mentioned.
Figure 7
Figure 7
SERPINA3C protects against adipose inflammation by inhibiting Cathepsin G-mediated turnover of Integrin α5/β1 protein to induce AKT activity.A and B: 3T3-L1 adipocytes were pretreated with TNFα for 12 h. Then SEPRINA3C and AKT inhibitor was added into the cell culture medium as indicated. mRNA levels of the indicated genes were determined by qPCR in (A). Western blot analysis of the indicated protein levels was performed in (B). C: Quantification of WB shown in (B). Image J was used to calculate band intensities. n = 3. D: 8-week-old WT and SERPINA3C–KO male mice were fed with 16-week HFD before being sacrificed. Protein levels of integrin α5, β1, α6, αv, β3, and β5 were determined. n = 3. E: 8-week-old C57BL/6J male mice with 4-week HFD feeding were injected with AAV at iWAT, and then HFD feeding was continued for another 12 weeks before mice were sacrificed. Protein levels of integrin α5 and integrin β1 were determined. n = 3. F: Cells were treated with Cathepsin G and/or SERPINA3C for 12 h. Protein levels of integrin α5 and integrin β1 were determined. G: Quantification of WB shown in (F). Image J was used to calculate band intensities. n = 3. H: Flow cytometry analysis of the indicated protein levels in Cathepsin G or SERPINA3C treated adipocytes. Cells were treated with Cathepsin G and/or SERPINA3C for 12 h. I: 3T3-L1 adipocytes were treated with TNFα and/or SERPINA3C for 12 h, in the presence or absence of 10 μmol ATN-161 (an inhibitor of integrin α5/β1 signaling). Western blot analysis of the indicated protein levels was performed. J: Quantification of WB shown in (I). Image J was used to calculate band intensities. n = 3. K: 3T3-L1 adipocytes were treated with TNFα and/or SERPINA3C for 12 h, in the presence or absence of 10 μmol ATN-161. mRNA levels of TNFα were determined by qPCR. L: SERPINA3C-treated 3T3-L1 adipocytes were stimulated with insulin, ATN-161 was added to block integrin α5/β1 signaling. 3T3-L1 adipocytes were treated with SERPINA3C and/or ATN-161 for 12 h. Then cells were stimulated with or without insulin (100 nmol/L) for 10 min before being harvested. 2-DG uptake assay was performed. For statistical analyses, one-way analysis of variance and Bonferroni’s post hoc tests were performed in (A), (C), (G), (J), (K) and (L). All values are represented as means with error bars representing S.D. ∗, p < 0.05; ∗∗, p < 0.01, ∗∗∗, p < 0.001. #, p < 0.05; ##, p < 0.01; ###, p < 0.001. n = 6 for each group unless otherwise mentioned.

References

    1. Ng A.C.T., Delgado V., Borlaug B.A., Bax J.J. Diabesity: the combined burden of obesity and diabetes on heart disease and the role of imaging. Nature Reviews Cardiology. 2021;18:291–304. - PubMed
    1. Luk C.T., Shi S.Y., Cai E.P., Sivasubramaniyam T., Krishnamurthy M., Brunt J.J., et al. FAK signalling controls insulin sensitivity through regulation of adipocyte survival. Nature Communications. 2017;8:14360. - PMC - PubMed
    1. Guo Y.Y., Li B.Y., Peng W.Q., Guo L., Tang Q.Q. Taurine-mediated browning of white adipose tissue is involved in its anti-obesity effect in mice. Journal of Biological Chemistry. 2019;294:15014–15024. - PMC - PubMed
    1. Peng W.Q., Xiao G., Li B.Y., Guo Y.Y., Guo L., Tang Q.Q. l-Theanine activates the browning of white adipose tissue through the AMPK/alpha-Ketoglutarate/Prdm16 Axis and ameliorates diet-induced obesity in mice. Diabetes. 2021;70:1458–1472. - PubMed
    1. Chen M., Zhu J.-Y., Mu W.-J., Guo L. Genes & Diseases; 2022. Cysteine dioxygenase type 1 (CDO1): its functional role in physiological and pathophysiological processes. - PMC - PubMed

Publication types

MeSH terms