

Lupus nephritis correlates with B cell interferon-β, anti-Smith, and anti-DNA: a retrospective study
- PMID: 35436902
- PMCID: PMC9014622
- DOI: 10.1186/s13075-022-02766-1
Lupus nephritis correlates with B cell interferon-β, anti-Smith, and anti-DNA: a retrospective study
Abstract
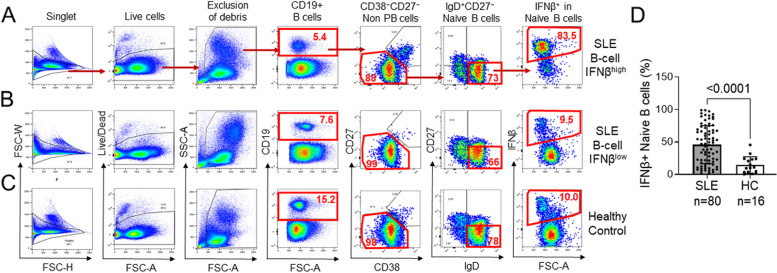
Background: In systemic lupus erythematosus (SLE), detection of interferon-β (IFNβ) in B cells was found to be most prominent in patients with high anti-Smith (Sm) and renal disease, but a mechanistic connection was not clear. The objective of the present study is to determine the association of IFNβ in peripheral blood naïve B cells with the histopathological features of lupus nephritis (LN).
Methods: The percentage of IFNβ+ cells in IgD+CD27- naïve CD19+ B cells (B cell IFNβ) among peripheral blood mononuclear cells (PBMCs) from 80 SLE patients were analyzed using flow cytometry. Serological and clinical data were collected. The correlations of B cell IFNβ with LN classification and with histopathological findings (light, electron, and immunofluorescence [IF] microscopic analyses for deposition of IgM, IgG, IgA, C1q, and C3) were determined in 23 available biopsy specimens.
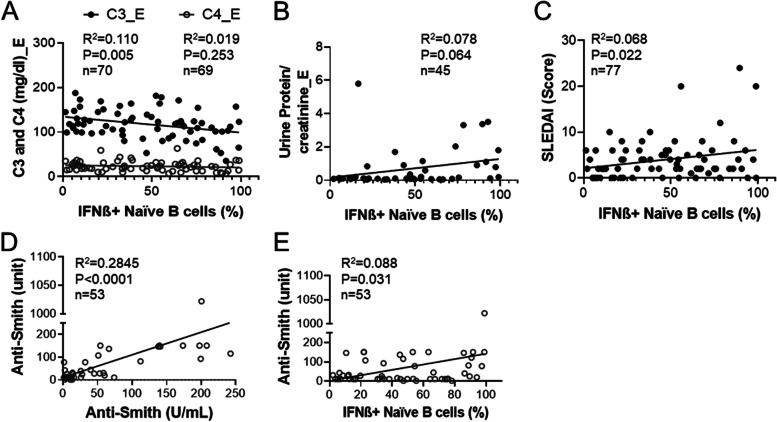
Results: B cell IFNβ is positively associated with anti-Sm (p = 0.001), anti-DNA (p = 0.013), and LN (p < 0.001) but was negatively associated with oral/nasal ulcer (p = 0.003) and photosensitivity (p = 0.045). B cell IFNβ positively correlated with immune complex (IC) deposit in the glomerular basement membrane (GBM) (p = 0.002) but not in the mesangial (p = 0.107) or tubular region (p = 0.313). Patients with high B cell IFNβ had statistically increased development of the proliferative LN (Classes III, IV and/or V), compared to patients with low B cell IFNβ (p < 0.0001). Histopathological features positively associated with increased B cell IFNβ included active glomerular lesions as determined by fibrocellular crescents (p = 0.023), chronic glomerular lesions indicated by segmental sclerosis (p = 0.033), and a membranous pattern of renal damage indicated by spike/holes (p = 0.015).
Conclusion: B cell IFNβ correlates with history of severe LN, glomerular basement membrane (GBM) IC deposition, and anatomical features of both active and chronic glomerular lesions.
Keywords: Autoantibodies; B cell interferon beta; Lupus nephritis; Systemic lupus erythematosus.
© 2022. The Author(s).
Conflict of interest statement
The authors declare that there have no competing interests.
Figures


Similar articles
-
Absence of Anti-Glomerular Basement Membrane Antibodies in 200 Patients With Systemic Lupus Erythematosus With or Without Lupus Nephritis: Results of the GOODLUPUS Study.Front Immunol. 2020 Dec 14;11:597863. doi: 10.3389/fimmu.2020.597863. eCollection 2020. Front Immunol. 2020. PMID: 33381119 Free PMC article.
-
C-reactive protein, immunoglobulin G and complement co-localize in renal immune deposits of proliferative lupus nephritis.Autoimmunity. 2013 May;46(3):205-14. doi: 10.3109/08916934.2013.764992. Epub 2013 Feb 25. Autoimmunity. 2013. PMID: 23331132
-
Pathogenesis and significance of glomerular C4d deposition in lupus nephritis: activation of classical and lectin pathways.Int J Clin Exp Pathol. 2013 Sep 15;6(10):2157-67. eCollection 2013. Int J Clin Exp Pathol. 2013. PMID: 24133594 Free PMC article.
-
Lupus nephritis and related renal disease: review from case series.Clin Exp Nephrol. 2025 May;29(5):507-520. doi: 10.1007/s10157-024-02603-6. Epub 2024 Dec 19. Clin Exp Nephrol. 2025. PMID: 39699701 Review.
-
Decipher the Immunopathological Mechanisms and Set Up Potential Therapeutic Strategies for Patients with Lupus Nephritis.Int J Mol Sci. 2023 Jun 13;24(12):10066. doi: 10.3390/ijms241210066. Int J Mol Sci. 2023. PMID: 37373215 Free PMC article. Review.
Cited by
-
Therapeutically targeting proinflammatory type I interferons in systemic lupus erythematosus: efficacy and insufficiency with a specific focus on lupus nephritis.Front Immunol. 2024 Oct 16;15:1489205. doi: 10.3389/fimmu.2024.1489205. eCollection 2024. Front Immunol. 2024. PMID: 39478861 Free PMC article. Review.
-
Lupus Nephritis Biomarkers: A Critical Review.Int J Mol Sci. 2024 Jan 9;25(2):805. doi: 10.3390/ijms25020805. Int J Mol Sci. 2024. PMID: 38255879 Free PMC article. Review.
-
IL-4-Induced Quiescence of Resting Naive B Cells Is Disrupted in Systemic Lupus Erythematosus.J Immunol. 2022 Oct 15;209(8):1513-1522. doi: 10.4049/jimmunol.2200409. Epub 2022 Sep 7. J Immunol. 2022. PMID: 36165181 Free PMC article.
-
Interrelation of T cell cytokines and autoantibodies in systemic lupus erythematosus: A cross-sectional study.Clin Immunol. 2023 Feb;247:109239. doi: 10.1016/j.clim.2023.109239. Epub 2023 Jan 20. Clin Immunol. 2023. PMID: 36682593 Free PMC article.
-
Increased development of T-bet+CD11c+ B cells predisposes to lupus in females: Analysis in BXD2 mouse and genetic crosses.Clin Immunol. 2023 Dec;257:109842. doi: 10.1016/j.clim.2023.109842. Epub 2023 Nov 18. Clin Immunol. 2023. PMID: 37981105 Free PMC article.
References
Publication types
MeSH terms
Substances
Grants and funding
LinkOut - more resources
Full Text Sources
Medical
Research Materials
Miscellaneous
