

Cross-border mobility responses to COVID-19 in Europe: new evidence from facebook data
- PMID: 35436927
- PMCID: PMC9013976
- DOI: 10.1186/s12992-022-00832-6
Cross-border mobility responses to COVID-19 in Europe: new evidence from facebook data
Abstract
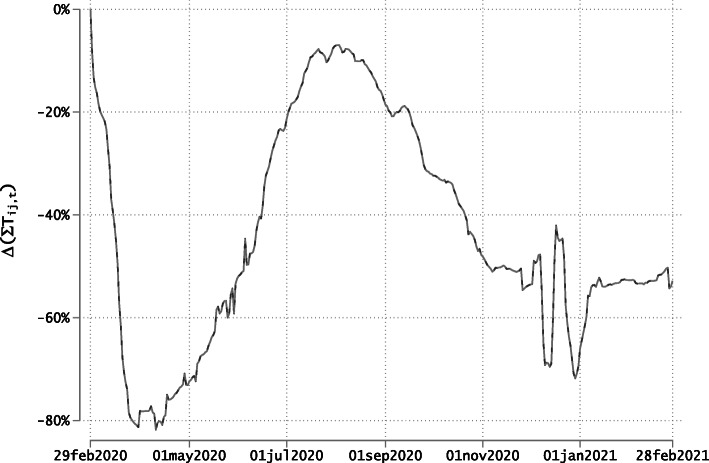
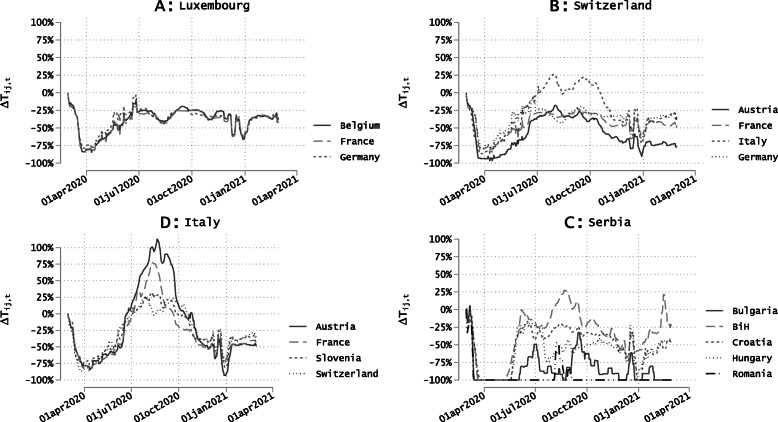
Background: Assessing the impact of government responses to Covid-19 is crucial to contain the pandemic and improve preparedness for future crises. We investigate here the impact of non-pharmaceutical interventions (NPIs) and infection threats on the daily evolution of cross-border movements of people during the Covid-19 pandemic. We use a unique database on Facebook users' mobility, and rely on regression and machine learning models to identify the role of infection threats and containment policies. Permutation techniques allow us to compare the impact and predictive power of these two categories of variables.
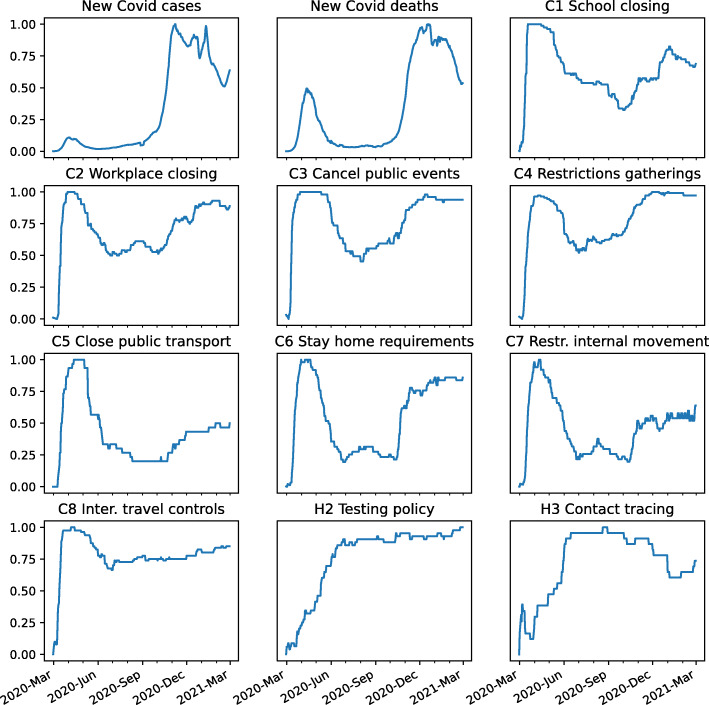
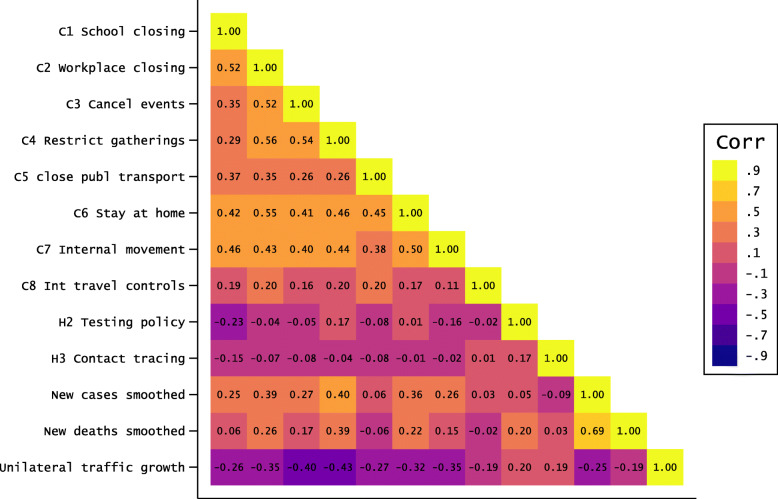
Results: In contrast with studies on within-border mobility, our models point to a stronger importance of containment policies in explaining changes in cross-border traffic as compared with international travel bans and fears of being infected. The latter are proxied by the numbers of Covid-19 cases and deaths at destination. Although the ranking among coercive policies varies across modelling techniques, containment measures in the destination country (such as cancelling of events, restrictions on internal movements and public gatherings), and school closures in the origin country (influencing parental leaves) have the strongest impacts on cross-border movements.
Conclusion: While descriptive in nature, our findings have policy-relevant implications. Cross-border movements of people predominantly consist of labor commuting flows and business travels. These economic and essential flows are marginally influenced by the fear of infection and international travel bans. They are mostly governed by the stringency of internal containment policies and the ability to travel.
Keywords: Containment policies; Covid-19; Cross-border mobility; Non-Parmaceutical interventions.
© 2022. The Author(s).
Conflict of interest statement
The authors declare that they have no competing interests.
Figures
Similar articles
-
International travel-related control measures to contain the COVID-19 pandemic: a rapid review.Cochrane Database Syst Rev. 2021 Mar 25;3(3):CD013717. doi: 10.1002/14651858.CD013717.pub2. Cochrane Database Syst Rev. 2021. PMID: 33763851 Free PMC article.
-
How does globalization affect COVID-19 responses?Global Health. 2021 May 20;17(1):57. doi: 10.1186/s12992-021-00677-5. Global Health. 2021. PMID: 34016146 Free PMC article.
-
Travel-related control measures to contain the COVID-19 pandemic: a rapid review.Cochrane Database Syst Rev. 2020 Oct 5;10:CD013717. doi: 10.1002/14651858.CD013717. Cochrane Database Syst Rev. 2020. Update in: Cochrane Database Syst Rev. 2021 Mar 25;3:CD013717. doi: 10.1002/14651858.CD013717.pub2. PMID: 33502002 Updated.
-
Using volunteered geographic information to assess mobility in the early phases of the COVID-19 pandemic: a cross-city time series analysis of 41 cities in 22 countries from March 2nd to 26th 2020.Global Health. 2020 Sep 23;16(1):85. doi: 10.1186/s12992-020-00598-9. Global Health. 2020. PMID: 32967691 Free PMC article.
-
Preparing for a future COVID-19 wave: insights and limitations from a data-driven evaluation of non-pharmaceutical interventions in Germany.Sci Rep. 2020 Nov 18;10(1):20084. doi: 10.1038/s41598-020-76244-6. Sci Rep. 2020. PMID: 33208764 Free PMC article.
Cited by
-
Cross-border mobility in the Meuse-Rhine Euroregion: impact of COVID-19 border restrictions on everyday activities and visiting social network members.Front Public Health. 2024 Apr 18;12:1281072. doi: 10.3389/fpubh.2024.1281072. eCollection 2024. Front Public Health. 2024. PMID: 38726234 Free PMC article.
-
COVID-19 crisis management in Luxembourg: Insights from an epidemionomic approach.Econ Hum Biol. 2021 Dec;43:101051. doi: 10.1016/j.ehb.2021.101051. Epub 2021 Jul 31. Econ Hum Biol. 2021. PMID: 34411841 Free PMC article.
-
Improving testing capacity for COVID-19: experiences and lessons from Senegal, Uganda, Nigeria, and the Democratic Republic of Congo.Front Public Health. 2023 Nov 16;11:1202966. doi: 10.3389/fpubh.2023.1202966. eCollection 2023. Front Public Health. 2023. PMID: 38045972 Free PMC article.
-
Human mobility and the infectious disease transmission: A systematic review.Geo Spat Inf Sci. 2024;27(6):1824-1851. doi: 10.1080/10095020.2023.2275619. Epub 2023 Nov 29. Geo Spat Inf Sci. 2024. PMID: 40046953 Free PMC article.
-
Social media mining under the COVID-19 context: Progress, challenges, and opportunities.Int J Appl Earth Obs Geoinf. 2022 Sep;113:102967. doi: 10.1016/j.jag.2022.102967. Epub 2022 Aug 19. Int J Appl Earth Obs Geoinf. 2022. PMID: 36035895 Free PMC article.
References
-
- Zhang A, Wang A. Human Mobility and Smart City. Sch Community Encycl. 2021. https://encyclopedia.pub/entry/6764. Accessed 12 04 2022.
-
- Caselli F, Grigoli F, Sandri D, Spilimbergo A. Mobility under the COVID-19 pandemic: Asymmetric effects across gender and age. IMF Econ Rev. 2020;70(1):105–38. doi: 10.1057/s41308-021-00149-1. - DOI
-
- Maloney WF, Taskin T. Determinants of Social Distancing and Economic Activity During COVID-19: A Global View. Rochester: Social Science Research Network; 2020.
Publication types
MeSH terms
LinkOut - more resources
Full Text Sources
Medical
