. 2022 Apr 18;21(1):54.
doi: 10.1186/s12933-022-01484-x.

Bilirubin as an indicator of cardiometabolic health: a cross-sectional analysis in the UK Biobank

Affiliations

Bilirubin as an indicator of cardiometabolic health: a cross-sectional analysis in the UK Biobank

Nazlisadat Seyed Khoei et al. Cardiovasc Diabetol. .

Abstract

Background: Mildly elevated bilirubin, a by-product of hemoglobin breakdown, might mitigate cardiometabolic risk factors including adiposity, dyslipidemia, and high blood pressure (BP). We investigated the cross-sectional relationship between (total) bilirubin and baseline cardiometabolic risk factors in 467,519 UK Biobank study participants.

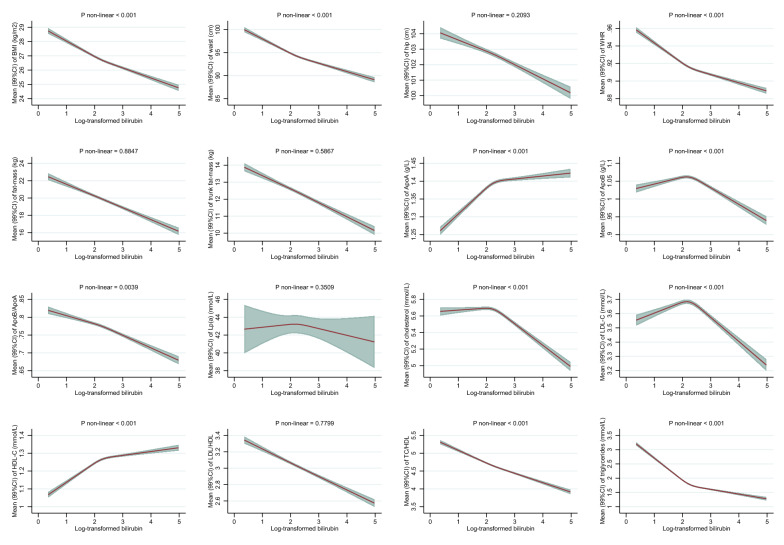
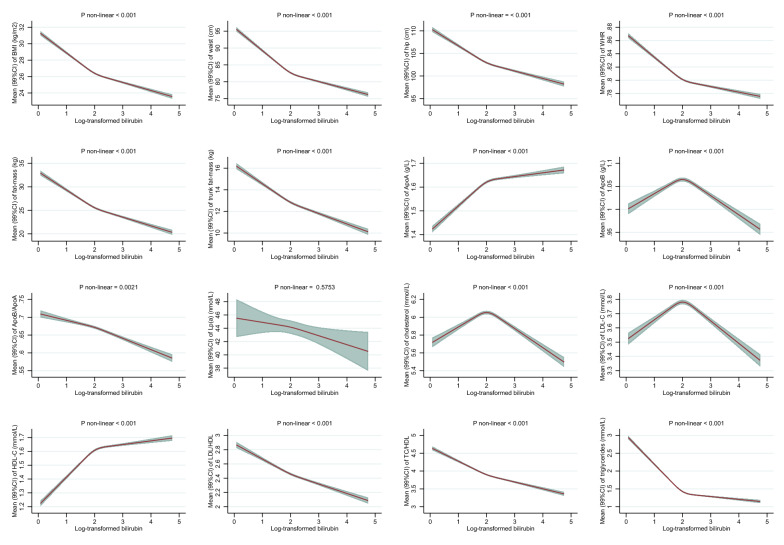
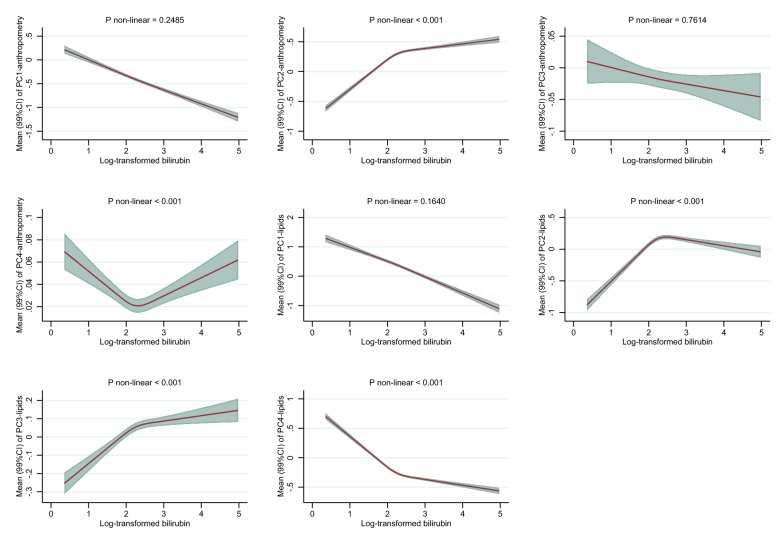
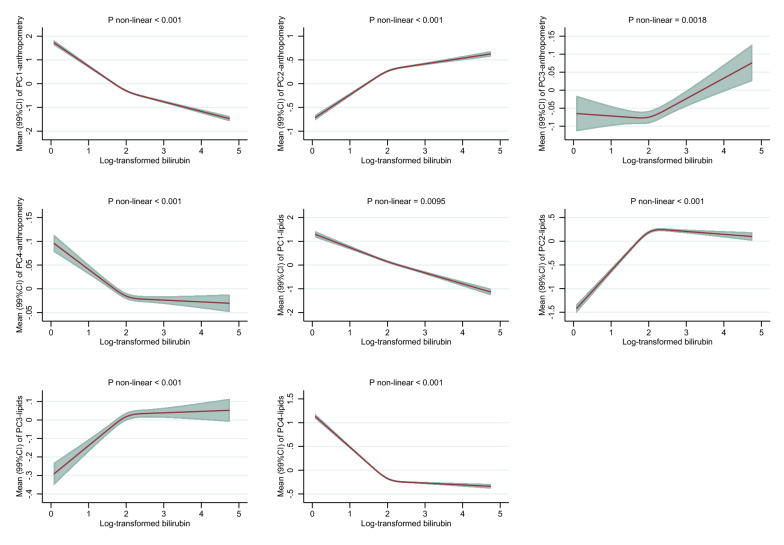
Methods: We used multivariable-adjusted linear regression to estimate associations between bilirubin levels and risk factors of cardiometabolic diseases including body mass index (BMI), waist and hip circumferences (WC, HC), waist-to-hip ratio (WHR), fat mass (FM), and trunk FM, and the blood lipids: apolipoprotein A-I (apoA-I), apolipoprotein B (apoB), apoB/apoA-I, lipoprotein (a), total cholesterol (TC), low-density lipoprotein cholesterol (LDL-C), high-density lipoprotein cholesterol (HDL-C), LDL/HDL, TC/HDL, triglycerides (TG). Log-transformed bilirubin was modelled with restricted cubic splines and predicted mean values with 99% confidence intervals (CI) for each risk marker were estimated, separately. Second, we applied principal component analysis (PCA) for dimension reduction to in turn six anthropometric traits (height, weight, BMI, WC, HC, and WHR) and all above lipids. Last, we estimated associations (99%CI) between bilirubin and three components of the metabolic syndrome, i.e. WC, TG, and BP using logistic regression.

Results: After multivariable adjustments, higher levels of bilirubin were inversely associated with indicators of general adiposity (BMI and FM) and of body fat distribution (WC, HC, WHR, and trunk FM) in both men and women. For example, women with mildly elevated bilirubin (95th percentile equal to 15.0 µmol/L), compared to women with low bilirubin (5th percentile equal to 4.5 µmol/L), had on average a 2.0 kg/m2 (99% CI 1.9-2.1) lower BMI. Inverse associations were also observed with dyslipidemia among men and women. For example, mildly elevated bilirubin among men (95th percentile equal to 19.4 µmol/L) compared to low levels of bilirubin (5th percentile equal to 5.5 µmol/L) were associated with approx. 0.55 mmol/L (99% CI 0.53-0.56) lower TG levels, with similar inverse associations among women. Multiple-trait analyses using PCA confirmed single-trait analyses. Men and women with mildly elevated bilirubin levels ≥ 17.1 µmol/L, compared to low-normal bilirubin < 10 µmol/L had 13% (99% CI 8%-18%) and 11% (99% CI 4%-17%) lower odds of exceeding systolic BP levels of ≥ 130 mm Hg, respectively.

Conclusions: Higher levels of bilirubin were inversely associated with cardiometabolic risk factors including adiposity, dyslipidemia, and hypertension.

Keywords: Bilirubin; Metabolic syndrome; Obesity; UK Biobank.


Conflict of interest statement

The authors declare that they have no competing interests.

Figures

Fig. 1
Fig. 1
A Associations between total bilirubin concentrations and anthropometric measures and lipid profile among men in the UK Biobank. BMI: body mass index, WHR: waist-hip ratio, ApoA-I: apolipoprotein A-I, ApoB: apolipoprotein B, Lp (a): lipoprotein (a), LDL-C: low-density lipoprotein cholesterol, HDL-C: high-density lipoprotein cholesterol. Associations were estimated for each outcome by modelling log-transformed bilirubin with restricted cubic splines (3 knots at 10th, 50th, and 90th percentile) allowing for non-linear associations (adjusted for age at recruitment, ethnicity, alcohol consumption, alcohol consumption frequency, smoking status, physical activity, liver enzyme (alanine transaminase), chronic diseases (heart problems and diabetes), medications (for cholesterol, blood pressure, diabetes, or exogenous hormones), qualifications, and ever use of hormones among women). P-values for non-linearity were computed with log-likelihood ratio tests comparing the spline model to a linear model. P-values < 0.001 were judged as evidence against linearity. Associations are presented as predicted mean values and 99% confidence intervals (CI). Levels of (total) bilirubin among men at 5th, 10th (1st knot), 50th (2nd knot), 90th (3rd knot), and 95th were 5.45, 6.08, 9.13, 15.51, and 19.42 on original scale (µmol/L) and 1.70, 1.81, 2.21, 2.74, and 2.97 on log-scale, respectively. B Associations between total bilirubin concentrations and anthropometric measures and blood lipid concentrations among women in the UK Biobank. BMI: body mass index, WHR: waist-hip ratio, ApoA-I: apolipoprotein A-I, ApoB: apolipoprotein B, Lp (a): lipoprotein (a), LDL-C: low-density lipoprotein cholesterol, HDL-C: high-density lipoprotein cholesterol. Associations were estimated for each outcome by modelling log-transformed bilirubin with restricted cubic splines (3 knots at 10th, 50th, and 90th percentile) allowing for non-linear associations (adjusted for age at recruitment, ethnicity, alcohol consumption, alcohol consumption frequency, smoking status, physical activity, liver enzyme (alanine transaminase), chronic diseases (heart problems and diabetes), medications (for cholesterol, blood pressure, diabetes, or exogenous hormones), qualifications, and ever use of hormones among women). P-values for non-linearity were computed with log-likelihood ratio tests comparing the spline model to a linear model. P-values < 0.001 were judged as evidence against linearity. Associations are presented as predicted mean values and 99% confidence intervals (CI). Levels of (total) bilirubin among women at 5th, 10th (1st knot), 50th (2nd knot), 90th (3rd knot), and 95th were 4.46, 4.94, 7.26, 12.07, and 15.02 on original scale (µmol/L) and 1.50, 1.60, 1.98, 2.49, and 2.71 on log-scale, respectively
Fig. 1
Fig. 1
A Associations between total bilirubin concentrations and anthropometric measures and lipid profile among men in the UK Biobank. BMI: body mass index, WHR: waist-hip ratio, ApoA-I: apolipoprotein A-I, ApoB: apolipoprotein B, Lp (a): lipoprotein (a), LDL-C: low-density lipoprotein cholesterol, HDL-C: high-density lipoprotein cholesterol. Associations were estimated for each outcome by modelling log-transformed bilirubin with restricted cubic splines (3 knots at 10th, 50th, and 90th percentile) allowing for non-linear associations (adjusted for age at recruitment, ethnicity, alcohol consumption, alcohol consumption frequency, smoking status, physical activity, liver enzyme (alanine transaminase), chronic diseases (heart problems and diabetes), medications (for cholesterol, blood pressure, diabetes, or exogenous hormones), qualifications, and ever use of hormones among women). P-values for non-linearity were computed with log-likelihood ratio tests comparing the spline model to a linear model. P-values < 0.001 were judged as evidence against linearity. Associations are presented as predicted mean values and 99% confidence intervals (CI). Levels of (total) bilirubin among men at 5th, 10th (1st knot), 50th (2nd knot), 90th (3rd knot), and 95th were 5.45, 6.08, 9.13, 15.51, and 19.42 on original scale (µmol/L) and 1.70, 1.81, 2.21, 2.74, and 2.97 on log-scale, respectively. B Associations between total bilirubin concentrations and anthropometric measures and blood lipid concentrations among women in the UK Biobank. BMI: body mass index, WHR: waist-hip ratio, ApoA-I: apolipoprotein A-I, ApoB: apolipoprotein B, Lp (a): lipoprotein (a), LDL-C: low-density lipoprotein cholesterol, HDL-C: high-density lipoprotein cholesterol. Associations were estimated for each outcome by modelling log-transformed bilirubin with restricted cubic splines (3 knots at 10th, 50th, and 90th percentile) allowing for non-linear associations (adjusted for age at recruitment, ethnicity, alcohol consumption, alcohol consumption frequency, smoking status, physical activity, liver enzyme (alanine transaminase), chronic diseases (heart problems and diabetes), medications (for cholesterol, blood pressure, diabetes, or exogenous hormones), qualifications, and ever use of hormones among women). P-values for non-linearity were computed with log-likelihood ratio tests comparing the spline model to a linear model. P-values < 0.001 were judged as evidence against linearity. Associations are presented as predicted mean values and 99% confidence intervals (CI). Levels of (total) bilirubin among women at 5th, 10th (1st knot), 50th (2nd knot), 90th (3rd knot), and 95th were 4.46, 4.94, 7.26, 12.07, and 15.02 on original scale (µmol/L) and 1.50, 1.60, 1.98, 2.49, and 2.71 on log-scale, respectively
Fig. 2
Fig. 2
A. Associations between total bilirubin concentrations and PCanthropometry and PClipids among men in the UK Biobank. BMI: body mass index, WHR: waist-hip ratio, ApoA-I: apolipoprotein A, ApoB: apolipoprotein B, Lp (a): lipoprotein (a), LDL-C: low-density lipoprotein cholesterol, HDL-C: high-density lipoprotein cholesterol. PC1anthropometry: General adiposity, PC2anthropometry: Tall with low waist-to-hip ratio, PC3anthropometry: Tall with high waist-to-hip ratio, PC4anthropometry: High BMI and weight, with relatively small hip and waist circumference. PC1lipids: Dyslipidemia, PC2lipids: Anti-atherogenic, PC3lipids: High levels of lipoprotein (a), PC4lipids: High levels of triglycerides. Associations were estimated for each outcome by modelling log-transformed bilirubin with restricted cubic splines (3 knots at 10th, 50th, and 90th percentile) allowing for non-linear associations (adjusted for age at recruitment, ethnicity, alcohol consumption, alcohol consumption frequency, smoking status, physical activity, liver enzyme (alanine transaminase), chronic diseases (heart problems and diabetes), medications (for cholesterol, blood pressure, diabetes, or exogenous hormones), qualifications, and ever use of hormones among women). P-values for non-linearity were computed with log-likelihood ratio tests comparing the spline model to a linear model. P-values < 0.001 were judged as evidence against linearity. Associations are presented as predicted mean values and 99% confidence intervals (CI). Levels of (total) bilirubin among men at 5th, 10th (1st knot), 50th (2nd knot), 90th (3rd knot), and 95th were 5.45, 6.08, 9.13, 15.51, and 19.42 on original scale (umol/L) and 1.70, 1.81, 2.21, 2.74, and 2.97 on log-scale, respectively. B Associations between total bilirubin concentrations and PCanthropometry and PClipids concentrations among women in the UK Biobank. BMI: body mass index, WHR: waist-hip ratio, ApoA-I: apolipoprotein A, ApoB: apolipoprotein B, Lp (a): lipoprotein (a), LDL-C: low-density lipoprotein cholesterol, HDL-C: high-density lipoprotein cholesterol. PC1anthropometry: General adiposity, PC2anthropometry: Tall with low waist-to-hip ratio, PC3anthropometry: Tall with high waist-to-hip ratio, PC4anthropometry: High BMI and weight, with relatively small hip and waist circumference. PC1lipids: Dyslipidemia, PC2lipids: Anti-atherogenic, PC3lipids: High levels of lipoprotein (a), PC4lipids: High levels of triglycerides. Associations were estimated for each outcome by modelling log-transformed bilirubin with restricted cubic splines (3 knots at 10th, 50th, and 90th percentile) allowing for non-linear associations (adjusted for age at recruitment, ethnicity, alcohol consumption, alcohol consumption frequency, smoking status, physical activity, liver enzyme (alanine transaminase), chronic diseases (heart problems and diabetes), medications (for cholesterol, blood pressure, diabetes, or exogenous hormones), qualifications, and ever use of hormones among women). P-values for non-linearity were computed with log-likelihood ratio tests comparing the spline model to a linear model. P-values < 0.001 were judged as evidence against linearity. Associations are presented as predicted mean values and 99% confidence intervals (CI). Levels of (total) bilirubin among women at 5th, 10th (1st knot), 50th (2nd knot), 90th (3rd knot), and 95th were 4.46, 4.94, 7.26, 12.07, and 15.02 on original scale (umol/L) and 1.50, 1.60, 1.98, 2.49, and 2.71 on log-scale, respectively
Fig. 2
Fig. 2
A. Associations between total bilirubin concentrations and PCanthropometry and PClipids among men in the UK Biobank. BMI: body mass index, WHR: waist-hip ratio, ApoA-I: apolipoprotein A, ApoB: apolipoprotein B, Lp (a): lipoprotein (a), LDL-C: low-density lipoprotein cholesterol, HDL-C: high-density lipoprotein cholesterol. PC1anthropometry: General adiposity, PC2anthropometry: Tall with low waist-to-hip ratio, PC3anthropometry: Tall with high waist-to-hip ratio, PC4anthropometry: High BMI and weight, with relatively small hip and waist circumference. PC1lipids: Dyslipidemia, PC2lipids: Anti-atherogenic, PC3lipids: High levels of lipoprotein (a), PC4lipids: High levels of triglycerides. Associations were estimated for each outcome by modelling log-transformed bilirubin with restricted cubic splines (3 knots at 10th, 50th, and 90th percentile) allowing for non-linear associations (adjusted for age at recruitment, ethnicity, alcohol consumption, alcohol consumption frequency, smoking status, physical activity, liver enzyme (alanine transaminase), chronic diseases (heart problems and diabetes), medications (for cholesterol, blood pressure, diabetes, or exogenous hormones), qualifications, and ever use of hormones among women). P-values for non-linearity were computed with log-likelihood ratio tests comparing the spline model to a linear model. P-values < 0.001 were judged as evidence against linearity. Associations are presented as predicted mean values and 99% confidence intervals (CI). Levels of (total) bilirubin among men at 5th, 10th (1st knot), 50th (2nd knot), 90th (3rd knot), and 95th were 5.45, 6.08, 9.13, 15.51, and 19.42 on original scale (umol/L) and 1.70, 1.81, 2.21, 2.74, and 2.97 on log-scale, respectively. B Associations between total bilirubin concentrations and PCanthropometry and PClipids concentrations among women in the UK Biobank. BMI: body mass index, WHR: waist-hip ratio, ApoA-I: apolipoprotein A, ApoB: apolipoprotein B, Lp (a): lipoprotein (a), LDL-C: low-density lipoprotein cholesterol, HDL-C: high-density lipoprotein cholesterol. PC1anthropometry: General adiposity, PC2anthropometry: Tall with low waist-to-hip ratio, PC3anthropometry: Tall with high waist-to-hip ratio, PC4anthropometry: High BMI and weight, with relatively small hip and waist circumference. PC1lipids: Dyslipidemia, PC2lipids: Anti-atherogenic, PC3lipids: High levels of lipoprotein (a), PC4lipids: High levels of triglycerides. Associations were estimated for each outcome by modelling log-transformed bilirubin with restricted cubic splines (3 knots at 10th, 50th, and 90th percentile) allowing for non-linear associations (adjusted for age at recruitment, ethnicity, alcohol consumption, alcohol consumption frequency, smoking status, physical activity, liver enzyme (alanine transaminase), chronic diseases (heart problems and diabetes), medications (for cholesterol, blood pressure, diabetes, or exogenous hormones), qualifications, and ever use of hormones among women). P-values for non-linearity were computed with log-likelihood ratio tests comparing the spline model to a linear model. P-values < 0.001 were judged as evidence against linearity. Associations are presented as predicted mean values and 99% confidence intervals (CI). Levels of (total) bilirubin among women at 5th, 10th (1st knot), 50th (2nd knot), 90th (3rd knot), and 95th were 4.46, 4.94, 7.26, 12.07, and 15.02 on original scale (umol/L) and 1.50, 1.60, 1.98, 2.49, and 2.71 on log-scale, respectively

Similar articles

Cited by

References

    1. Collaborators. Global, regional, and national comparative risk assessment of 79 behavioural, environmental and occupational, and metabolic risks or clusters of risks, 1990–2015: a systematic analysis for the Global Burden of Disease Study 2015. Lancet (London, England). 2016;388(10053):1659–724. - PMC - PubMed
    1. Ridderstråle M, Gudbjörnsdottir S, Eliasson B, Nilsson PM, Cederholm J. Obesity and cardiovascular risk factors in type 2 diabetes: results from the Swedish National Diabetes Register. J Intern Med. 2006;259(3):314–322. doi: 10.1111/j.1365-2796.2006.01617.x. - DOI - PubMed
    1. Hill MJ, Metcalfe D, McTernan PG. Obesity and diabetes: lipids, 'nowhere to run to'. Clinical science (London, England: 1979). 2009;116(2):113–23. doi: 10.1042/CS20080050. - DOI - PubMed
    1. Hinds TD, Jr, Stec DE. Bilirubin, a cardiometabolic signaling molecule. Hypertension (Dallas, Tex: 1979). 2018;72(4):788–95. doi: 10.1161/HYPERTENSIONAHA.118.11130. - DOI - PMC - PubMed
    1. Boon AC, Bulmer AC, Coombes JS, Fassett RG. Circulating bilirubin and defense against kidney disease and cardiovascular mortality: mechanisms contributing to protection in clinical investigations. Am J Physiol Renal Physiol. 2014;307(2):F123–F136. doi: 10.1152/ajprenal.00039.2014. - DOI - PubMed