. 2022 Apr 18;13(4):356.
doi: 10.1038/s41419-022-04834-5.

An obesogenic feedforward loop involving PPARγ, acyl-CoA binding protein and GABAA receptor

Affiliations

An obesogenic feedforward loop involving PPARγ, acyl-CoA binding protein and GABAA receptor

Gerasimos Anagnostopoulos et al. Cell Death Dis. .

Erratum in

  • Correction: An obesogenic feedforward loop involving PPARγ, acyl-CoA binding protein and GABA receptor.
    Anagnostopoulos G, Motiño O, Li S, Carbonnier V, Chen H, Sica V, Durand S, Bourgin M, Aprahamian F, Nirmalathasan N, Donne R, Desdouets C, Sola MS, Kotta K, Montégut L, Lambertucci F, Surdez D, Sandrine G, Delattre O, Maiuri MC, Bravo-San Pedro JM, Martins I, Kroemer G. Anagnostopoulos G, et al. Cell Death Dis. 2022 May 3;13(5):430. doi: 10.1038/s41419-022-04884-9. Cell Death Dis. 2022. PMID: 35504865 Free PMC article. No abstract available.

Abstract

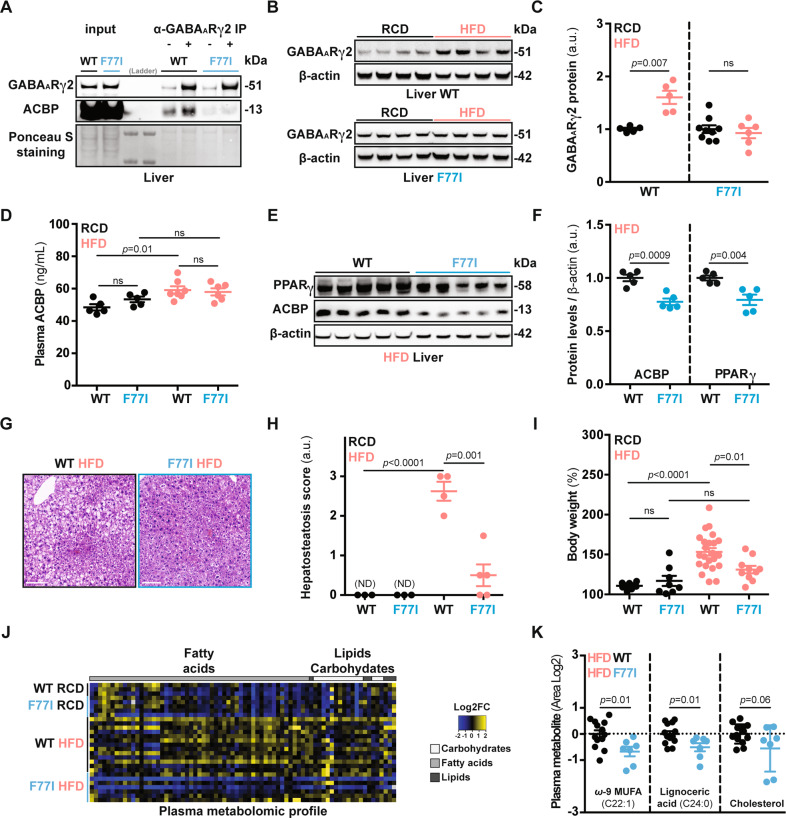
Acyl-coenzyme-A-binding protein (ACBP), also known as a diazepam-binding inhibitor (DBI), is a potent stimulator of appetite and lipogenesis. Bioinformatic analyses combined with systematic screens revealed that peroxisome proliferator-activated receptor gamma (PPARγ) is the transcription factor that best explains the ACBP/DBI upregulation in metabolically active organs including the liver and adipose tissue. The PPARγ agonist rosiglitazone-induced ACBP/DBI upregulation, as well as weight gain, that could be prevented by knockout of Acbp/Dbi in mice. Moreover, liver-specific knockdown of Pparg prevented the high-fat diet (HFD)-induced upregulation of circulating ACBP/DBI levels and reduced body weight gain. Conversely, knockout of Acbp/Dbi prevented the HFD-induced upregulation of PPARγ. Notably, a single amino acid substitution (F77I) in the γ2 subunit of gamma-aminobutyric acid A receptor (GABAAR), which abolishes ACBP/DBI binding to this receptor, prevented the HFD-induced weight gain, as well as the HFD-induced upregulation of ACBP/DBI, GABAAR γ2, and PPARγ. Based on these results, we postulate the existence of an obesogenic feedforward loop relying on ACBP/DBI, GABAAR, and PPARγ. Interruption of this vicious cycle, at any level, indistinguishably mitigates HFD-induced weight gain, hepatosteatosis, and hyperglycemia.


Conflict of interest statement

GK has been holding research contracts with Daiichi Sankyo, Eleor, Kaleido, Lytix Pharma, PharmaMar, Samsara, Sanofi, Sotio, Tollys, Vascage, and Vasculox/Tioma. GK is on the Board of Directors of the Bristol Myers Squibb Foundation France and scientific co-founder of EverImmune, Samsara Therapeutics, Therafast Bio. GK is the inventor of patents covering therapeutic targeting of aging, cancer, cystic fibrosis, and metabolic disorders. GK, JMB-SP, and OM are inventors of patents covering the therapeutic use of anti-ACBP/DBI antibodies. GK is the founder of Osasuna Therapeutics, which targets ACBP/DBI.

Figures

Fig. 1
Fig. 1. PPARγ transcription factor regulates the expression of ACBP.
A Heatmap representation of correlation (R) between ACBP mRNA and mRNA of several genes in the human liver, subcutaneous white adipose tissue (scWAT), and visceral white adipose tissue (viscWAT) (*p < 0.05). B Correlation plots of PPARG and ACBP mRNA in liver and WAT from human (liver: n = 179, visceral WAT: n = 355), mouse (liver: n = 179, epididymal WAT: n = 56), and rat (liver: n = 207, epididymal WAT: n = 47) extracts. Correlation plots of PPARG and ACBP mRNA in subcutaneous white adipose tissue (n = 442), skeletal muscle (n = 304), and the aggregate of all tissues (n = 7172) from human origin. C Venn diagram representation includes transcription factors (TFs) the targets of which are upregulated in bovine adipocytes, murine hepatocytes, and human leukocytes when their donors receive a high-fat diet (left). Significance of the upregulation of PPARγ target genes in each of the three datasets (right). D Chromatin immunoprecipitation sequencing (ChIP-seq) signals of PPARγ and H3K4me3 (Acbp promoter, mouse liver, n = 3). The black line corresponds to the peaks called per MACS. E Silencing of TFs encoding human ACBP in HepG2 cells. F Cytofluorometric peaks quantifying ACBP after silencing the unrelated negative control, ACBP, or PPARG (siUNR, siACBP, or siPPARG). G Heatmap representation of cytofluorometric ACBP protein levels upon silencing various TFs encoding ACBP in HepG2 cells (n = 3; one-way ANOVA). For statistical analyses (A, B) p values and R were calculated by Pearson and Spearman correlations respectively. See also Fig. S1.
Fig. 2
Fig. 2. The effects of PPARγ-modulating agents depend on ACBP function.
A Cytofluorometric measurement of ACBP protein after treatment with PPARγ agonists (Ctr: vehicle, Rosi: rosiglitazone, GW1929, S26948, Eda: edaglitazone) (n = 6) in control (siUNR) or PPARG-silenced (siPPARG) HepG2 cells (n = 5) (B) (MFI: mean fluorescence intensity normalized to control). C Representative immunoblot images of PPARγ, ACBP, and β-actin proteins in control (shUNR) and Acbp-knocked down (shAcbp) Hep55.1c cells after treatment with vehicle or Rosi (48 h), densitometric quantification (n = 3) (D, E). F Pparg and Acbp mRNA expression measurements in liver extracts obtained from mice receiving Rosi or vehicle (5 days) (n = 10 to 13 mice per condition). G Plasma ACBP concentration (n = 7 to 12 mice per condition), and H body weight measurements from mice receiving Rosi or vehicle (5 days) (n = 7 to 8 mice per condition). I Liver representative immunoblot images of FASN, PPARγ, ACBP, and β-actin proteins from ACBP-control (ubi:Acbp WT) or ACBP knockout (ubi:Acbp KO) mice receiving vehicle or Rosi (5 days), densitometric quantification (n = 4 to 8 mice per condition) (JL). M Body weight measurements from mice administrated with Rosi or vehicle (2 months) (n = 4 to 6 mice per condition). Results are displayed as whisker plots (with each dot representing one in vitro biological replicate or one single mouse) including the mean ± SEM. For statistical analyses, p values (indicating statistical comparisons with the control condition) were calculated by a two-tailed unpaired Student’s t-test. For statistical analysis p values were calculated by two-tailed unpaired Student’s t-test (G, H, JL) applying Welch correction (F), one-way ANOVA (A, B), or two-way ANOVA (D, E, M). MFI mean fluorescence intensity, a.u. arbitrary units, kDa kilodaltons, sh short-hairpin, ubi ubiquitous, ns non-significant. See also Fig. S2.
Fig. 3
Fig. 3. Pharmacological and dietary PPARγ manipulations regulate the expression of Acbp.
A Liver representative immunoblot images of PPARγ, ACBP, FASN, and β-actin proteins from mice receiving control (Vehicle), or RXRα agonist Bexarotene (Bex), densitometric quantification (n = 4 to 9 mice per condition) (B). C Liver representative immunoblot images of PPARγ, ACBP, FASN, and β-actin proteins from mice receiving control (Vehicle), or RXRα antagonist HX531 drugs (5 days), densitometric quantification (n = 4 to 8 mice per condition) (D). E Qualitative α-PPARγ chromatin immunoprecipitation (ChIP) analysis from liver extracts obtained from mice receiving regular-chow (RCD) or high-fat diet (HFD). ChIP PCR products in the case of DNA templates originated from chromatin samples that have been precipitated with a PPARγ-specific antibody (α-PPARγ). No product in chromatin samples precipitated with negative isotype control (IgG). No ChIP PCR product in the α-PPARγ sample originating from the whole-body PPARγ knockout mice (ubi:Cre PPARγ KO) (n = 3 per condition). F Quantitative analysis of ChIP Real-Time PCR (n = 4 to 8 mice per condition). G, H Liver and K, L epididymal white adipose tissue (eWAT) Pparg and Acbp mRNA expression measurements obtained from mice receiving RCD or HFD (6 weeks) (n = 7 to 13 mice per condition). I Liver representative immunoblot images of FASN, PPARγ, ACBP, and β-actin proteins from mice receiving RCD or HFD (6 weeks), densitometric quantification (n = 5 mice per condition) (J). Results are displayed as whisker plots (with each dot representing one single mouse) including the mean ± SEM. For statistical analysis p values were calculated by two-tailed unpaired Student’s t-test (G, H, K, L) applying Welch correction (B, D, J), or two-way ANOVA (F). kDa kilodaltons, a.u. arbitrary units, bp base pairs, ns non-significant. See also Fig. S3.
Fig. 4
Fig. 4. Liver-specific PPARγ knockout yields decreased ACBP levels.
A Pparg mRNA expression (n = 5 to 15 mice per condition) and B, C protein level measurements (n = 4 to 7 mice per condition) in liver extracts obtained from control (PPARγ WT) or liver-specific CRISPR/Cas9-mediated PPARγ-knockdown mice (PPARγ KD) receiving regular-chow (RCD) or high-fat diet (HFD). For statistical analysis (C) p values were calculated comparing HFD groups to the corresponding RCD group for each genetic background (PPARγ WT, PPARγ KD). D Acbp mRNA expression (n = 5 to 13 mice per condition), E plasma ACBP concentration (n = 5 to 15 mice per condition), and F body weight gain measurements in control or PPARγ KD mice rendered obese (HFD, 2 months) (n = 9 to 10 mice per condition). G Representative hematoxylin eosin (HE) images of control or PPARγ KD livers (n = 15 to 25 mice per condition) obtained from mice receiving RCD or HFD, hepatosteatosis score quantification (bar: 50 μm, ND non-detected) (H). I Fasted blood glucose concentration from control or liver-PPARγ KD mice receiving RCD or HFD (n = 9 to 10 mice per condition). Results are displayed as whisker plots (with each dot representing one single mouse) including the mean ± SEM. For statistical analysis p values were calculated by two-tailed unpaired Student’s t-test (C), two-way ANOVA (A, DF, I), or Mann–Whitney test (H). kDa kilodaltons, a.u. arbitrary units, ns non-significant, ND non-detected. See also Fig. S4.
Fig. 5
Fig. 5. Neutralization or genetic ablation of ACBP results in decreased PPARγ.
A ACBP-neutralizing antibody (α-ACBP) or isotype control (Iso) was administered in vivo by intraperitoneal injection in mice fed with regular-chow (RCD) or high-fat diet (HFD). B Acbp mRNA expression measurement in liver extracts obtained from mice receiving Iso or α-ACBP in RCD or HFD feeding regimens (n = 5 to 9 mice per condition). C Plasma ACBP concentration measurement in Iso—or α-ACBP – treated mice (n = 8 to 10 mice per condition). D, F Liver, epididymal white adipose tissue (eWAT), and brown adipose tissue (BAT) representative immunoblot images of PPARγ and β-actin proteins from mice receiving Iso or α-ACBP (RCD or HFD), densitometric quantification (RCD: n = 5 to 10 mice per condition, HFD: n = 4 to 10 mice per condition) (E, G). H Fasted blood glucose concentration from mice receiving Iso or α-ACBP (RCD or HFD) (n = 5 to 10 mice per condition). I, J eWAT and BAT representative immunoblot images of PPARγ and β-actin proteins from adipocyte-specific ACBP knockout murine model (adipo: Acbp KO) compared to control (adipo: Acbp WT), densitometric quantification (n = 5 to 7 mice per condition) (K, L). Results are displayed as whisker plots (with each dot representing one single mouse) including the mean ± SEM. For statistical analysis p values were calculated by two-tailed unpaired Student’s t-test (C, E, G, K, L) or two-way ANOVA (B, H). a.u. arbitrary units, ns non-significant, kDa kilodaltons. See also Fig. S5.
Fig. 6
Fig. 6. Metabolic effects of GABAAR – ACBP compromised signaling.
A Co-immunoprecipitation (co-IP) describing the physical interaction between the ACBP and the GABAAR γ2 subunit in liver extracts from mice subjected to a high-fat diet (n = 3 per condition). B Liver representative immunoblot images of GABAAR γ2 subunit and β-actin proteins from mice receiving regular-chow (RCD) or high-fat diet (HFD) (1 month), densitometric quantification (n = 5 to 9 mice per condition) (C). D Plasma ACBP concentration measurement from WT and F77I mice fed with RCD or HFD (1 month) (n = 5 to 7 mice per condition). E Liver representative immunoblot images of PPARγ and ACBP proteins from WT and F77I mice receiving HFD (1 month), densitometric quantification (n = 5 mice per condition) (F). G Representative HE images of liver sections, H hepatosteatosis score quantification from WT or F77I mice after 1 month of HFD (bar: 50 μm, ND non-detected) (n = 3 to 5 mice per condition). I Body weight measurement from WT and F77I mice fed with RCD or HFD (n = 8 to 23 mice per group). J Heatmap representation of fatty acid, lipid, and carbohydrate plasma concentrations depicted as Area log2-fold change (Area Log2FC) from WT or F77I mice fed with RCD or HFD (1 month) (n = 3 to 13 mice per condition) followed by quantification of representative lipid metabolism-related metabolites (K). Results are displayed as whisker plots (with each dot representing one single mouse) including the mean ± SEM. For statistical analysis p values were calculated by two-tailed unpaired Student’s t-test (F, K) applying Welch correction (C), two-way ANOVA (D, I), or Mann–Whitney test (H). kDa kilodaltons, a.u. arbitrary units, ns non-significant, ND non-detected. See also Fig. S6.

References

    1. Bentham J, Di Cesare M, Bilano V, Bixby H, Zhou B, Stevens GA, et al. Worldwide trends in body-mass index, underweight, overweight, and obesity from 1975 to 2016: a pooled analysis of 2416 population-based measurement studies in 128·9 million children, adolescents, and adults. Lancet. 2017;390:2627–42. - PMC - PubMed
    1. Swinburn BA, Kraak VI, Allender S, Atkins VJ, Baker PI, Bogard JR, et al. The global syndemic of obesity, undernutrition, and climate change: the Lancet Commission report. Lancet. 2019;393:791–846. - PubMed
    1. De Araujo IE, Schatzker M, Small DM. Rethinking food reward. Annu Rev Psychol. 2020;71:24.1–24.26. - PubMed
    1. Arpana Gupta VO. Brain–gut–microbiome interactions in obesity and food addiction. Physiol Behav. 2017;176:100–6. - PMC - PubMed
    1. O’Brien CJO, Haberman ER, Domingos AI. A tale of three systems: toward a neuroimmunoendocrine model of obesity. Annu Rev Cell Dev Biol. 2021;37:549–73. - PMC - PubMed

Publication types