. 2022 Apr 26;9(2):ENEURO.0442-21.2022.
doi: 10.1523/ENEURO.0442-21.2022. Print 2022 Mar-Apr.

Characterization of Hypothalamic MCH Neuron Development in a 3D Differentiation System of Mouse Embryonic Stem Cells

Affiliations

Characterization of Hypothalamic MCH Neuron Development in a 3D Differentiation System of Mouse Embryonic Stem Cells

Yu Kodani et al. eNeuro. .

Abstract

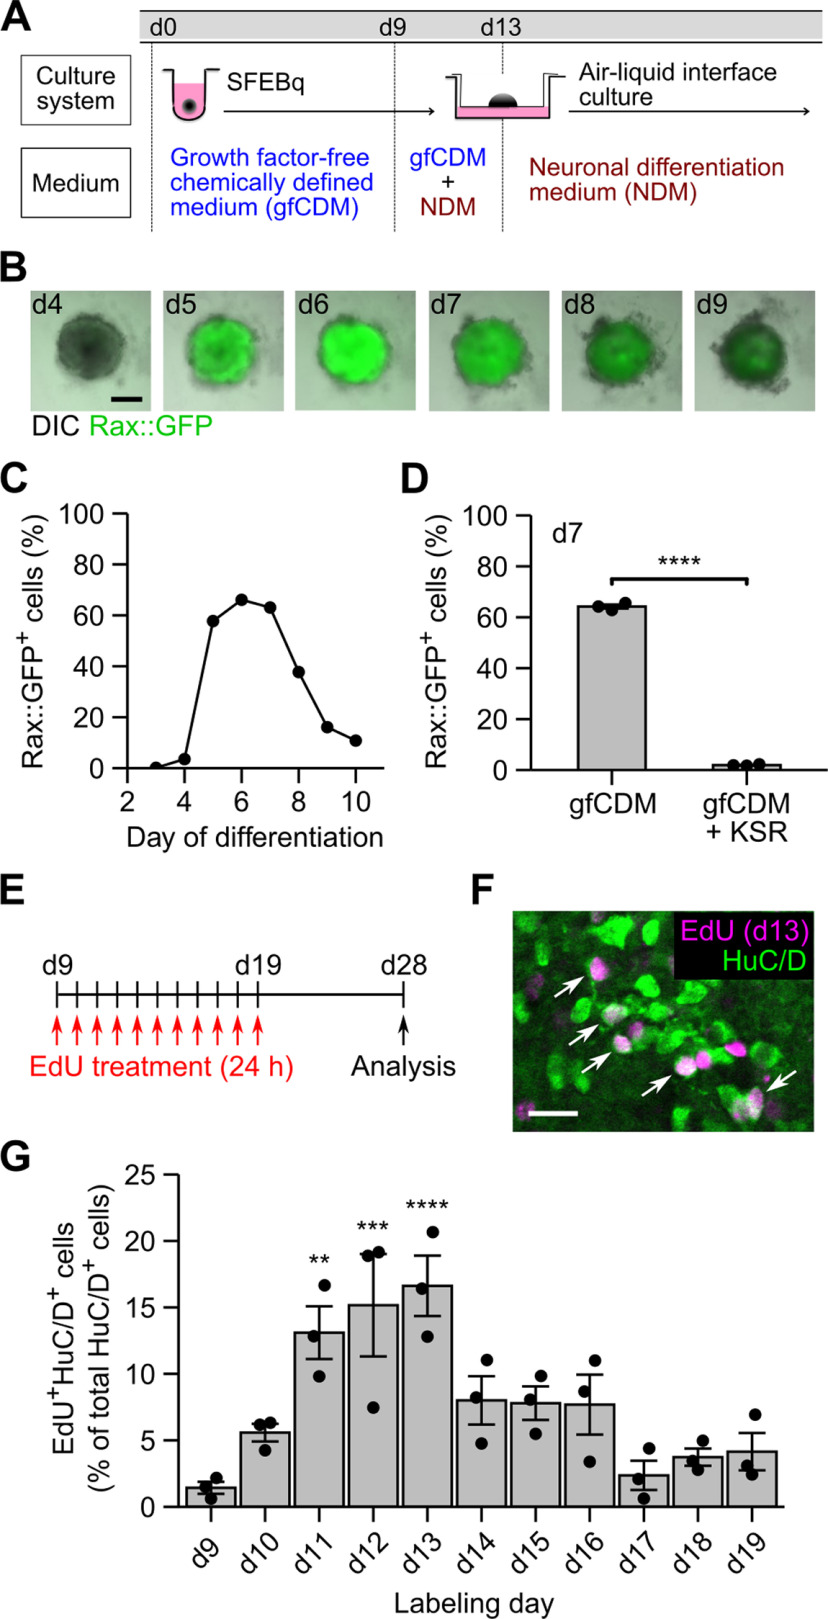
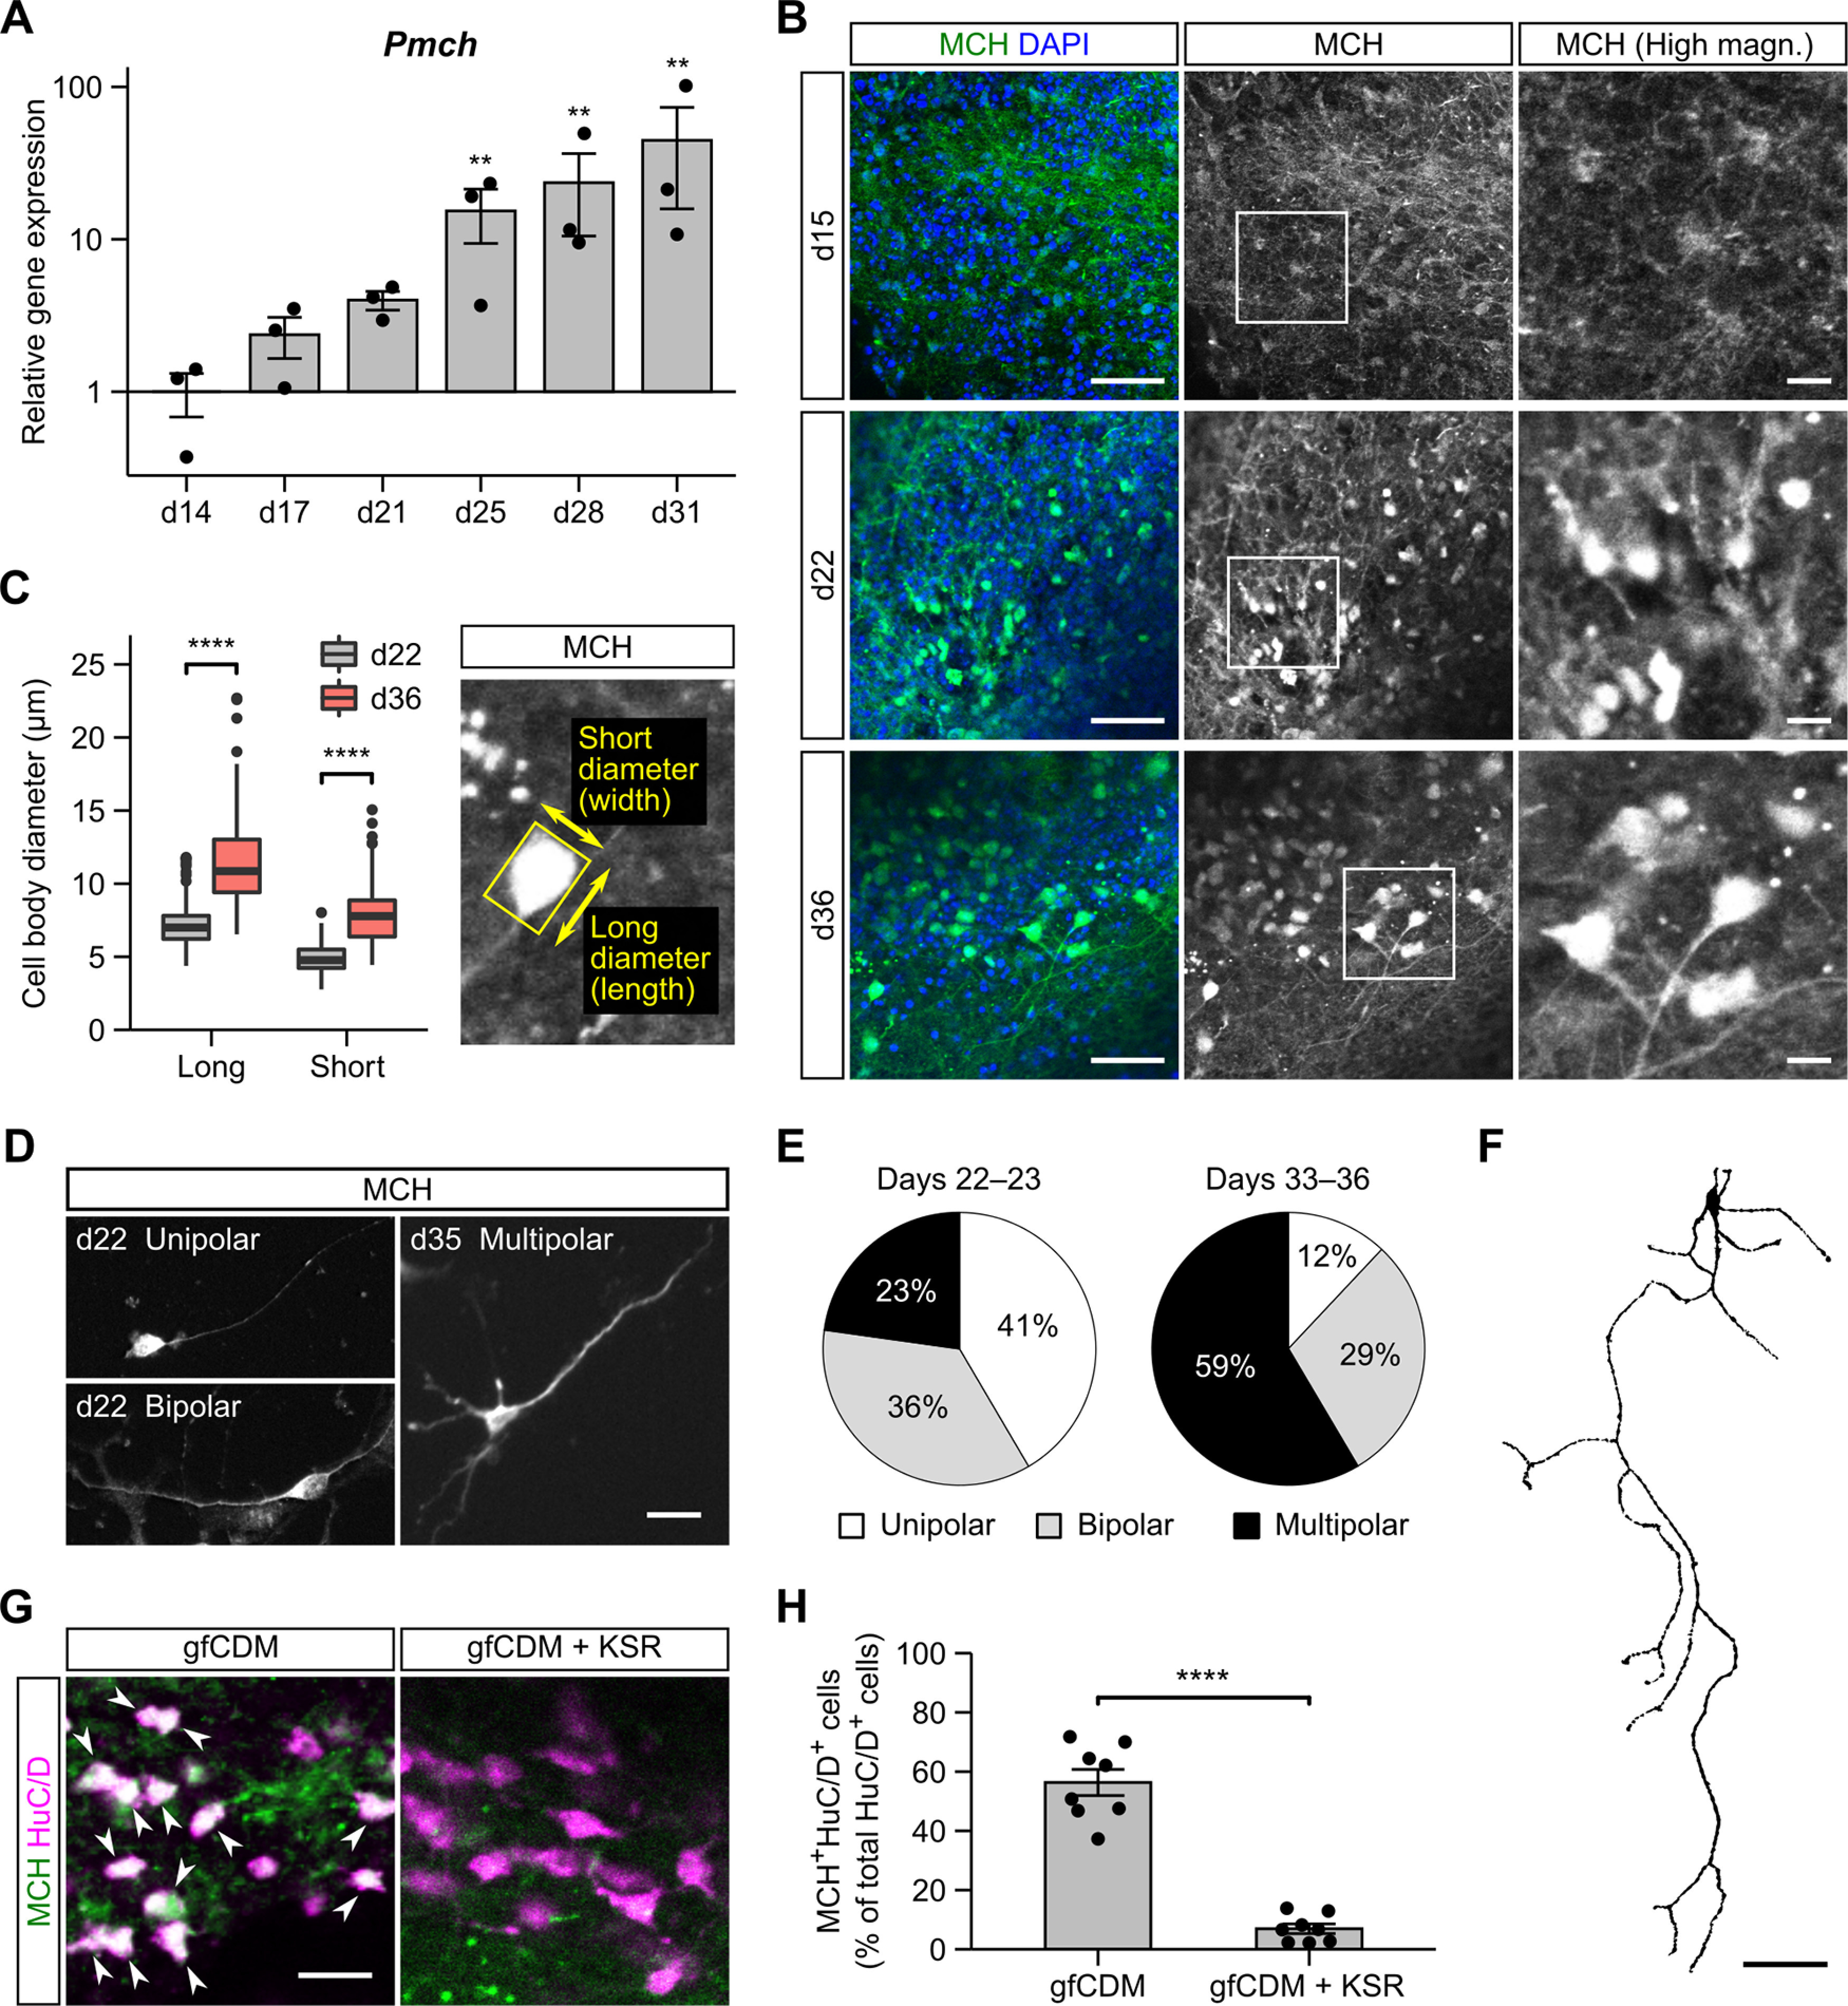
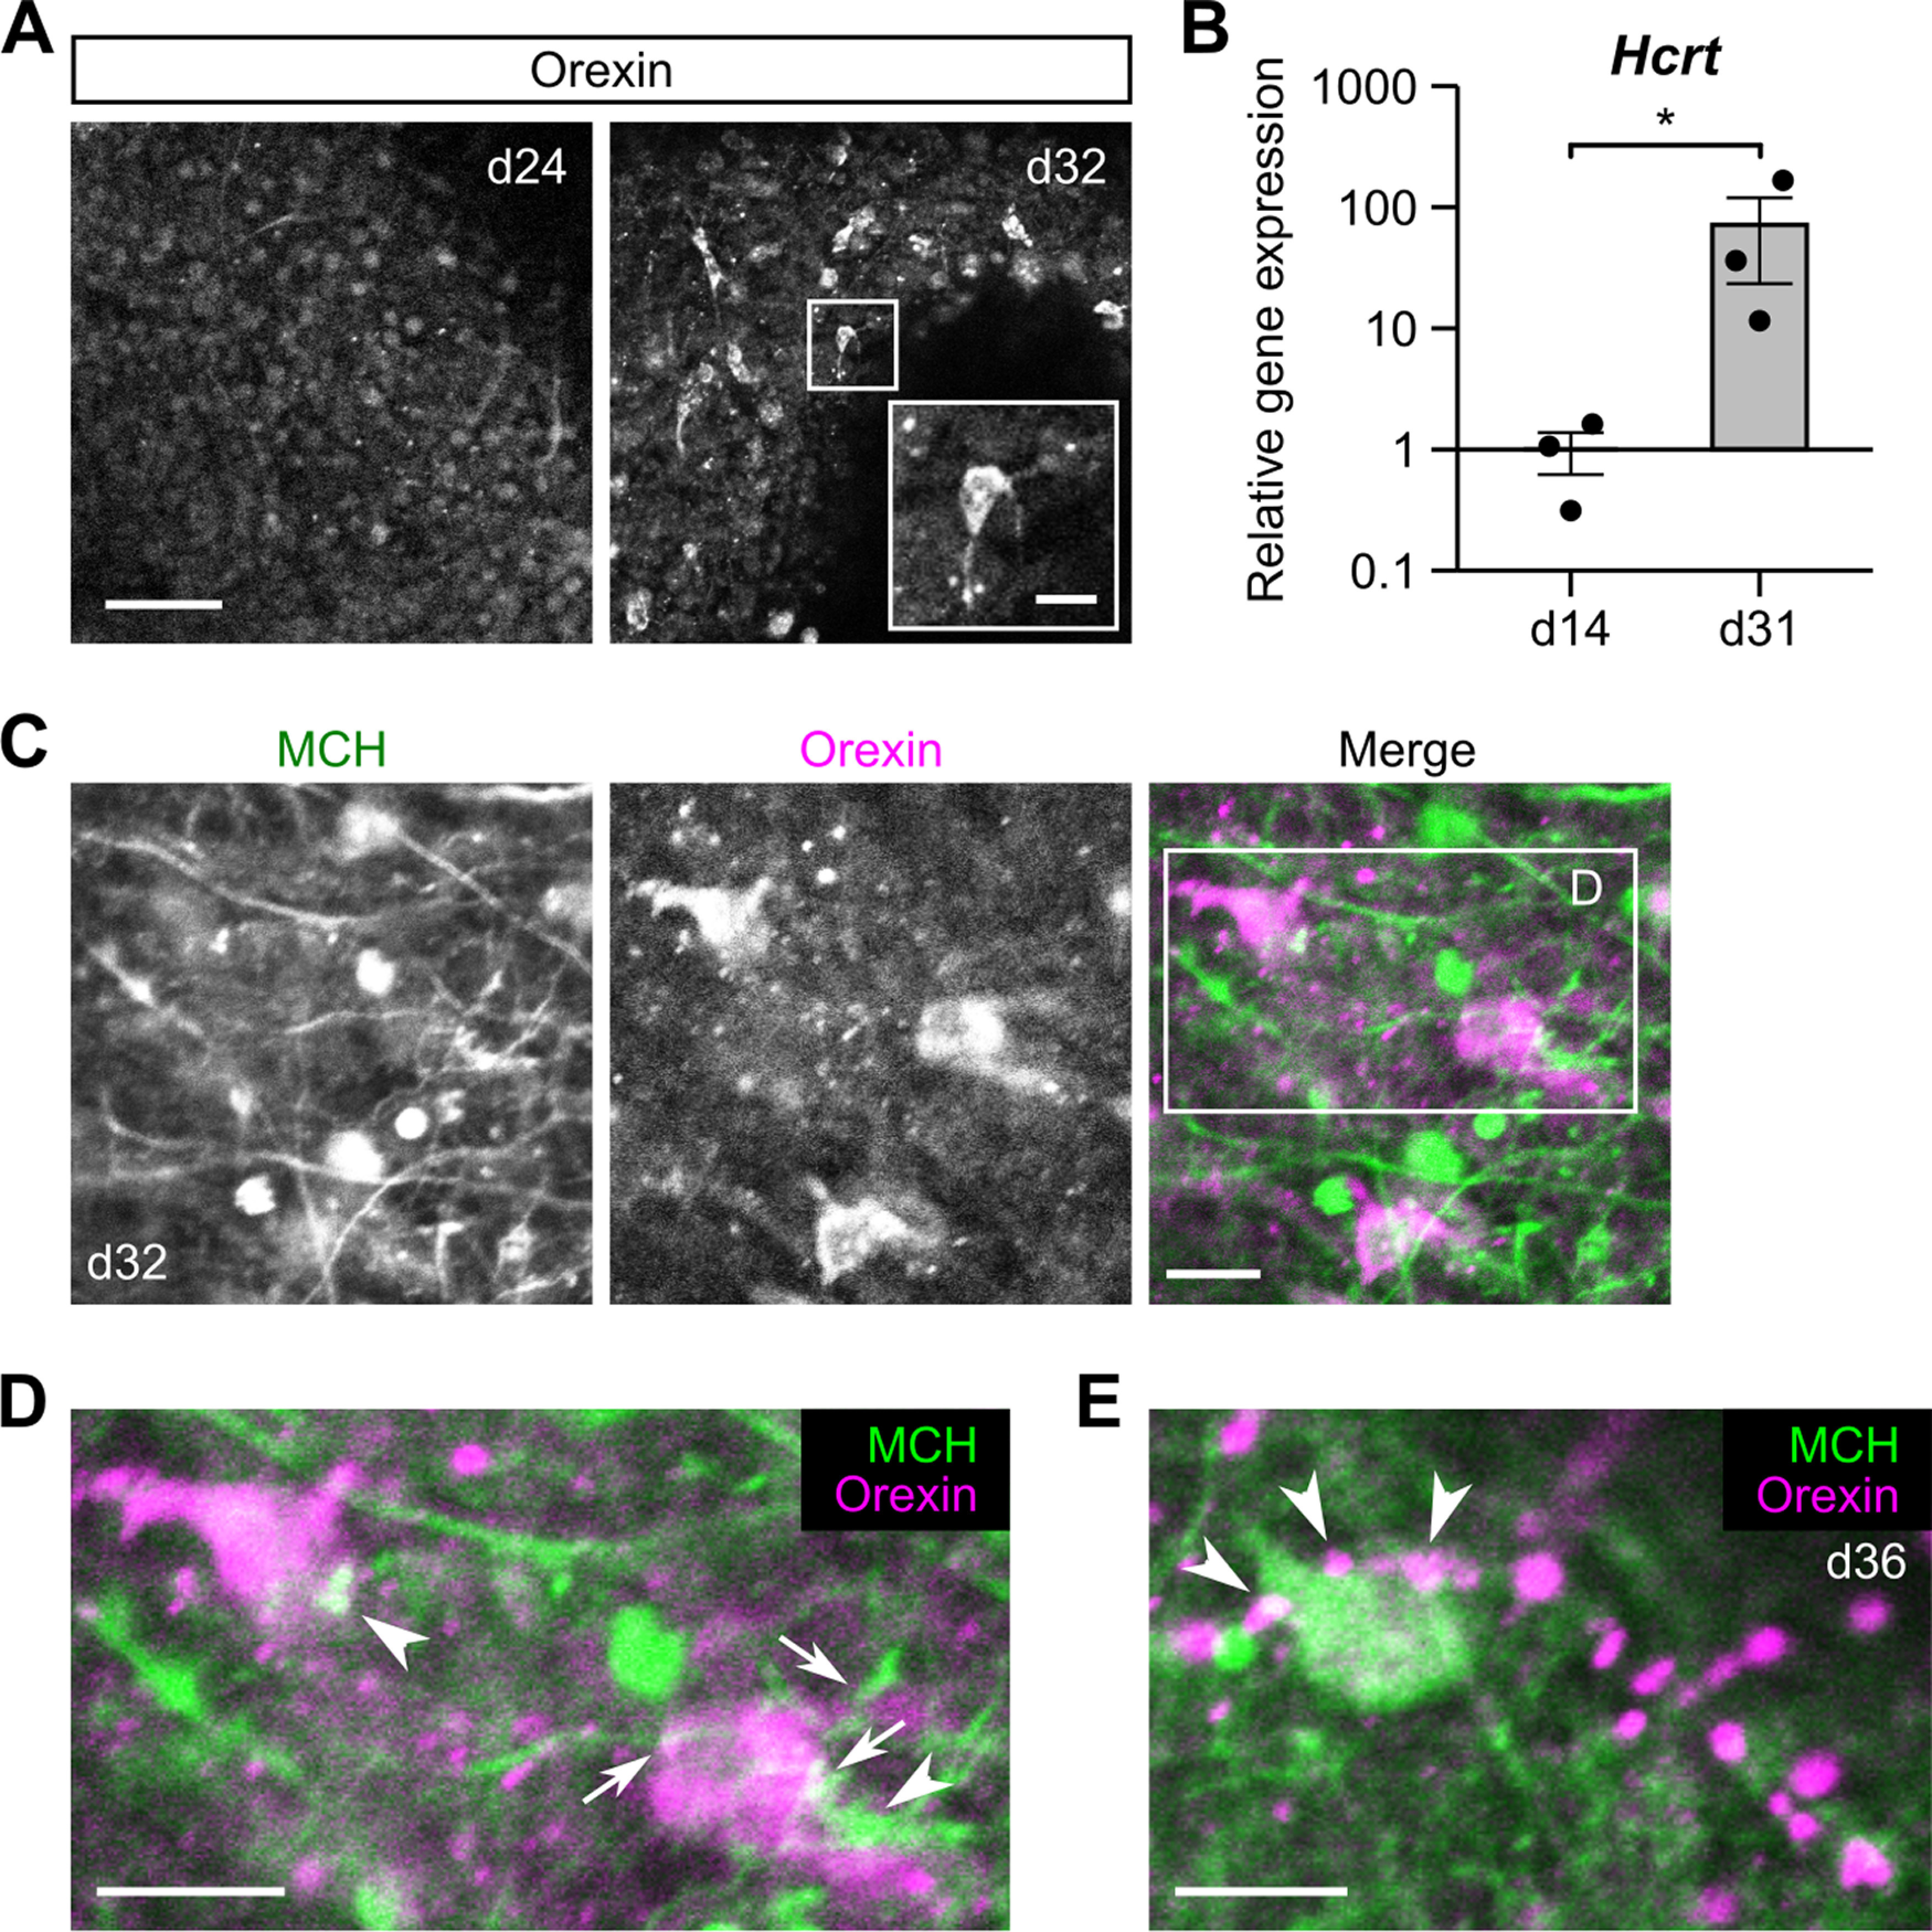
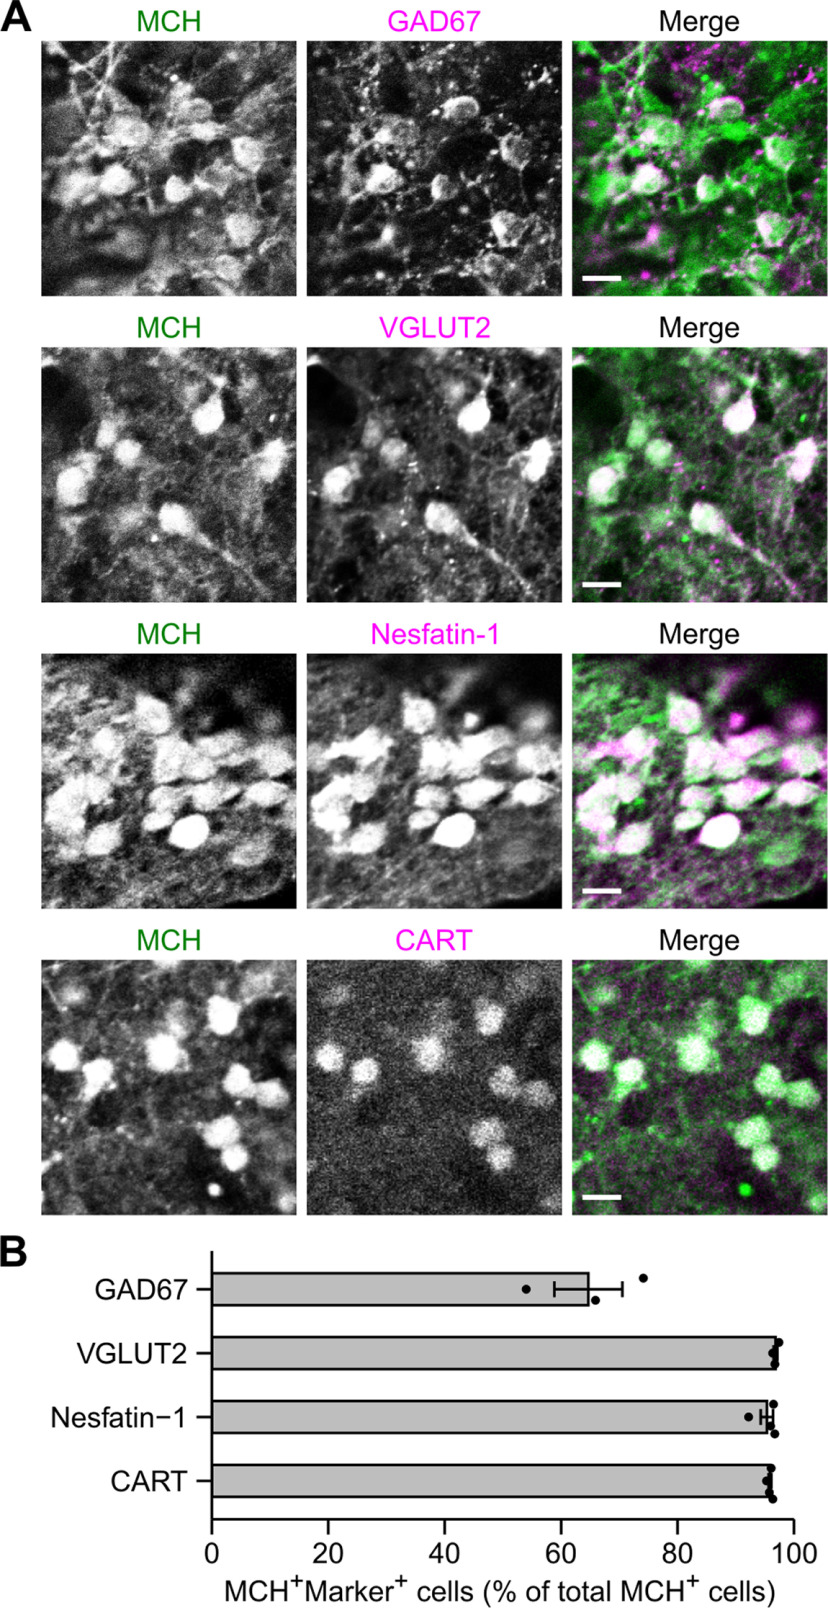
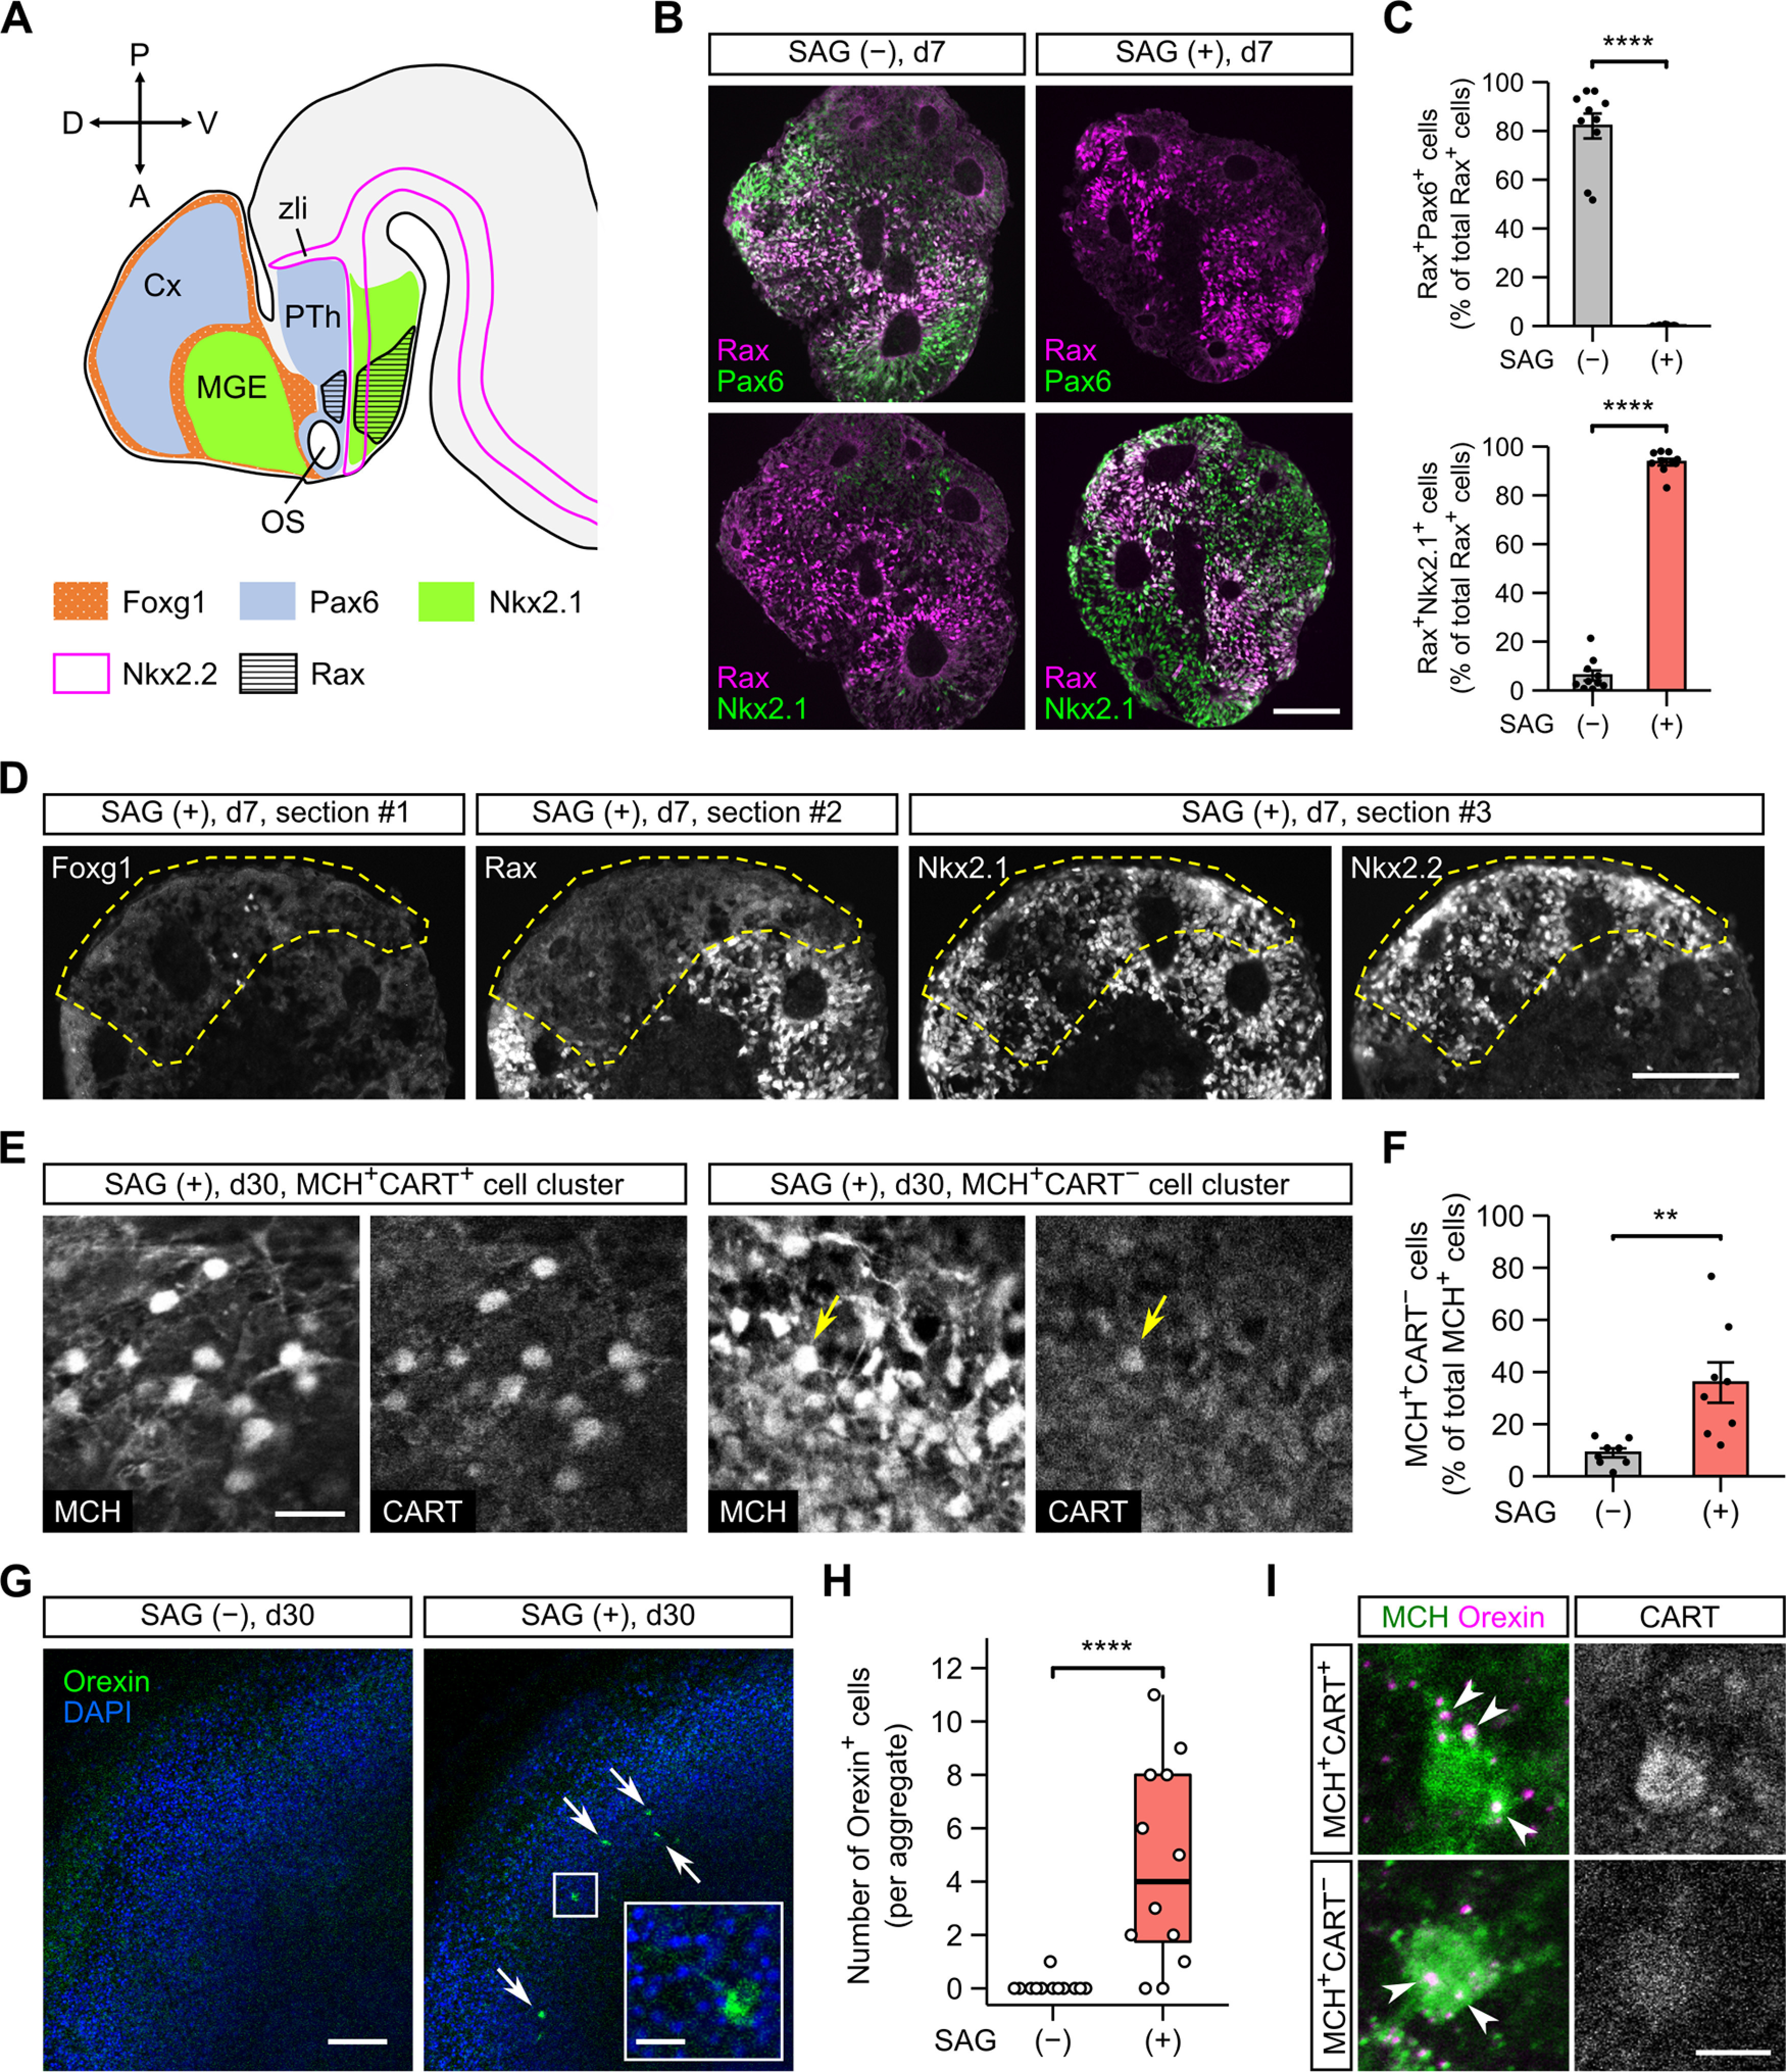
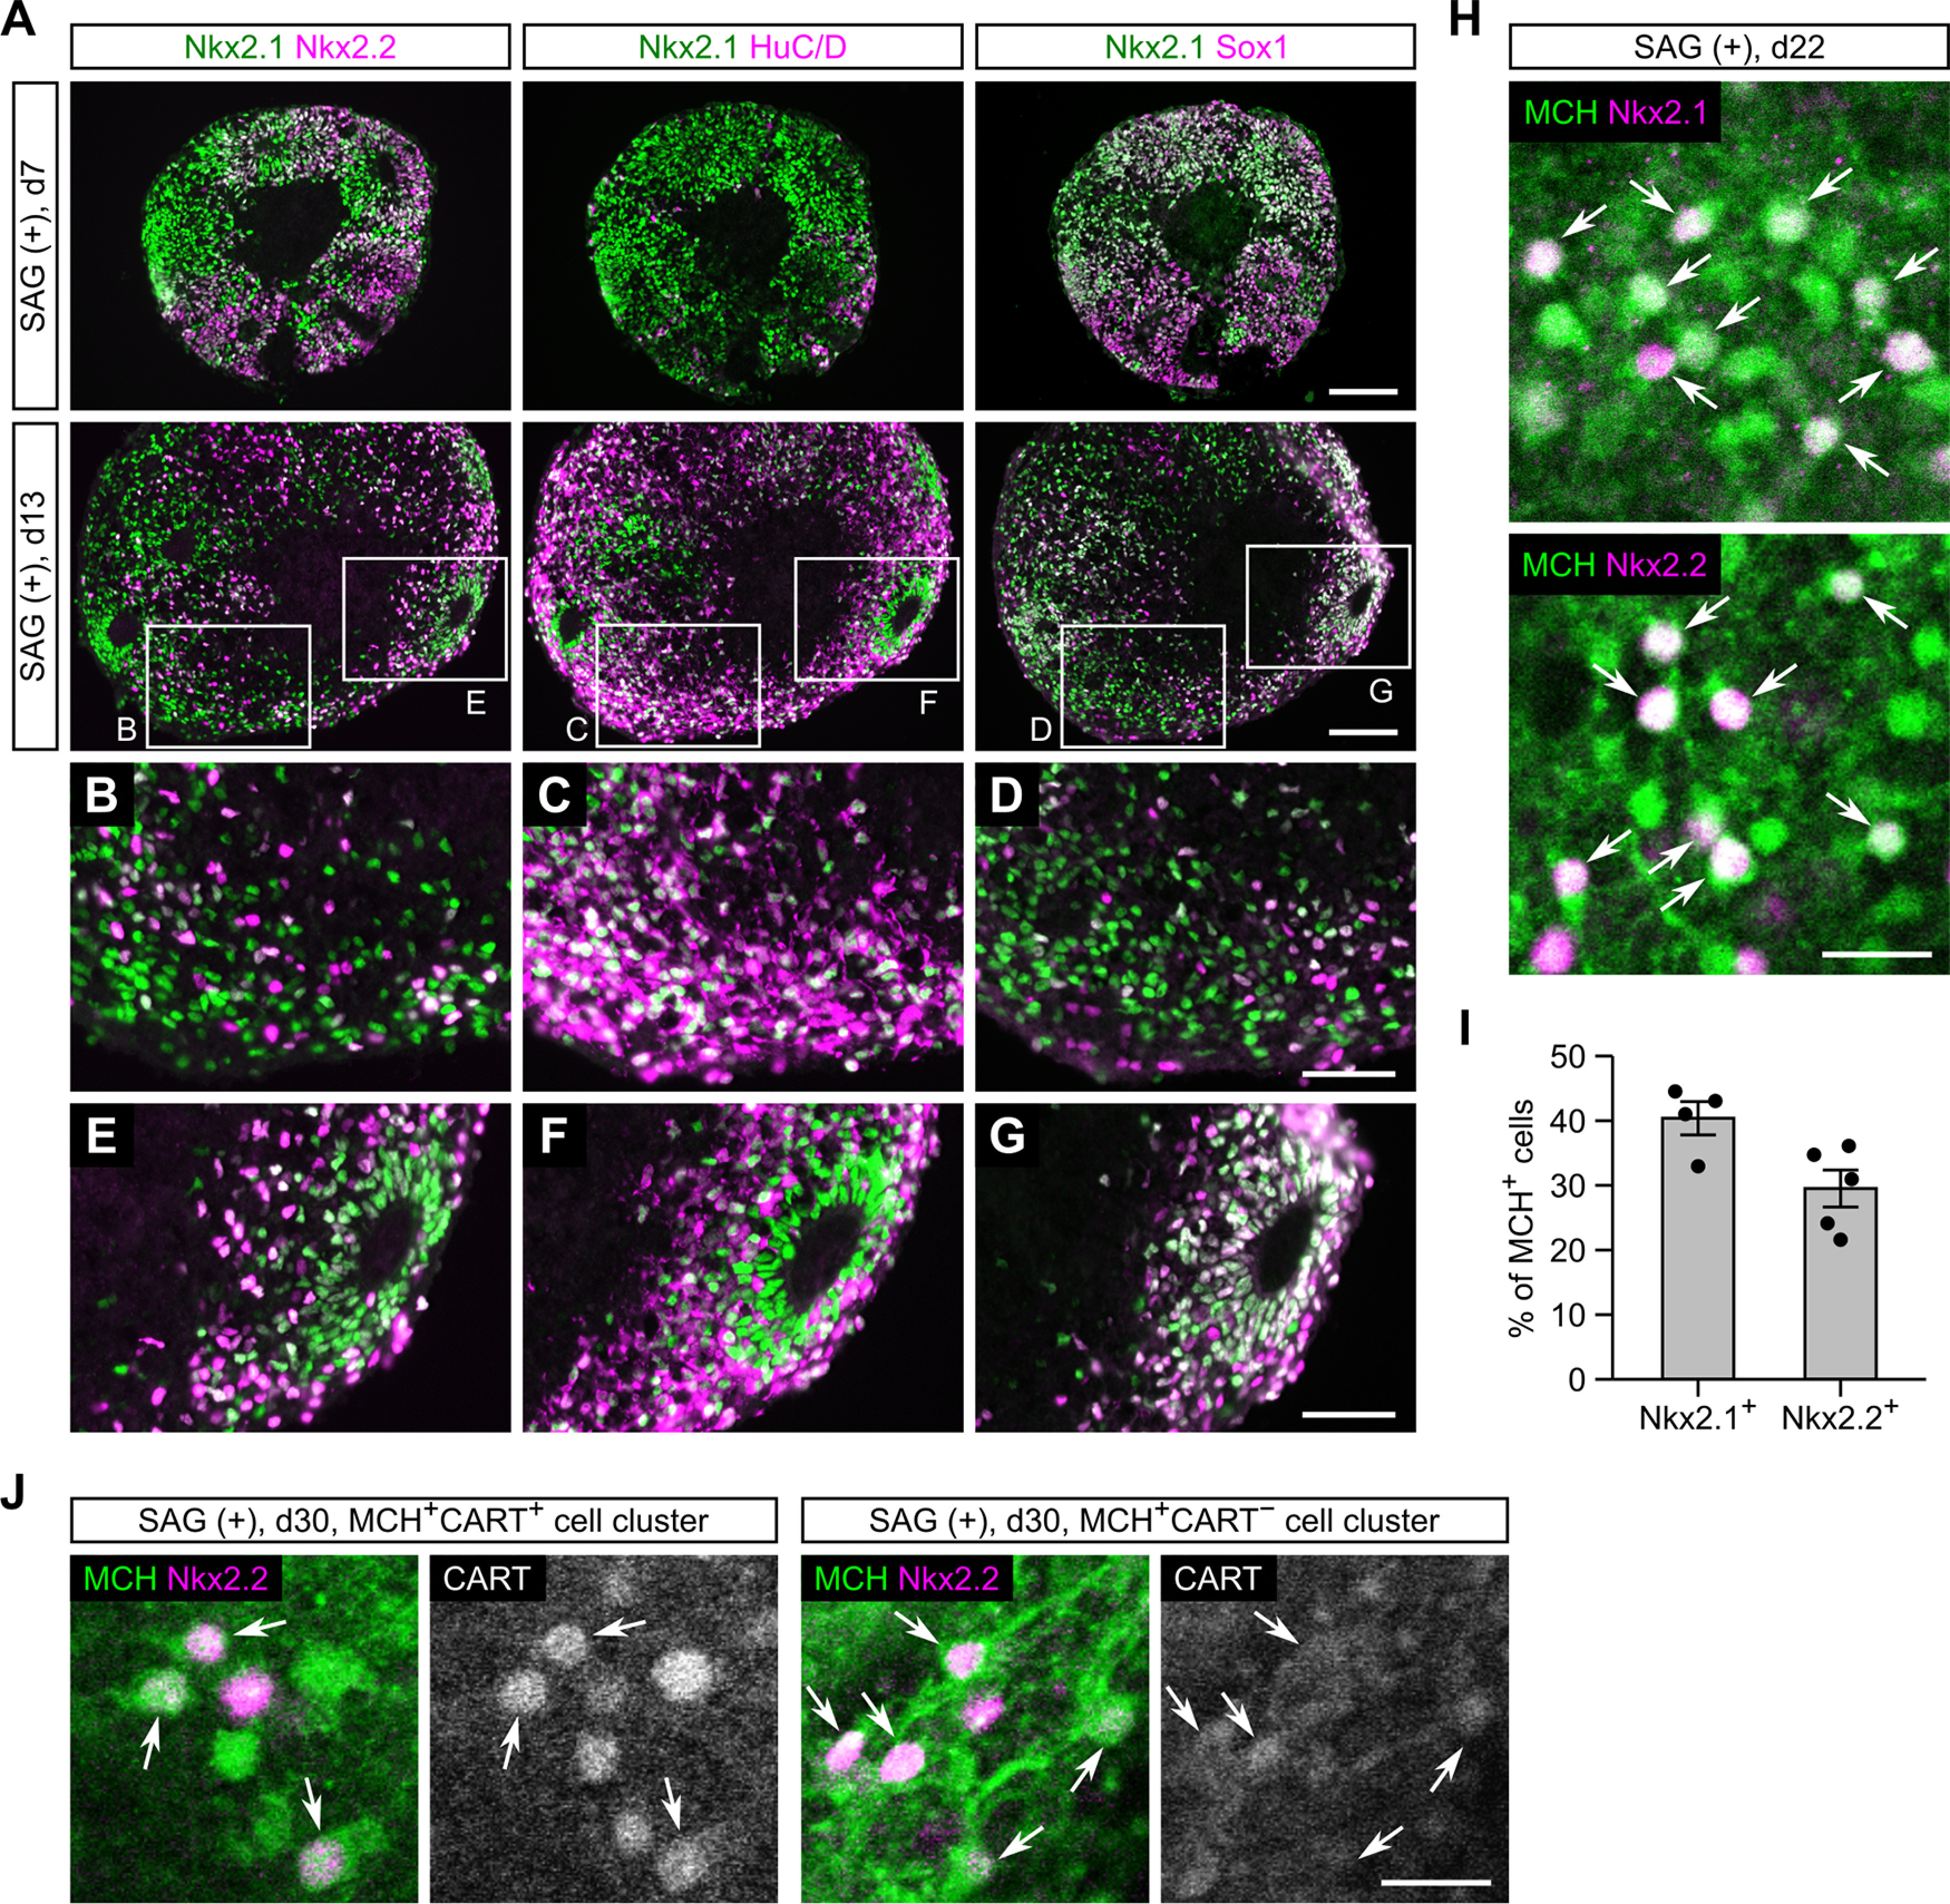
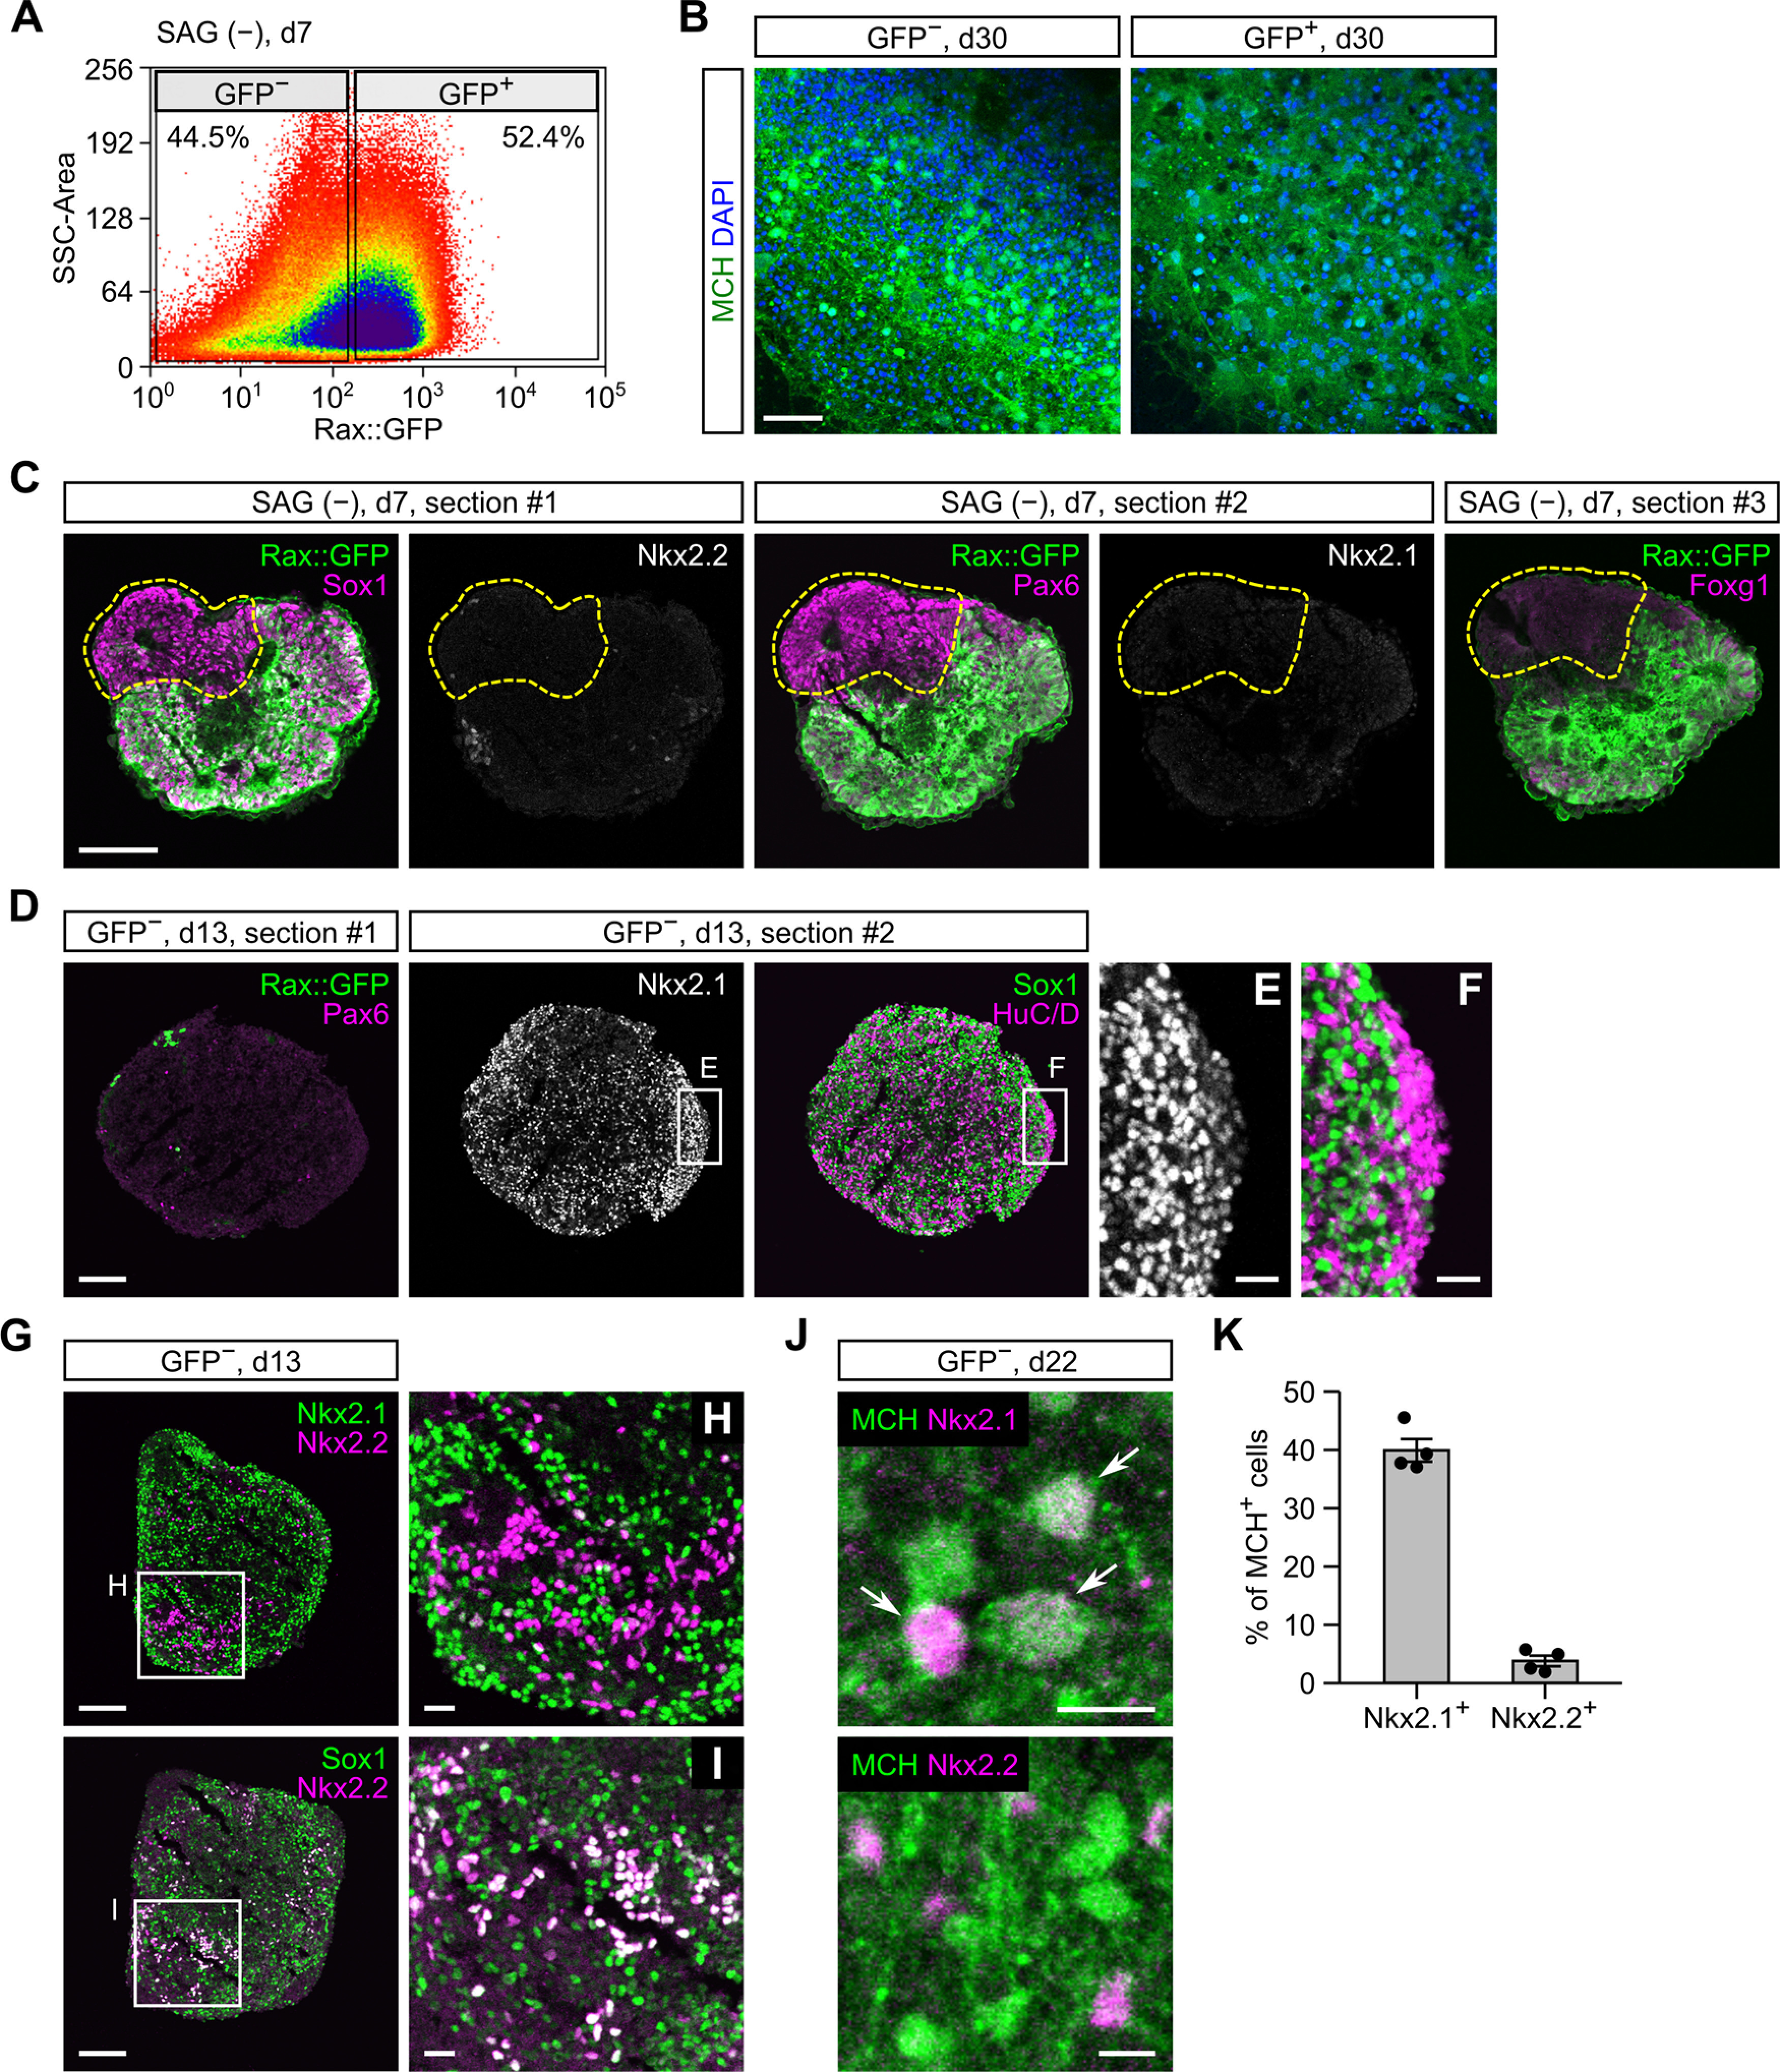
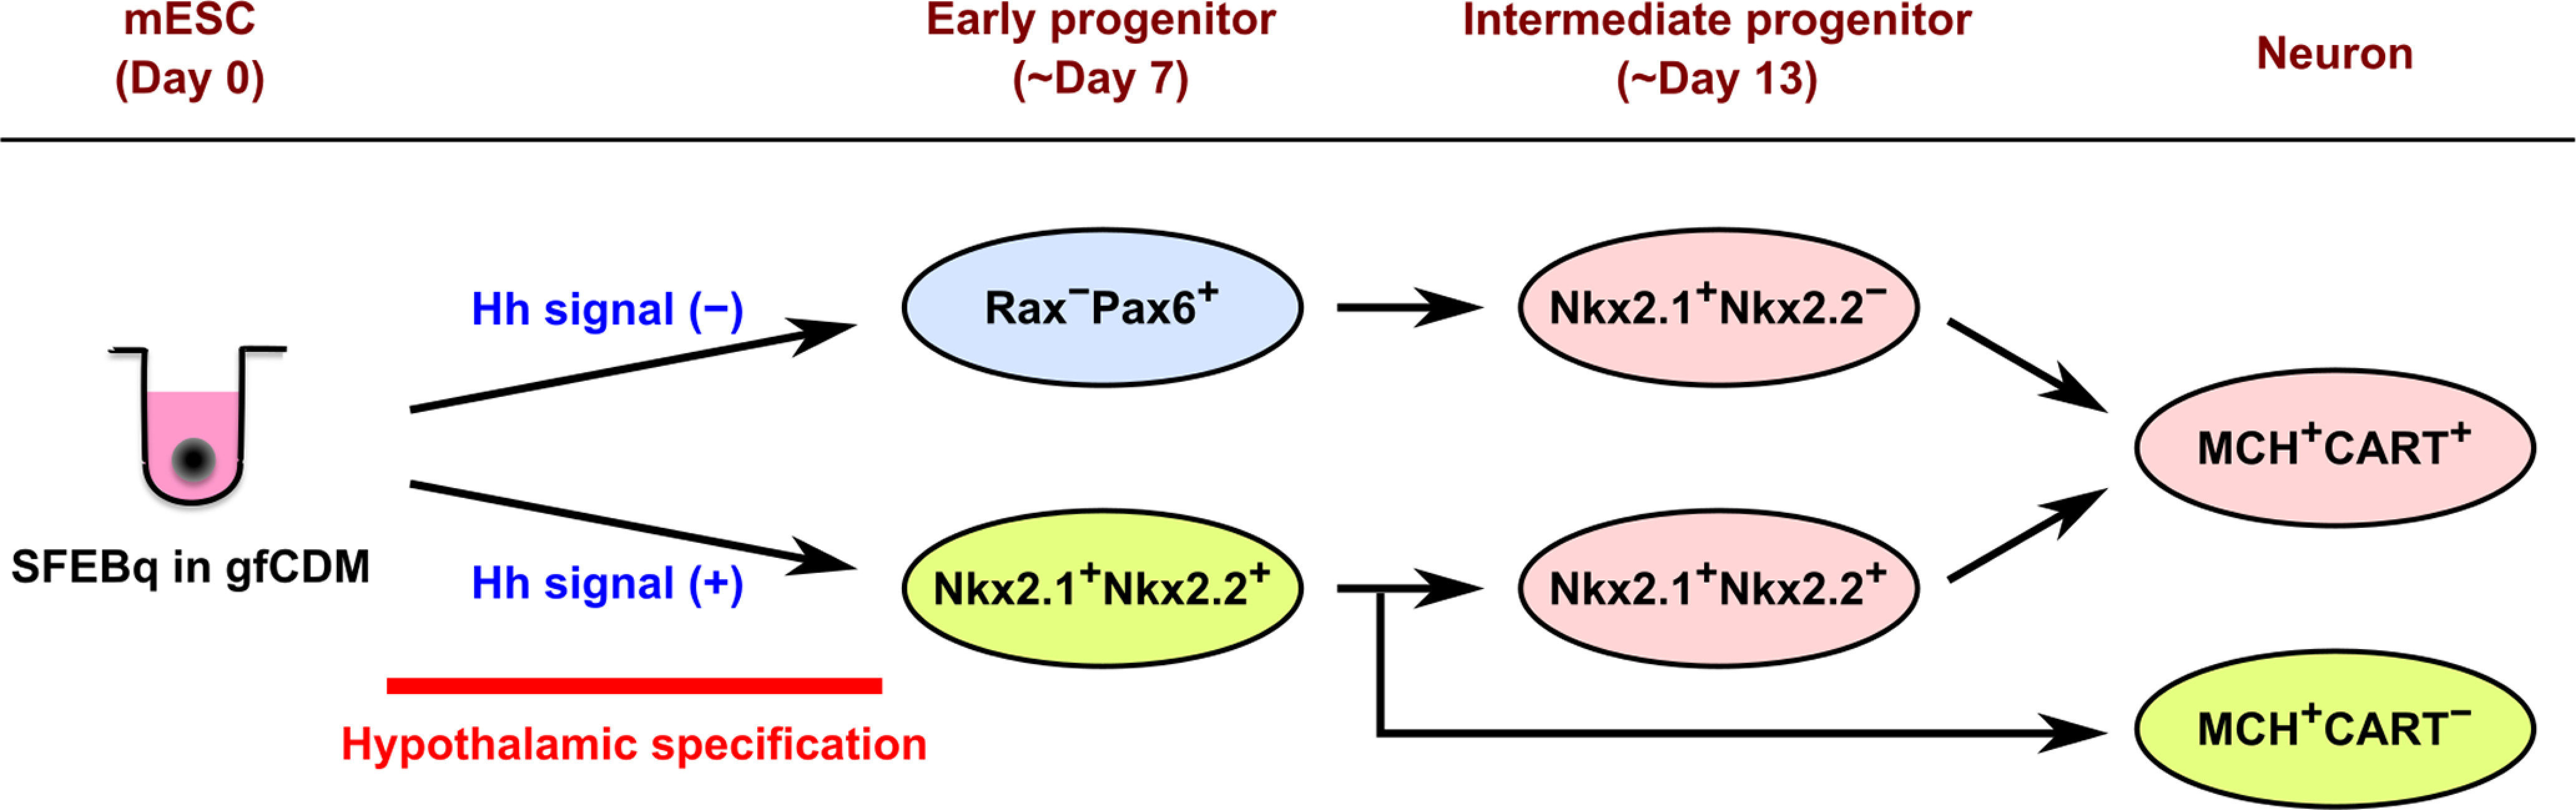
Hypothalamic melanin-concentrating hormone (MCH) neurons are important regulators of multiple physiological processes, such as sleep, feeding, and memory. Despite the increasing interest in their neuronal functions, the molecular mechanism underlying MCH neuron development remains poorly understood. We report that a three-dimensional culture of mouse embryonic stem cells (mESCs) can generate hypothalamic-like tissues containing MCH-positive neurons, which reproduce morphologic maturation, neuronal connectivity, and neuropeptide/neurotransmitter phenotype of native MCH neurons. Using this in vitro system, we demonstrate that Hedgehog (Hh) signaling serves to produce major neurochemical subtypes of MCH neurons characterized by the presence or absence of cocaine- and amphetamine-regulated transcript (CART). Without exogenous Hh signals, mESCs initially differentiated into dorsal hypothalamic/prethalamic progenitors and finally into MCH+CART+ neurons through a specific intermediate progenitor state. Conversely, activation of the Hh pathway specified ventral hypothalamic progenitors that generate both MCH+CART- and MCH+CART+ neurons. These results suggest that in vivo MCH neurons may originate from multiple cell lineages that arise through early dorsoventral patterning of the hypothalamus. Additionally, we found that Hh signaling supports the differentiation of mESCs into orexin/hypocretin neurons, a well-defined cell group intermingled with MCH neurons in the lateral hypothalamic area (LHA). The present study highlights and improves the utility of mESC culture in the analysis of the developmental programs of specific hypothalamic cell types.

Keywords: 3D culture; ES cells; MCH; hypothalamus; neuronal differentiation.


Figures

Figure 1.
Figure 1.
Temporal pattern of neuronal differentiation in ES-Hypo. A, Culture protocol for ES-Hypo induction. d, day. B, Fluorescence images of SFEBq aggregates showing the Rax::GFP expression during days 4–9. Scale bar: 200 μm. C, The percentage of Rax::GFP+ cells during days 3–10 in a single experimental batch. D, The percentage of Rax::GFP+ cells on day 7 in multiple experimental batches (n =3). SFEBq culturing were performed in normal differentiation medium (gfCDM) or KSR-supplemented differentiation medium (gfCDM + KSR). ****p <0.0001 by Welch’s t test. E, A schematic illustration of the birth-dating analysis of postmitotic neurons in ES-Hypo. F, A representative image of day-28 ES-Hypo stained for EdU and HuC/D. The cell aggregate was treated with EdU on day 13. Arrows indicate double-positive cells (i.e., postmitotic neurons born on day 13). Scale bar: 20 μm. G, Summary of the birthdates of postmitotic neurons in ES-Hypo. The percentage of EdU+HuC/D+ cells among total HuC/D+ cells was quantified for each day of EdU labeling. n =3 aggregates per day. **p <0.01, ***p <0.001, and ****p <0.0001 versus day 9 by Dunnett test.
Figure 2.
Figure 2.
Generation of MCH neurons in ES-Hypo. A, The qRT-PCR-based analysis of the Pmch expression during ES-Hypo differentiation. Pmch encodes the precursor of MCH. Data were normalized to Actb and gene expression on day 14 and plotted in log10 scale. n =3 experiments. **p <0.01 versus day 14 by Dunnett test. B, Immunofluorescence staining of ES-Hypo for MCH on days 15, 22, and 36. Nuclei were stained with DAPI. The right panels show high-magnification images of the boxed regions in the middle panels. Scale bars: 50 μm (low magnification) and 10 μm (high magnification). C, Quantification of the cell body diameter for MCH-ir cells on days 22 and 36. The long and short diameters for each MCH-ir cell were measured as shown in the right panel. n =300 cells per day. ****p <0.0001 by Welch’s t test. D–F, The analysis of MCH-ir cells in the dissociation culture. Cells were dissociated from ES-Hypo on days 19–20 or 30–33 and cultured in a monolayer for 3 d. Representative morphologies of MCH-ir cells are shown in fluorescence images (D) and a cell trace (F). Scale bars: 20 μm (D) and 50 μm (F). The percentage of MCH-ir cells showing unipolar, bipolar, or multipolar morphology is presented in the pie charts (E) for days 22–23 (n =272 cells) and days 33–36 (n =200 cells). Functional properties of MCH-ir cells on day 36 were evaluated by calcium imaging as shown in Extended Data Figure 2-1. G, Representative images of day-36 mESC aggregates immunostained for MCH and HuC/D. The aggregates were initially differentiated in gfCDM (left, corresponding to ES-Hypo) or gfCDM + KSR (right). Arrowheads indicate double-positive cells. Scale bar: 20 μm. H, The percentage of MCH+HuC/D+ cells among total HuC/D+ cells under the culture conditions shown in G. n =8 aggregates per condition. ****p <0.0001 by Welch’s t test.
Figure 3.
Figure 3.
Reciprocal connectivity between MCH and orexin neurons in ES-Hypo. A, Representative images of ES-Hypo immunostaind for orexin on days 24 and 32. The inset shows a magnified view of an orexin-ir cell in the boxed region. Scale bars: 50 and 10 μm (inset). B, The qRT-PCR-based analysis of the Hcrt expression on days 14 and 31. Hcrt encodes the precursor of orexin. Data were normalized to Actb and gene expression on day 14 and plotted in log10 scale. n =3 experiments. *p <0.05 by Welch’s t test. C–E, Double-immunofluorescence images showing putative connections between MCH-ir and orexin-ir cells in ES-Hypo on days 32 and 36. The boxed region in C is magnified in D. Two orexin-ir cells are contacted by MCH-ir fibers (D, arrows) or boutons (D, arrowheads). Similarly, an MCH-ir cell is closely apposed by orexin-ir boutons (E, arrowheads). Scale bars: 10 μm.
Figure 4.
Figure 4.
Characterization of neuropeptide/neurotransmitter phenotype of MCH neurons in ES-Hypo. A, Representative images of day-36 ES-Hypo immunostained for MCH and different neurochemical markers GAD67, VGLUT2, nesfatin-1, and CART. Scale bars: 10 μm. B, The percentage of MCH+ cells expressing different neurochemical markers. n =3–4 aggregates per marker.
Figure 5.
Figure 5.
The generation of CART-negative MCH neurons and orexin neurons is increased by the activation of Hh signaling in ES-Hypo. A, The regional expression of transcription factors in the telencephalon and anterior diencephalon of embryonic mouse brain around E12. The indicated expression patterns are based on the published literature (Shimamura et al., 1995; Marín et al., 2002; Shimogori et al., 2010; Lu et al., 2013; Díaz et al., 2014; Ferran et al., 2015). Cx, cortex; MGE, medial ganglionic eminence; OS, optic stalk; PTh, prethalamus; zli, zona limitans intrathalamica. B, Representative images of day-7 mESC aggregates immunostained for Rax and Pax6 (upper panels) or Nkx2.1 (lower panels). The aggregates were differentiated in the absence (−) or presence (+) of 30 nm SAG. Scale bar: 100 μm. Immunostaining for the general neural progenitor marker Sox1 is presented in Extended Data Figure 5-1. C, The percentage of Rax+ cells expressing Pax6 (top) or Nkx2.1 (bottom) on day 7 under SAG (−) and (+) conditions. n =10 aggregates per condition. ****p <0.0001 by Welch’s t test. D, Serial sections from a day-7 aggregate cultured with SAG. The sections were stained for Foxg1 (#1), Rax (#2), or Nkx2.1/Nkx2.2 (#3). A Rax region is surrounded by dashed lines. Scale bar: 100 μm. E, Representative immunofluorescence images of MCH+CART+ (left) and MCH+CART (right) cell clusters in SAG-treated aggregates on day 30. In the MCH+CART cluster, only one MCH+ cell is weakly stained for CART (arrow). Scale bar: 20 μm. In Extended Data Figure 5-2, we assessed the co-expression of MCH and HuC/D in SAG-treated aggregates. In Extended Data Figure 5-3, we assessed the co-expression of CART and NK3R in SAG-treated aggregates. F, The percentage of MCH+CART cells among total MCH+ cells on day 30 under SAG (−) and (+) conditions. n =8 aggregates per condition. **p <0.01 by Welch’s t test. G, Representative images of SAG-treated (right) and untreated (left) aggregates immunostained for orexin on day 30. Arrows indicate orexin-ir cells. The inset shows a magnified view of an orexin-ir cell in the boxed region. Scale bars: 100 and 20 μm (inset). H, Quantification of orexin+ cells on day 30 under SAG (−) and (+) conditions. n =12 aggregates per condition. ****p <0.0001 by Brunner–Munzel test. I, Representative images of an MCH+CART+ (top) or MCH+CART (bottom) cell, which is contacted by orexin-ir boutons (arrowheads). Triple immunostaining was performed in SAG-treated aggregates on day 36. Scale bar: 10 μm.
Figure 6.
Figure 6.
Characterization of neuronal differentiation in SAG-treated ES-Hypo. A–G, Serial sections from SFEBq-cultured mESC aggregates (with SAG) on days 7 and 13. The sections were immunostained for Nkx2.1/Nkx2.2 (#1), Nkx2.1/HuC/D (#2), or Nkx2.1/Sox1 (#3). The day-13 aggregate contains a HuC/D+ neuron-dense area (B–D) and a Sox1+ rosette structure (E–G). Scale bars: 100 μm (A) and 50 μm (B–G). H, Representative images of SAG-treated mESC aggregates immunostained for MCH/Nkx2.1 (top) and MCH/Nkx2.2 (bottom) on day 22. Arrows indicate double-positive cells. Scale bar: 20 μm. I, The percentage of MCH-ir cells expressing Nkx2.1 or Nkx2.2 on day 22. n =4–5 aggregates per marker. J, Triple immunostaing of SAG-treated mESC aggregates for MCH/CART/Nkx2.2 on day 30. Representative images of MCH+CART+ (left) and MCH+CART (right) cell clusters are shown, and MCH+Nkx2.2+ cells are indicated by arrows. Scale bar: 20 μm.
Figure 7.
Figure 7.
Characterization of neuronal differentiation in SAG-free ES-Hypo. A, FACS sorting of Rax::GFP+ and GFP cells from SFEBq-cultured mESC aggregates (without SAG) on day 7. B, Immunofluorescence images of Rax::GFP+ (right) and GFP (left) cell aggregates. FACS-sorted GFP+ and GFP cells were reaggregated and cultured until day 30 before staining for MCH. Nuclei were stained with DAPI. Scale bar: 50 μm. C, Serial sections from a day-7 aggregate cultured without SAG. The sections were immunostained for GFP/Sox1/Nkx2.2 (#1), GFP/Pax6/Nkx2.1 (#2), or GFP/Foxg1 (#3). Scale bar: 100 μm. D–J, Immunofluorescence analysis of GFP cell aggregates on days 13 and 22. Two serial sections from a day-13 aggregate were stained for GFP/Pax6 or Nkx2.1/Sox1/HuC/D (D–F). Two sections from a day-13 aggregate were stained for Nkx2.1/Nkx2.2 or Sox1/Nkx2.2 (G–I). Day-22 aggregates were stained for MCH/Nkx2.1 or MCH/Nkx2.2 (J, arrows indicate double-positive cells). Scale bars: 100 μm (D, G), 20 μm (E, F, H, I), and 10 μm (J). K, The percentage of MCH-ir cells expressing Nkx2.1 or Nkx2.2 in GFP cell aggregates on day 22. n =4 aggregates per marker.
Figure 8.
Figure 8.
Schematic diagram of the different progenitor origins of MCH neurons suggested in the current study. SFEBq culture of mESCs in gfCDM with or without exogenous Hh signals can generate Nkx2.1+Nkx2.2+ ventral hypothalamic progenitors or RaxPax6+ dorsal hypothalamic/prethalamic progenitors, respectively, within a week. The Nkx2.1+Nkx2.2+ early progenitors directly produce MCH+CART neurons and Nkx2.1+Nkx2.2+ intermediate progenitors, the latter of which generate MCH+CART+ neurons. The RaxPax6+ early progenitors also differentiate into MCH+CART+ neurons through Nkx2.1+Nkx2.2 intermediate progenitors.

Similar articles

Cited by

  • Central Role of Hypothalamic Circuits for Acupuncture's Anti-Parkinsonian Effects.
    Oh JY, Lee H, Jang SY, Kim H, Park G, Serikov A, Jang JH, Kim J, Yang S, Sa M, Lee SE, Han YE, Hwang TY, Jung SJ, Kim HY, Lee SE, Oh SJ, Kim J, Kim J, Kim J, McHugh TJ, Lee CJ, Nam MH, Park HJ. Oh JY, et al. Adv Sci (Weinh). 2024 Nov;11(43):e2403245. doi: 10.1002/advs.202403245. Epub 2024 Aug 9. Adv Sci (Weinh). 2024. PMID: 39119926 Free PMC article.

References

    1. Apergis-Schoute J, Iordanidou P, Faure C, Jego S, Schöne C, Aitta-Aho T, Adamantidis A, Burdakov D (2015) Optogenetic evidence for inhibitory signaling from orexin to MCH neurons via local microcircuits. J Neurosci 35:5435–5441. 10.1523/JNEUROSCI.5269-14.2015 - DOI - PMC - PubMed
    1. Bayer L, Mairet-Coello G, Risold P-Y, Griffond B (2002) Orexin/hypocretin neurons: chemical phenotype and possible interactions with melanin-concentrating hormone neurons. Regul Pept 104:33–39. 10.1016/S0167-0115(01)00320-2 - DOI - PubMed
    1. Bittencourt JC, Presse F, Arias C, Peto C, Vaughan J, Nahon JL, Vale W, Sawchenko PE (1992) The melanin-concentrating hormone system of the rat brain: an immuno- and hybridization histochemical characterization. J Comp Neurol 319:218–245. 10.1002/cne.903190204 - DOI - PubMed
    1. Blanco-Centurion C, Bendell E, Zou B, Sun Y, Shiromani PJ, Liu M (2018) VGAT and VGLUT2 expression in MCH and orexin neurons in double transgenic reporter mice. IBRO Rep 4:44–49. 10.1016/j.ibror.2018.05.001 - DOI - PMC - PubMed
    1. Blanco-Centurion C, Luo S, Spergel DJ, Vidal-Ortiz A, Oprisan SA, Van den Pol AN, Liu M, Shiromani PJ (2019) Dynamic network activation of hypothalamic MCH neurons in REM sleep and exploratory behavior. J Neurosci 39:4986–4998. 10.1523/JNEUROSCI.0305-19.2019 - DOI - PMC - PubMed

Publication types

LinkOut - more resources