. 2022 Jun;3(6):681-695.
doi: 10.1038/s43018-022-00360-7. Epub 2022 Apr 18.

Phosphate dysregulation via the XPR1-KIDINS220 protein complex is a therapeutic vulnerability in ovarian cancer

Affiliations

Phosphate dysregulation via the XPR1-KIDINS220 protein complex is a therapeutic vulnerability in ovarian cancer

Daniel P Bondeson et al. Nat Cancer. 2022 Jun.

Abstract

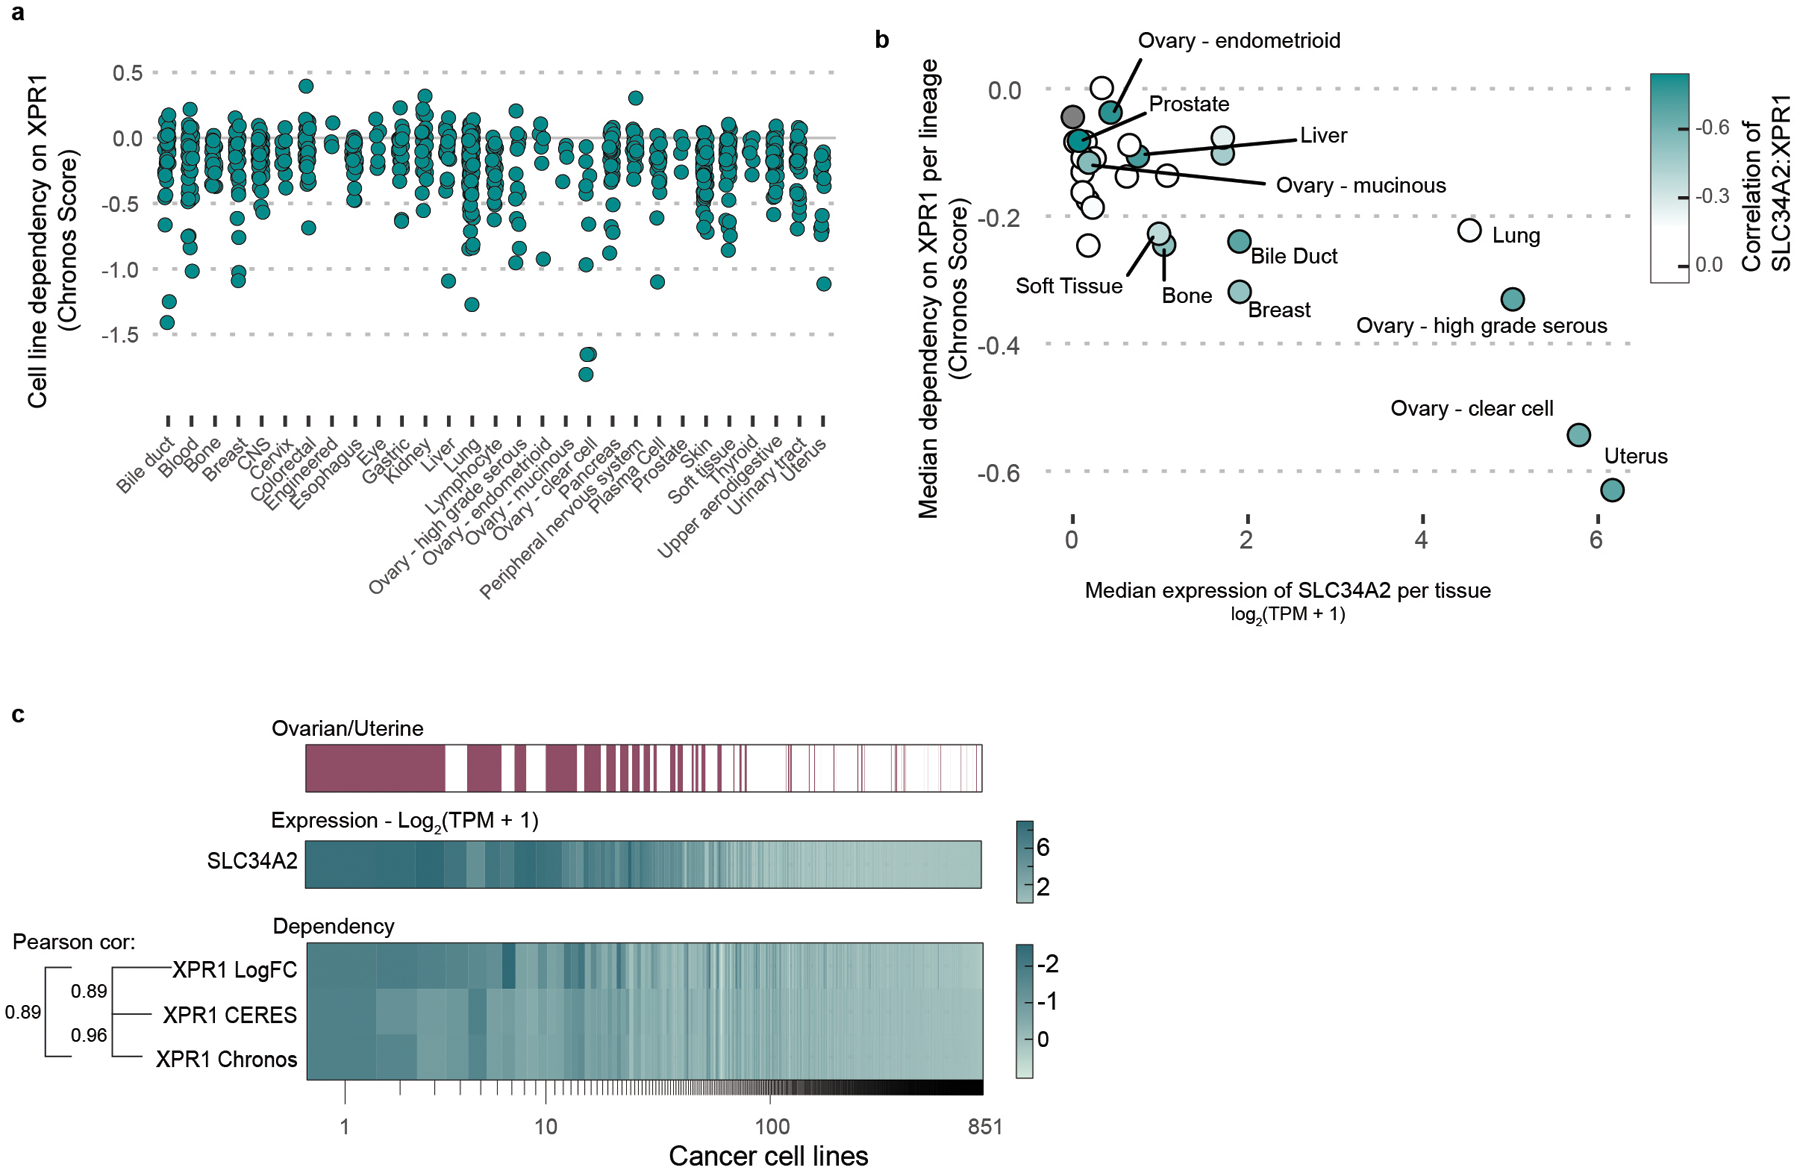
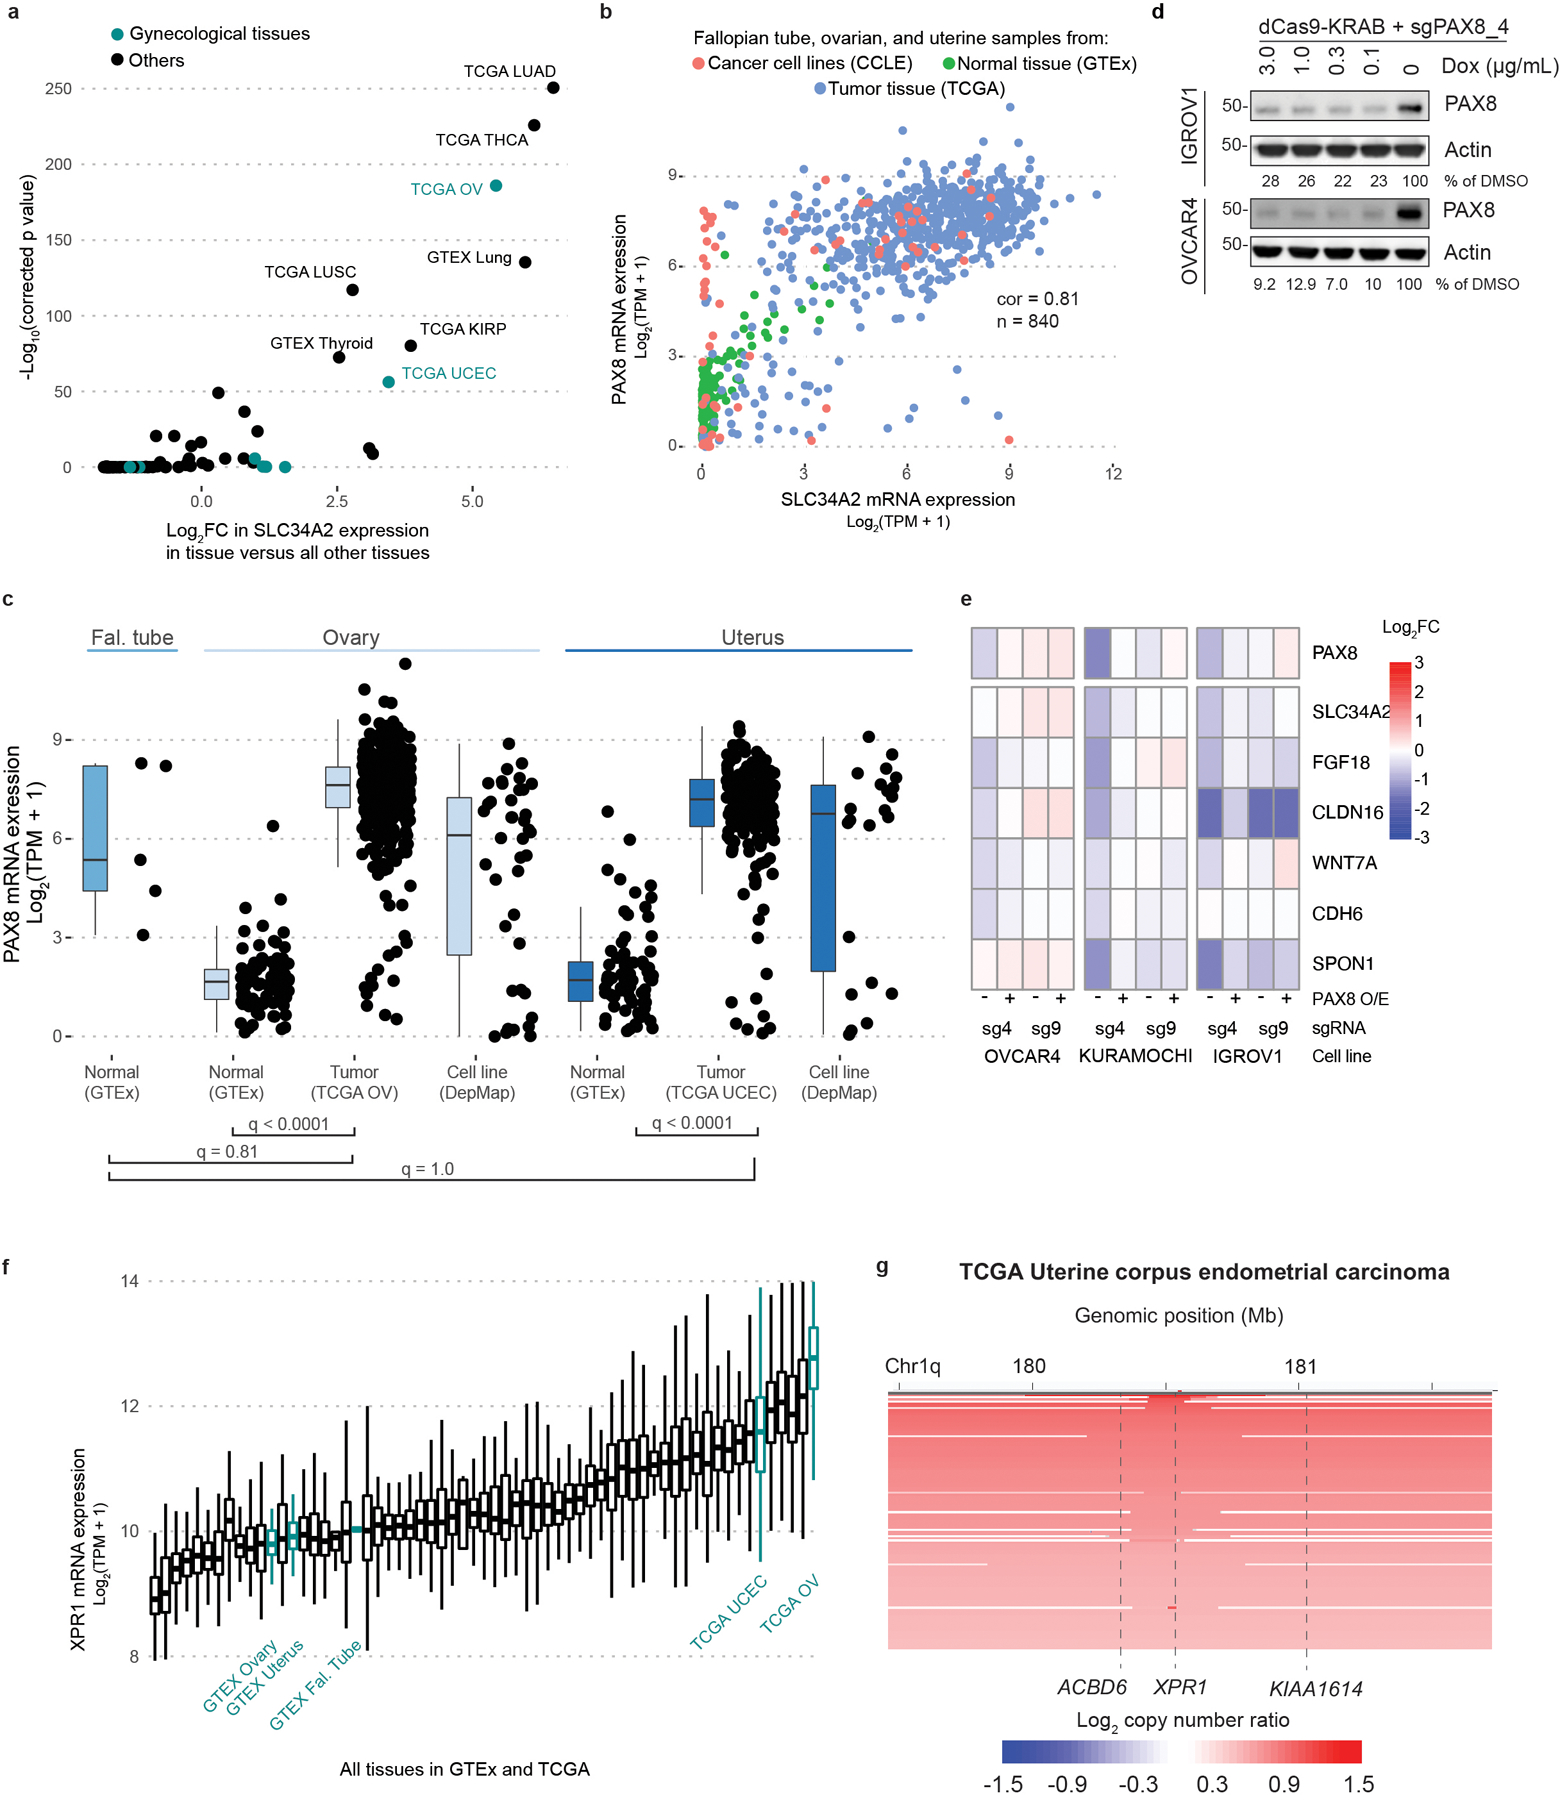
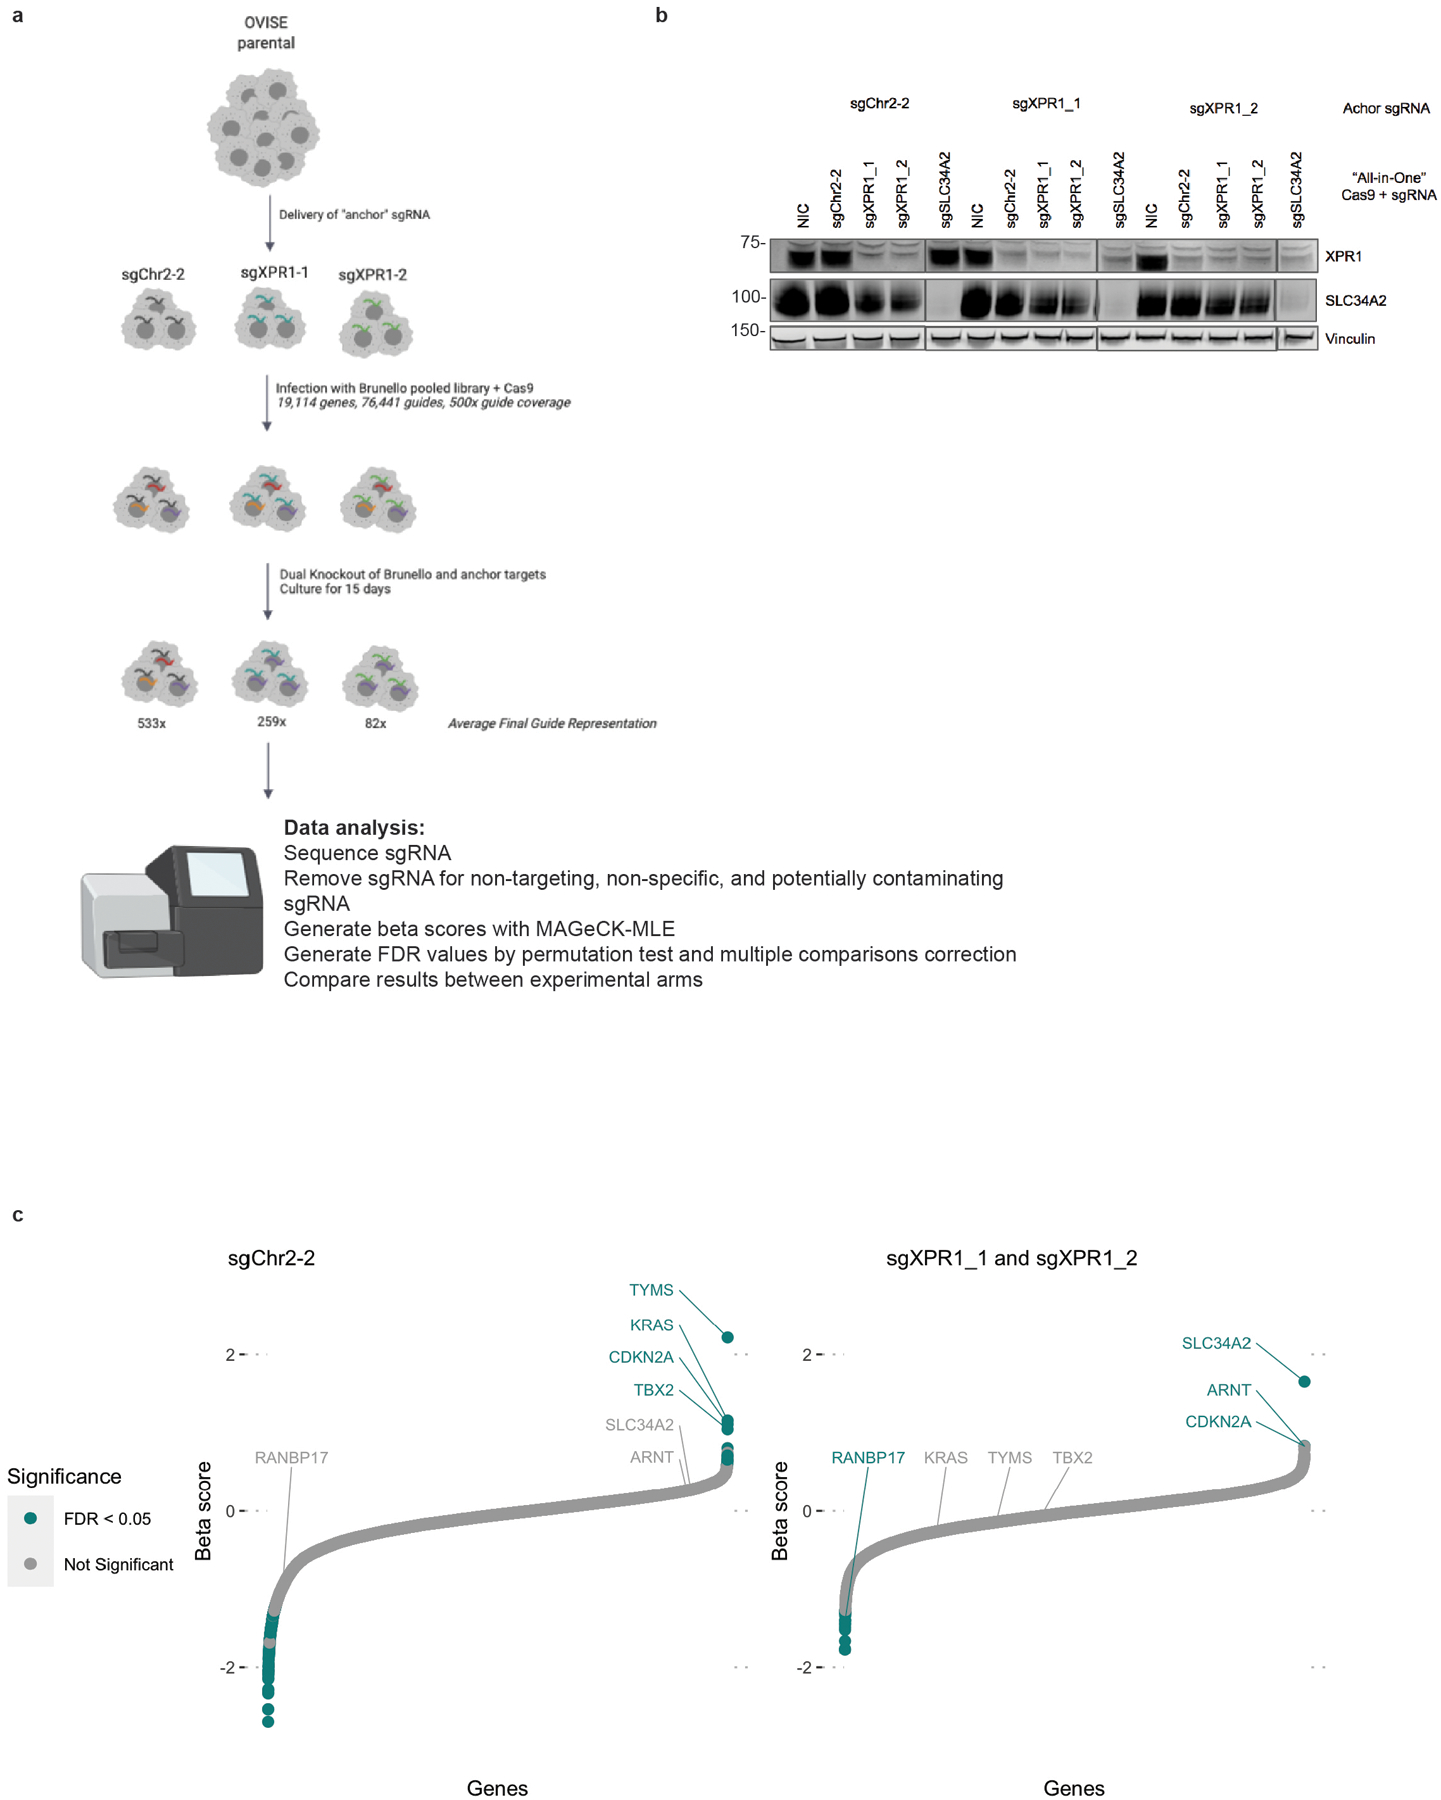
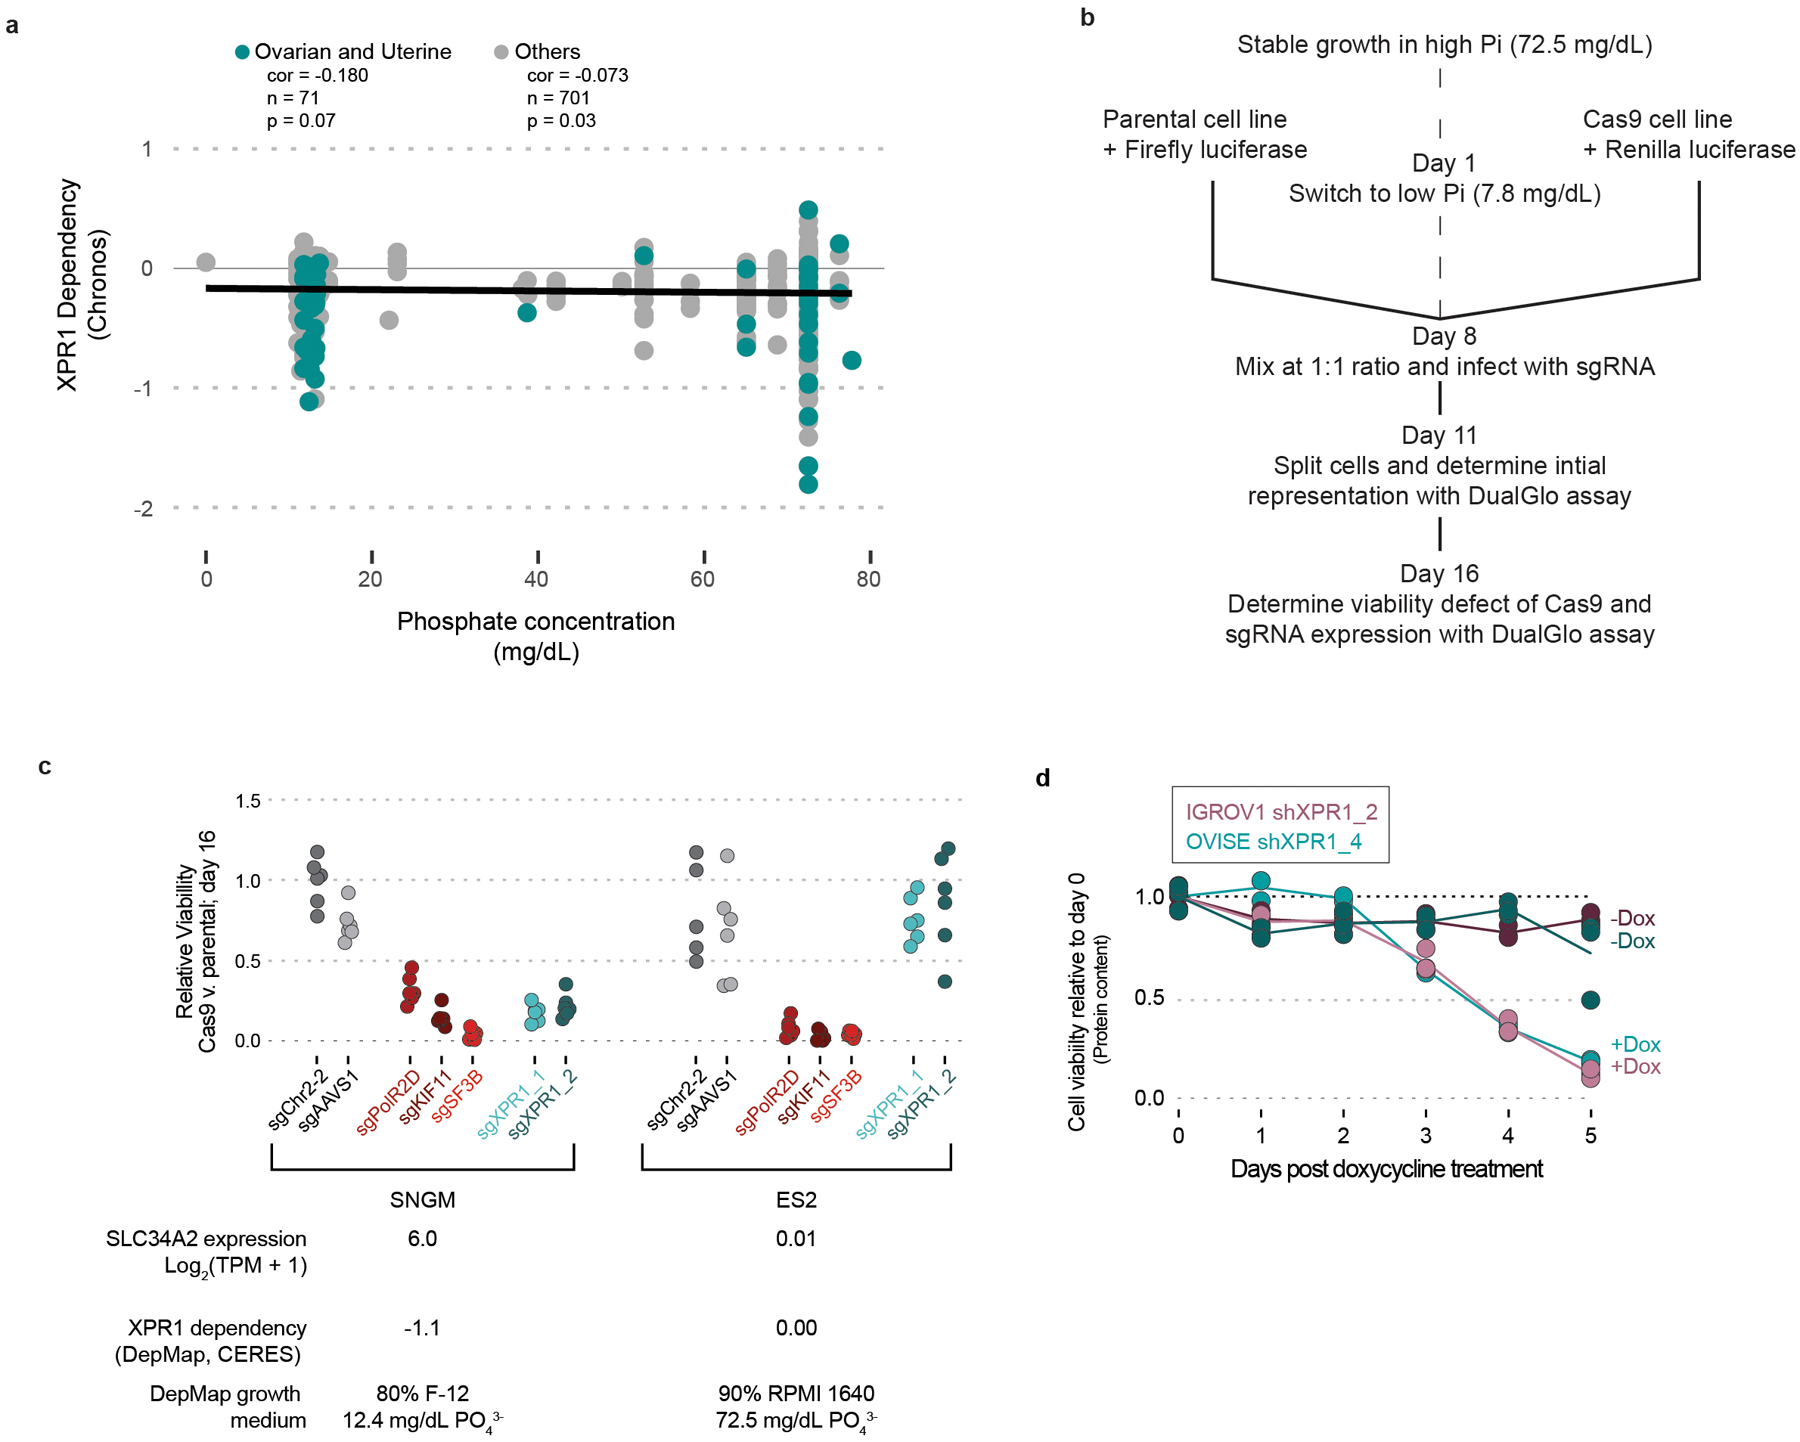
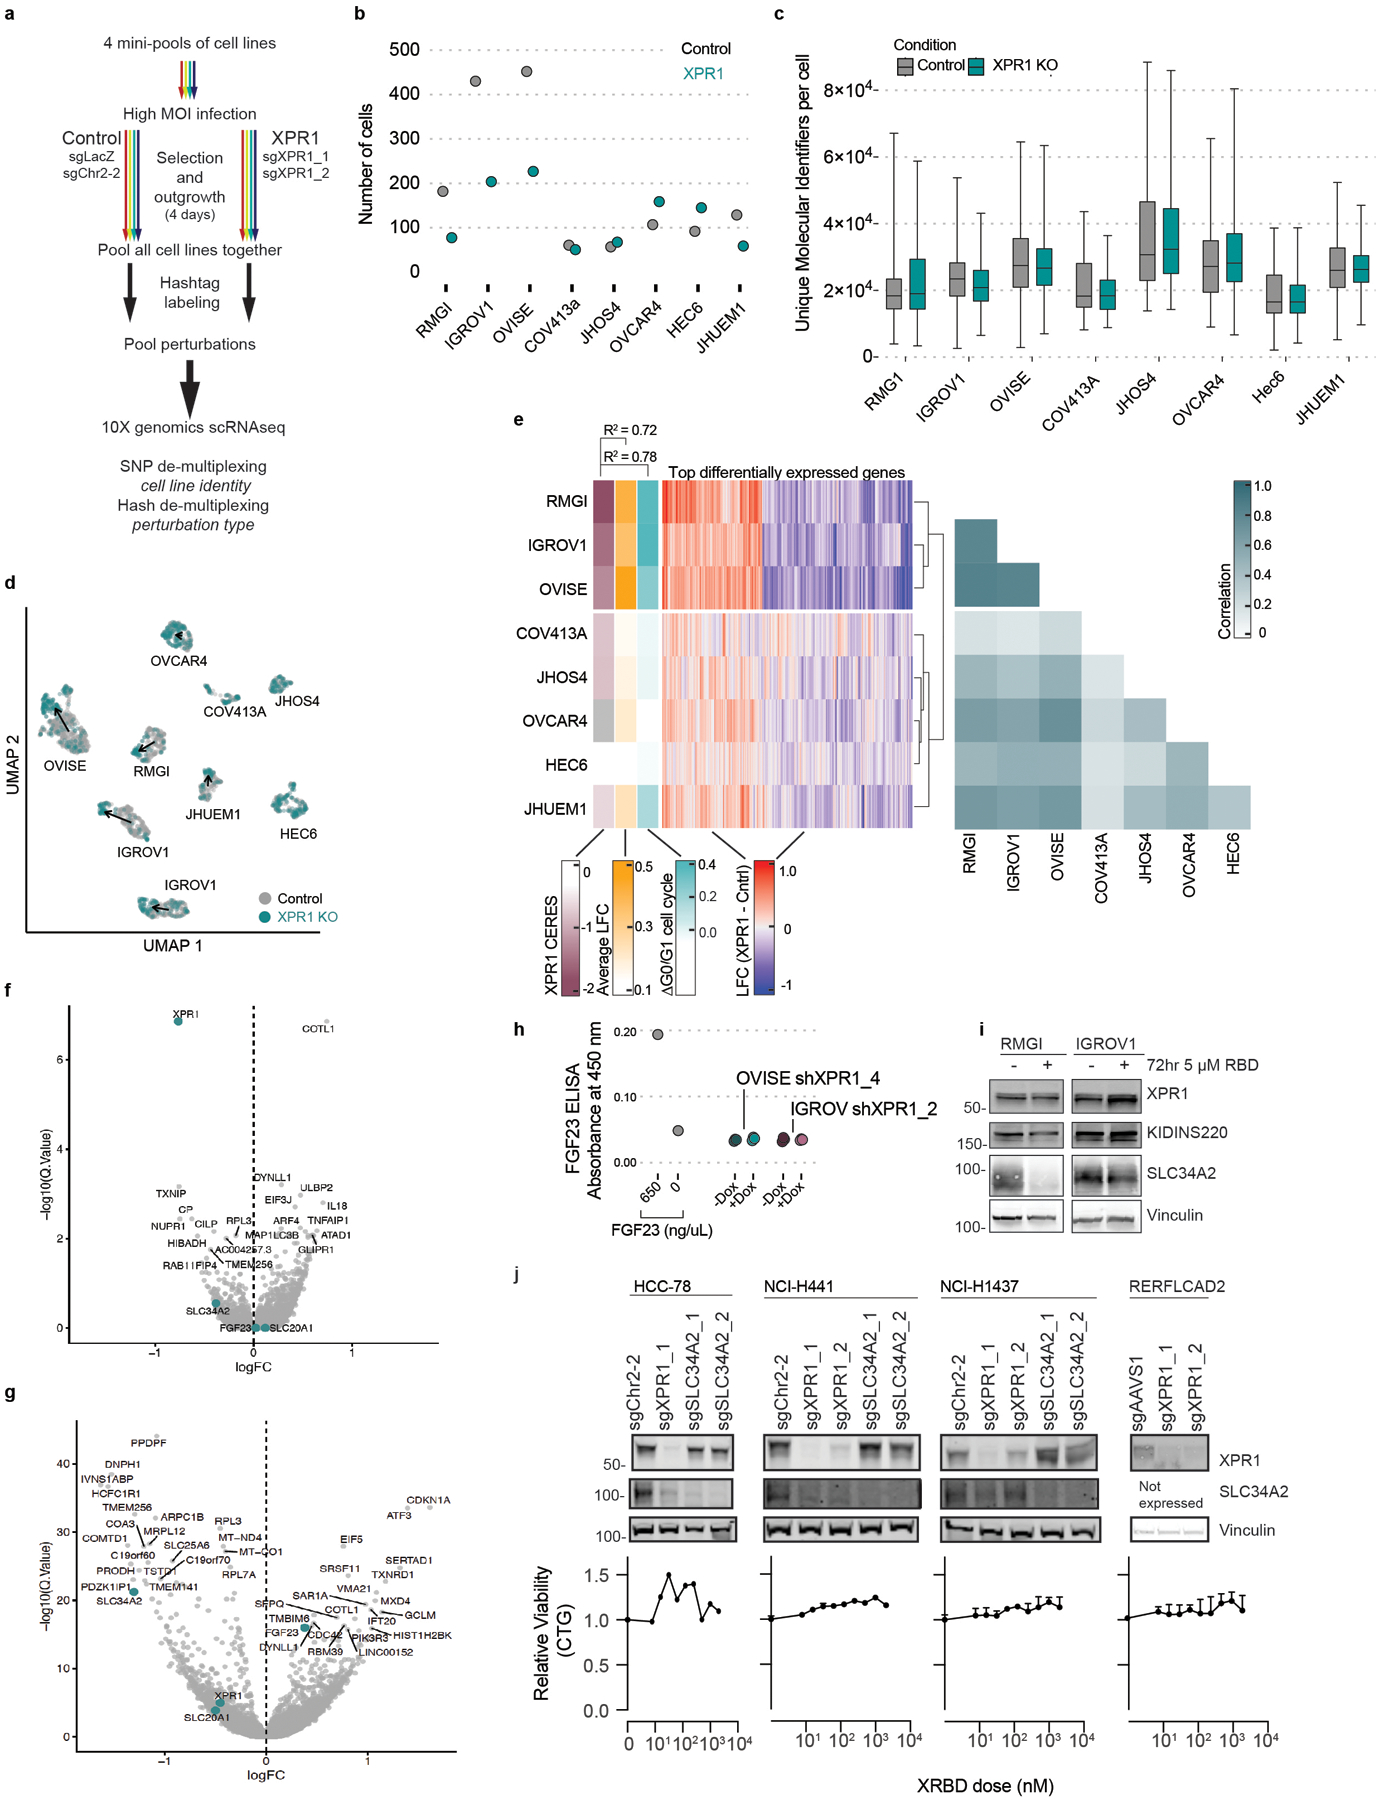
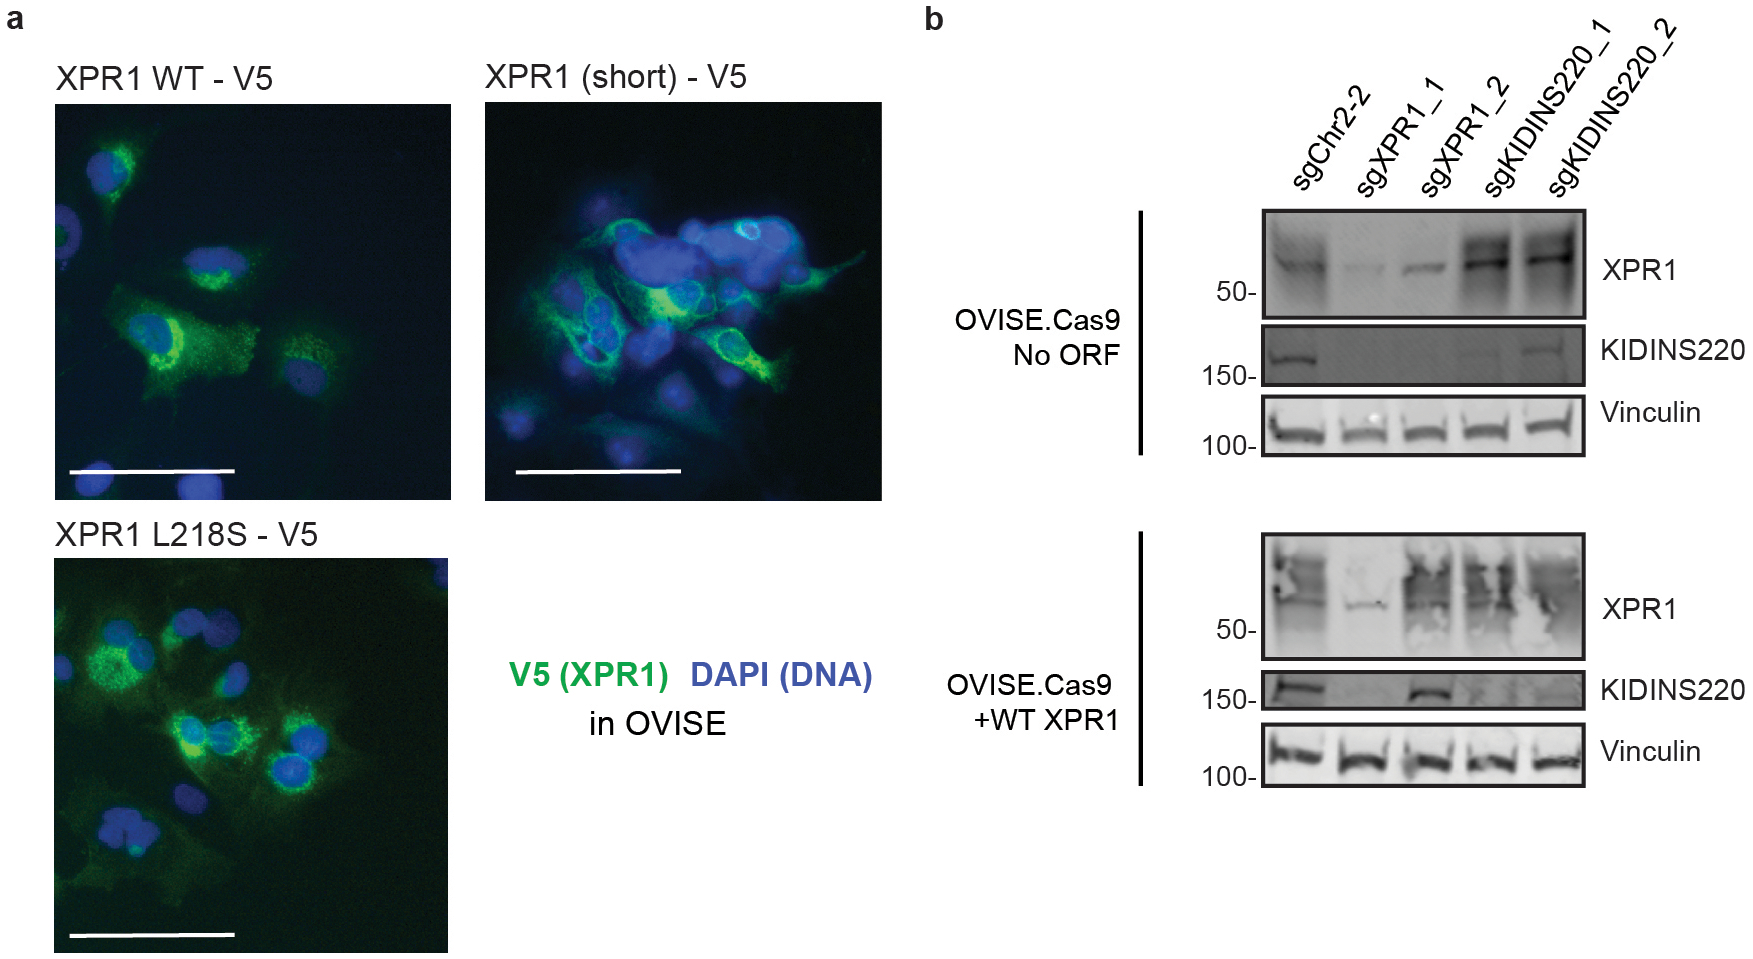
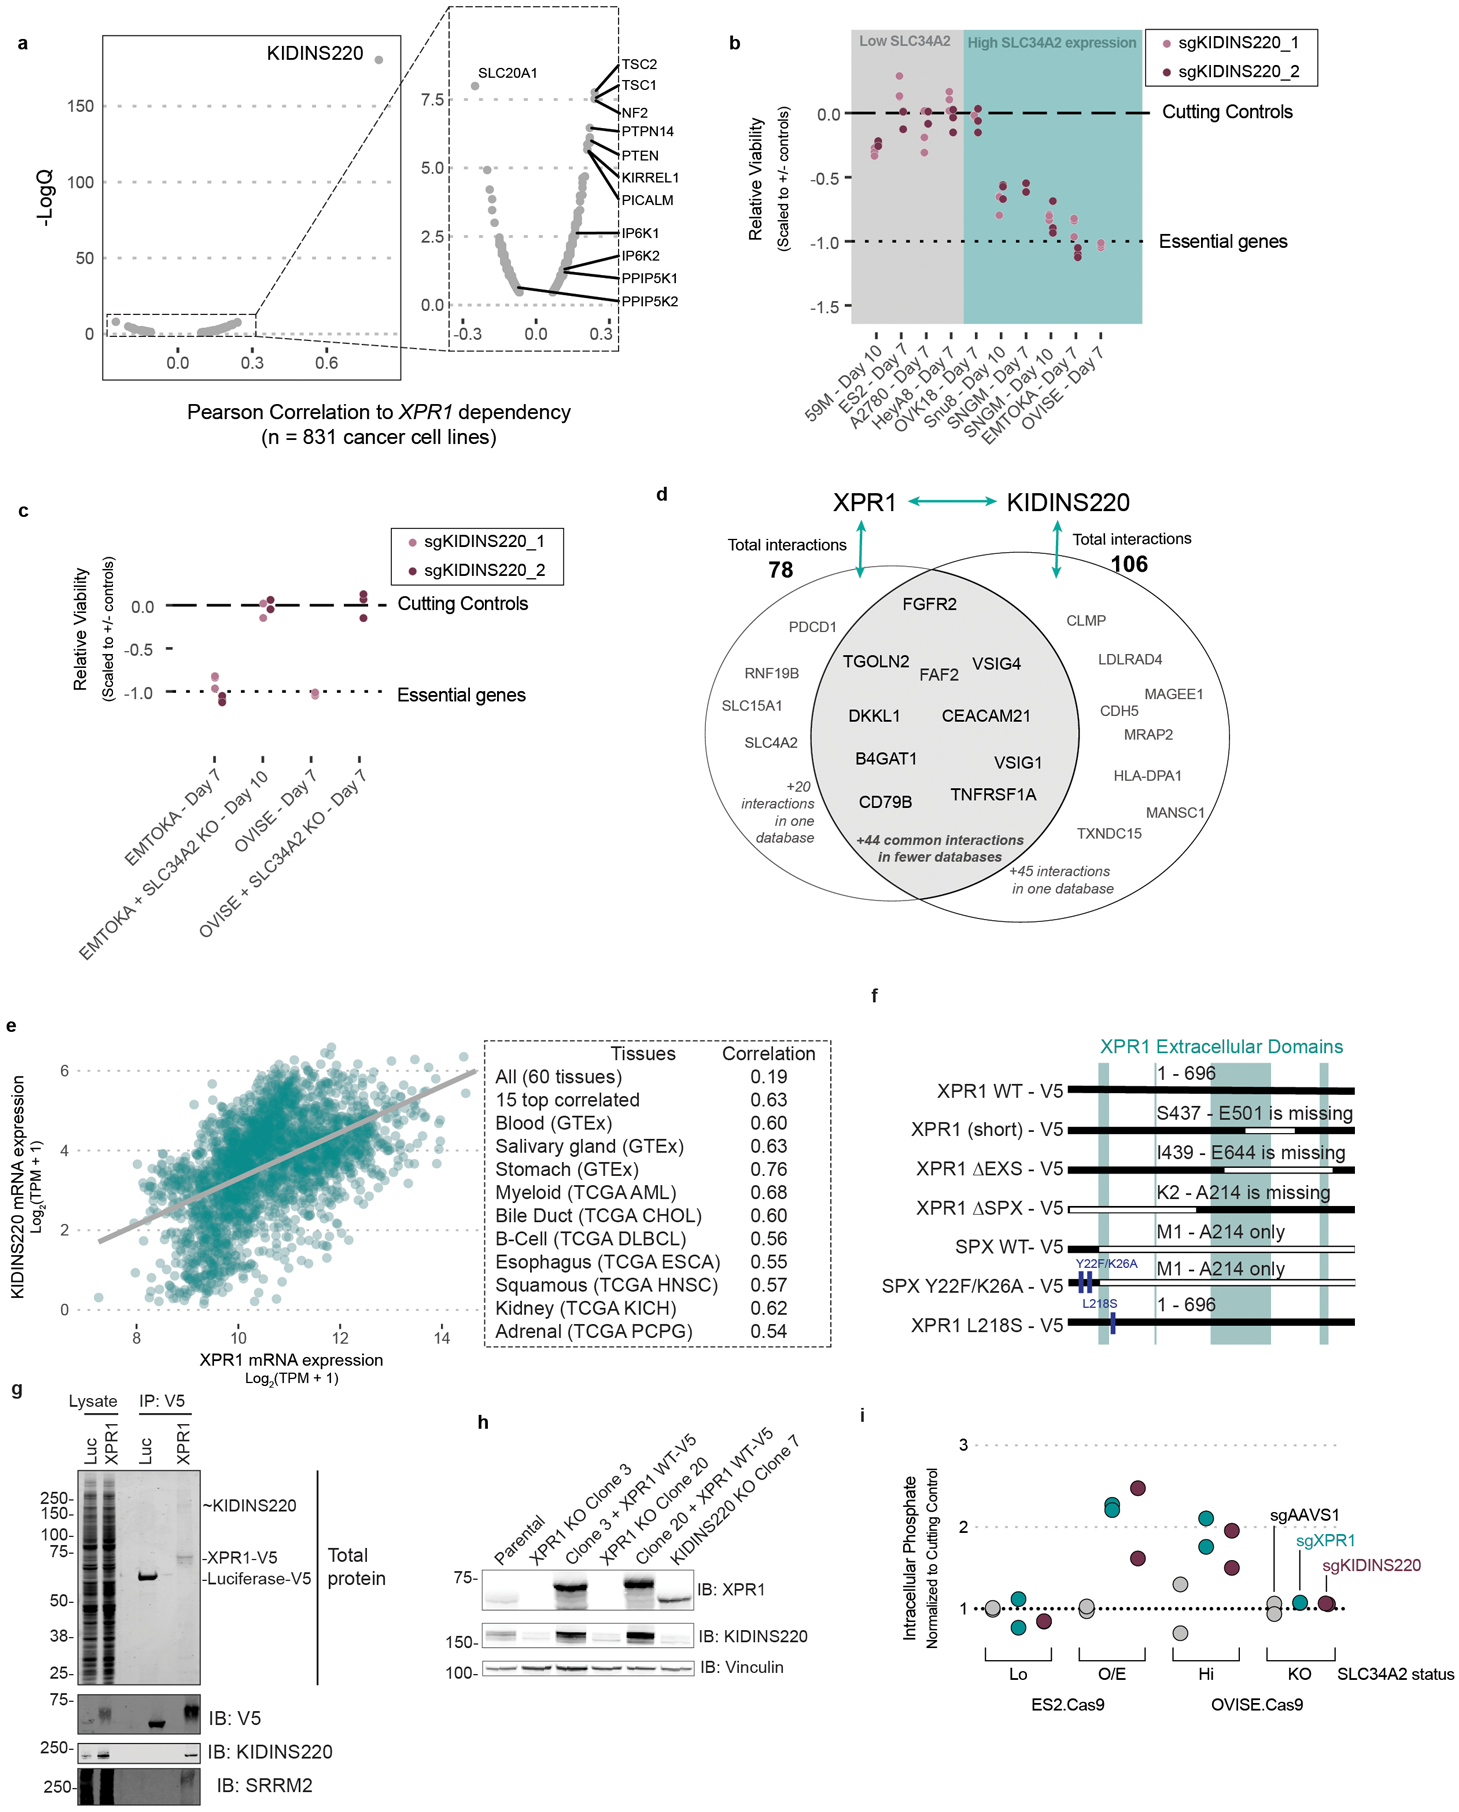
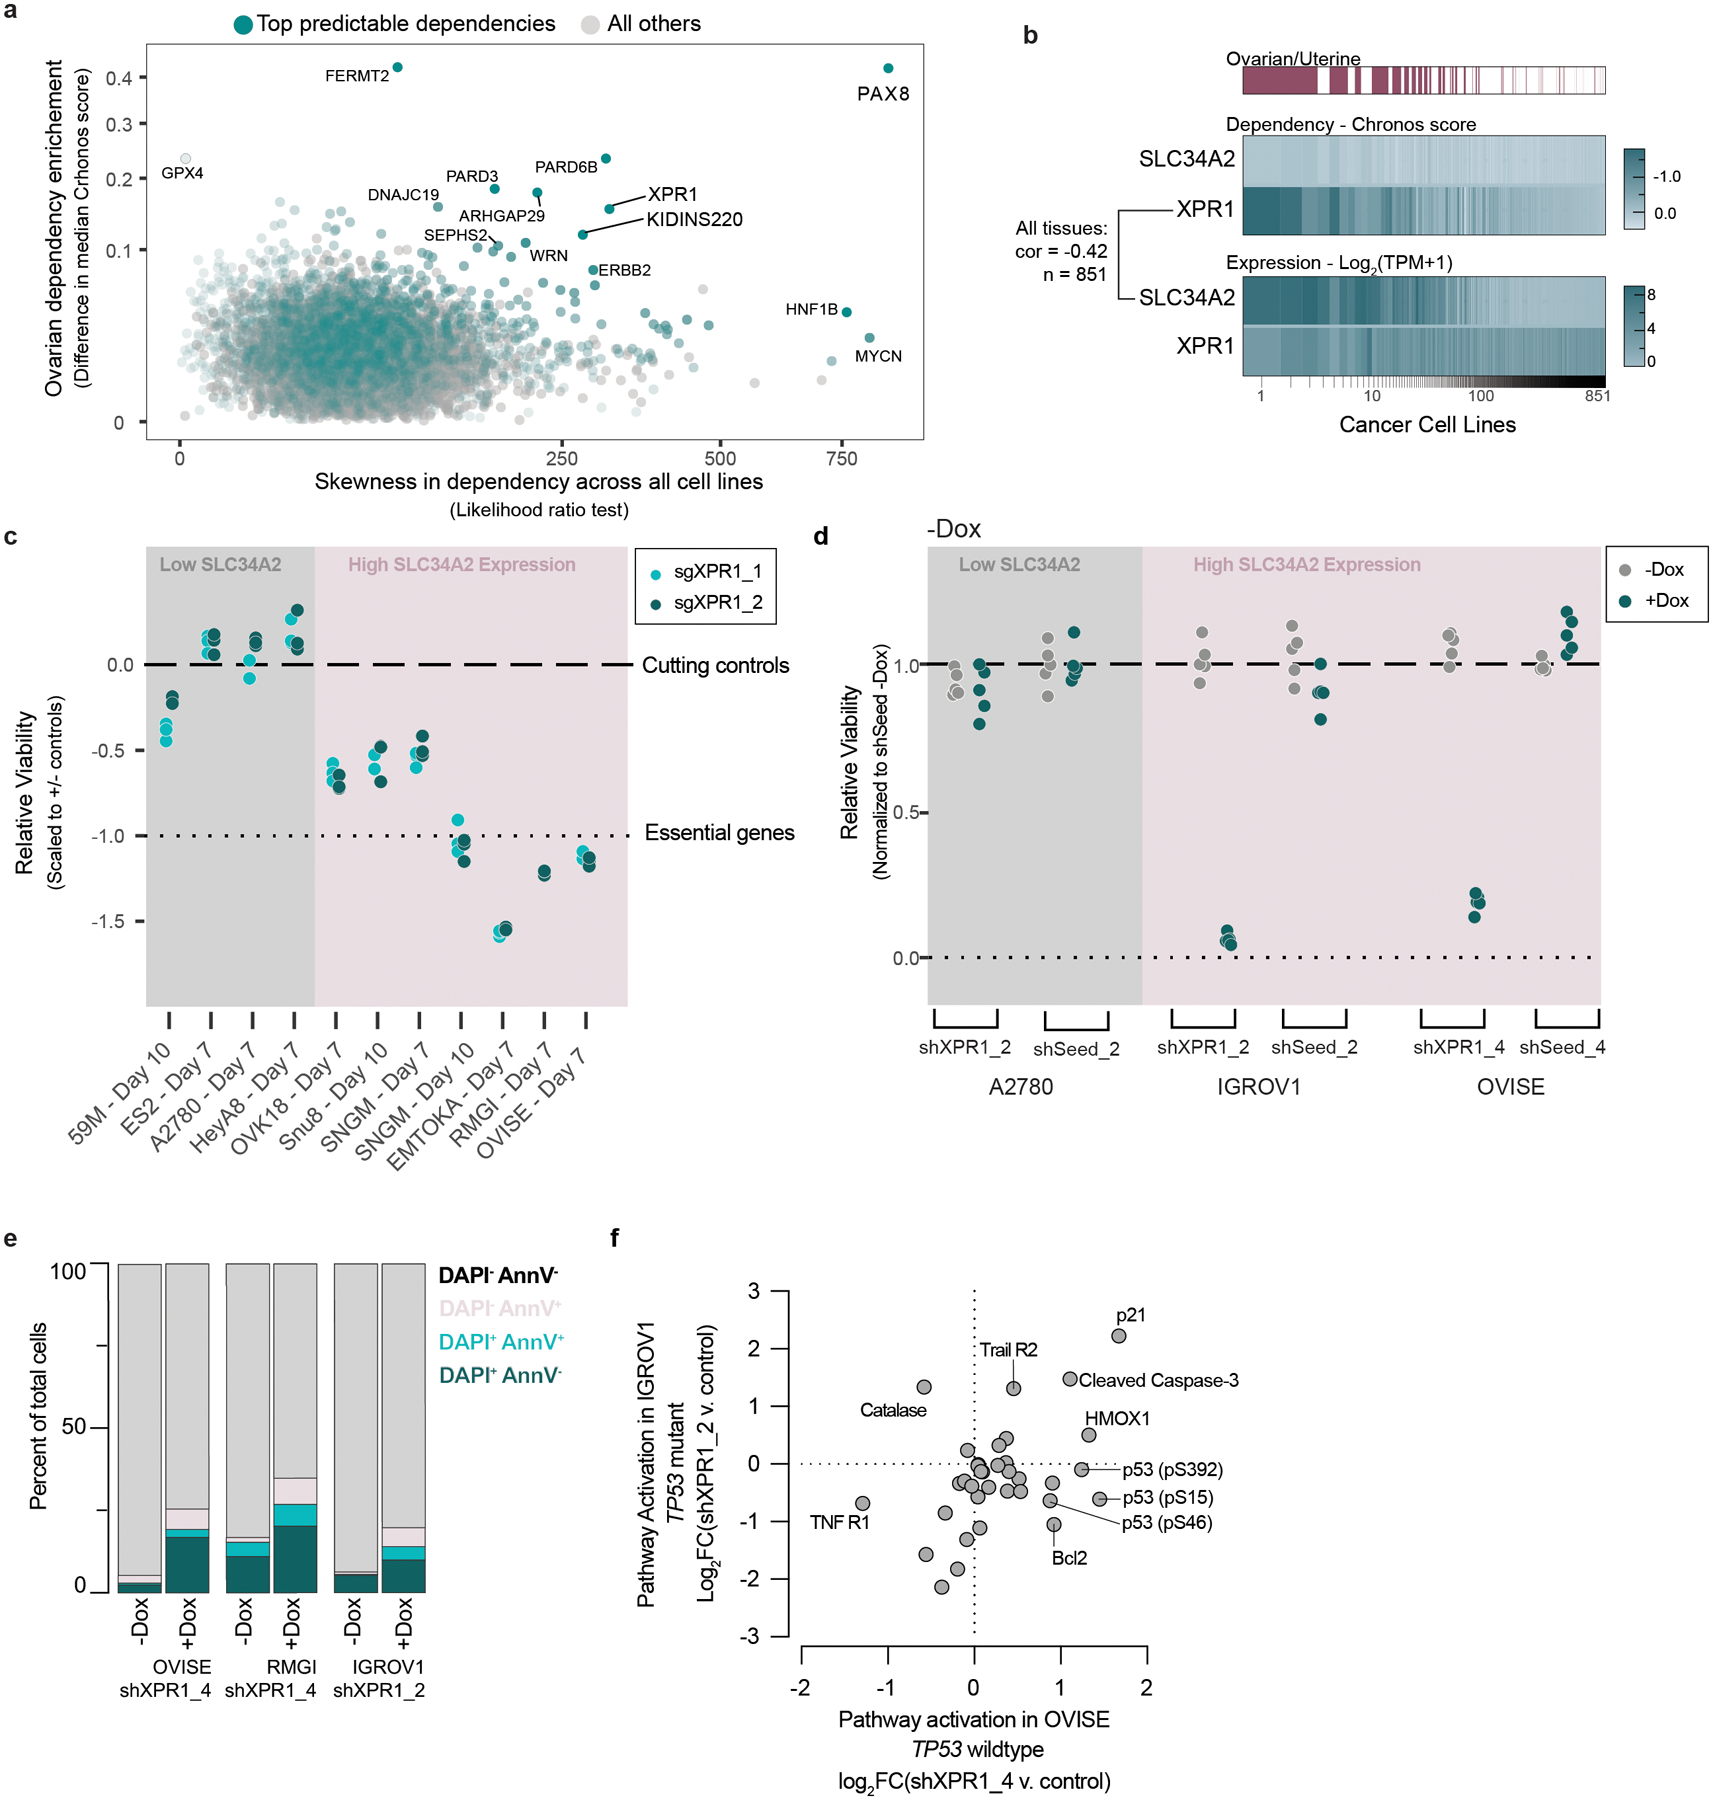
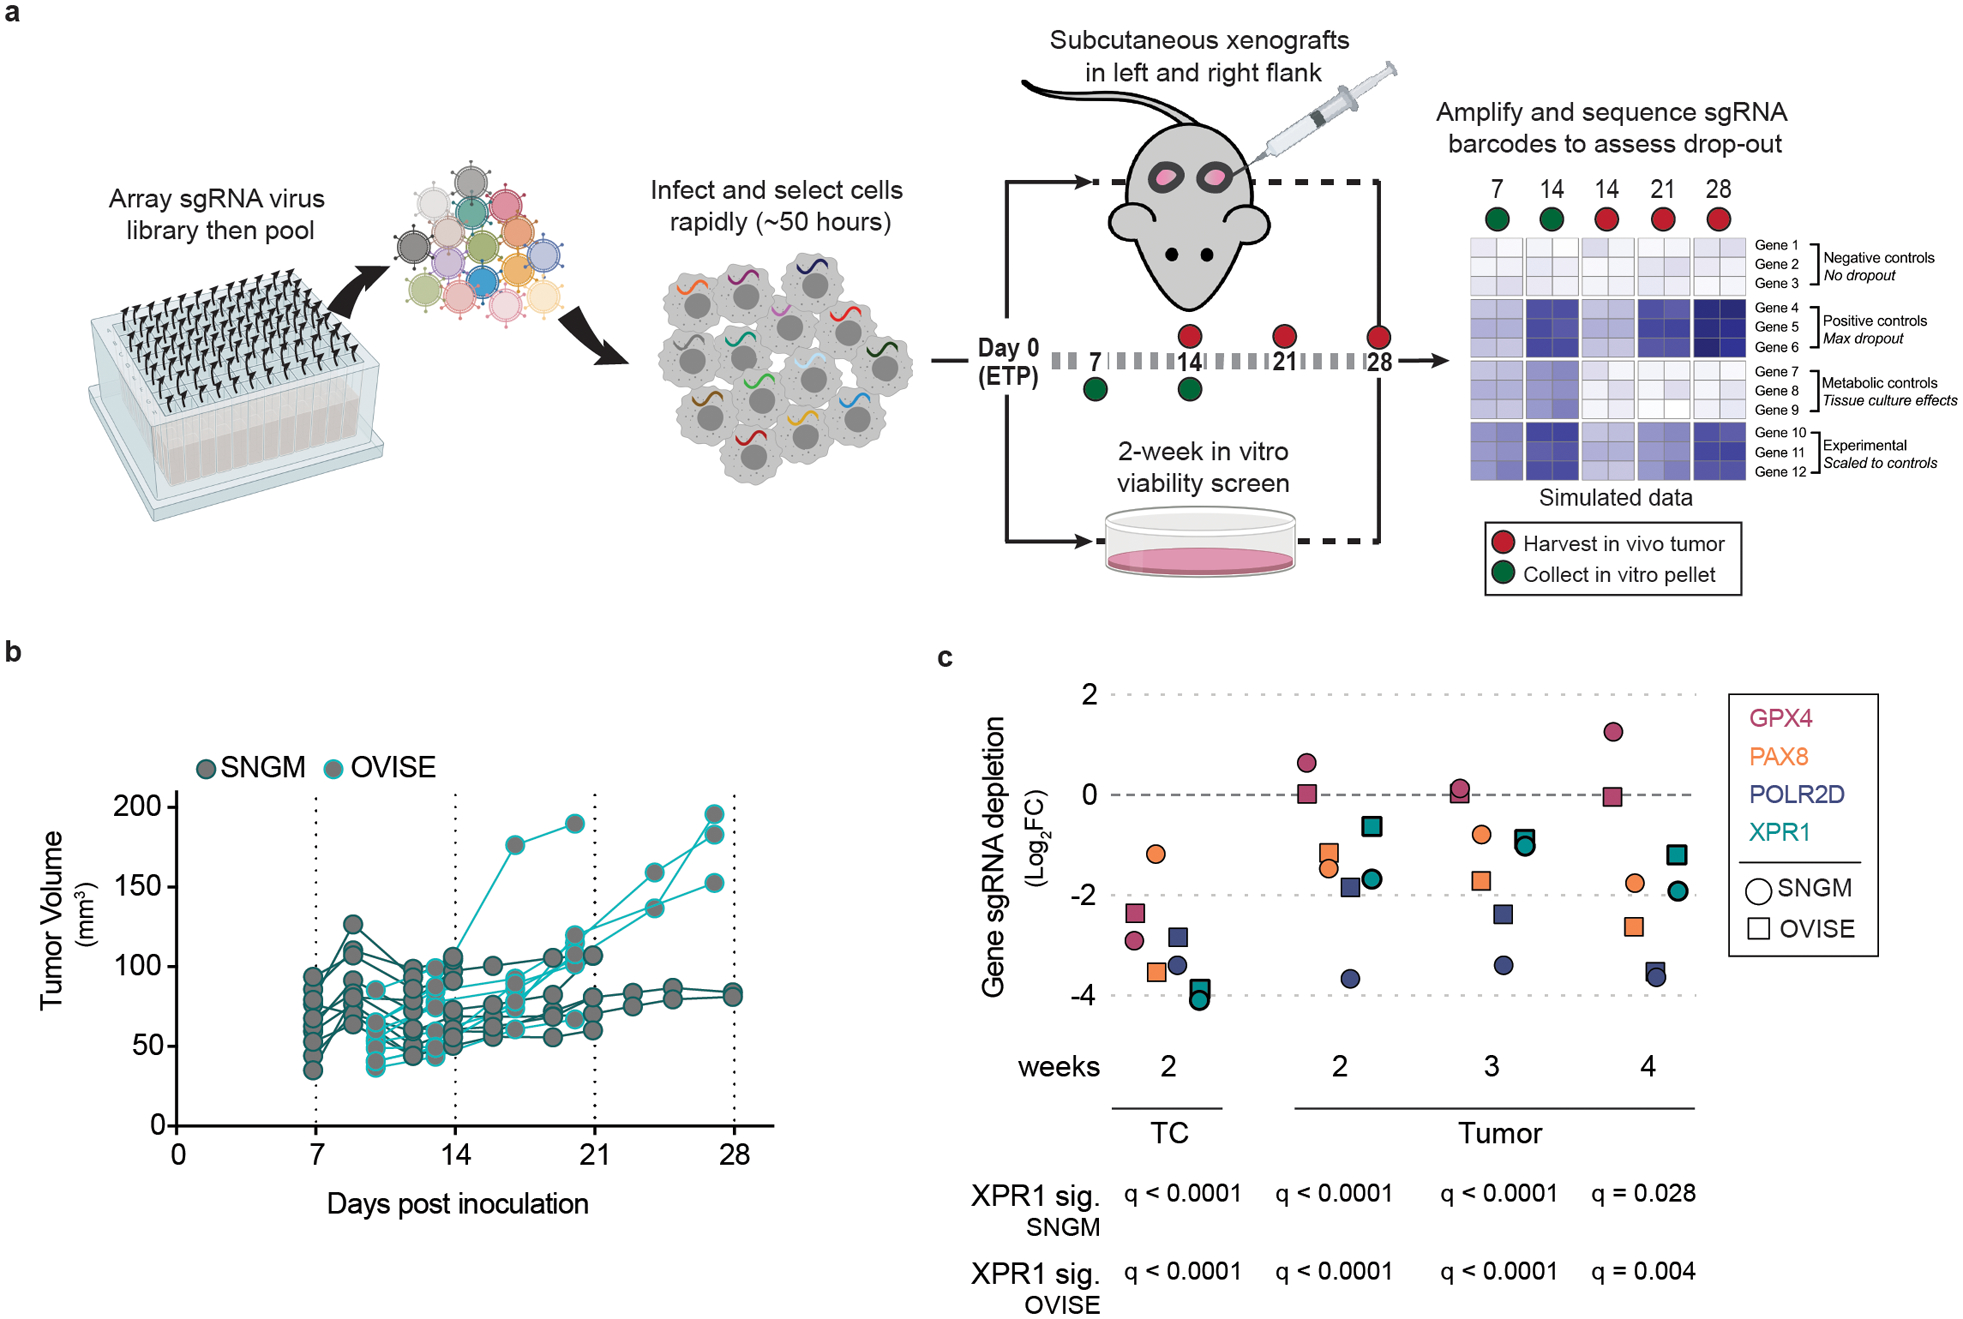
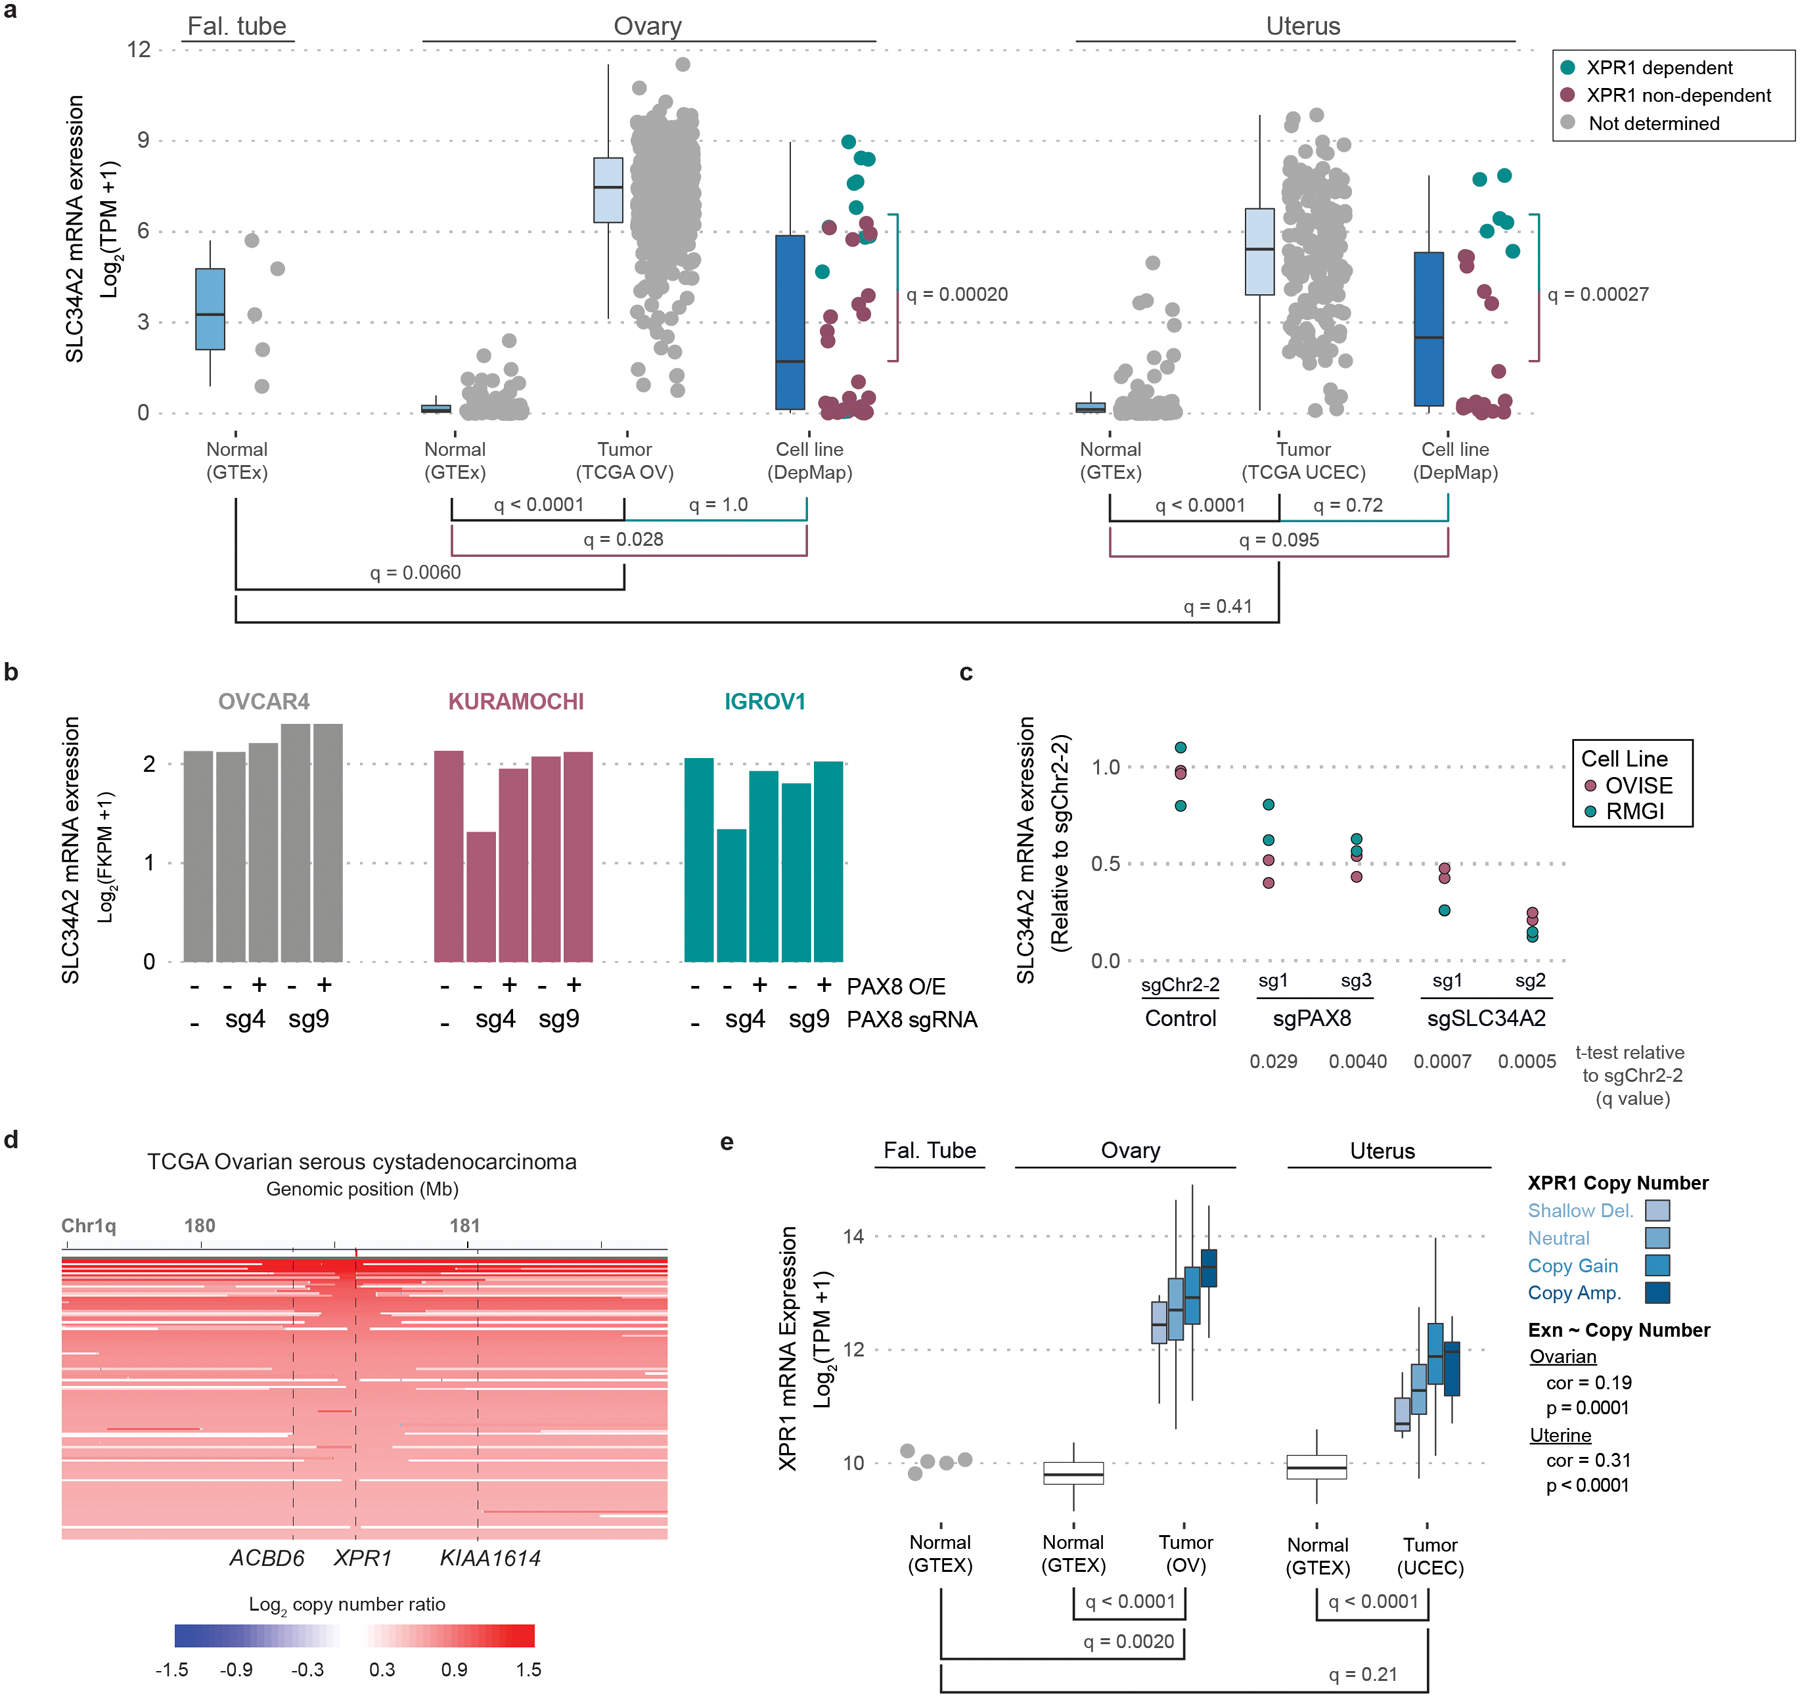
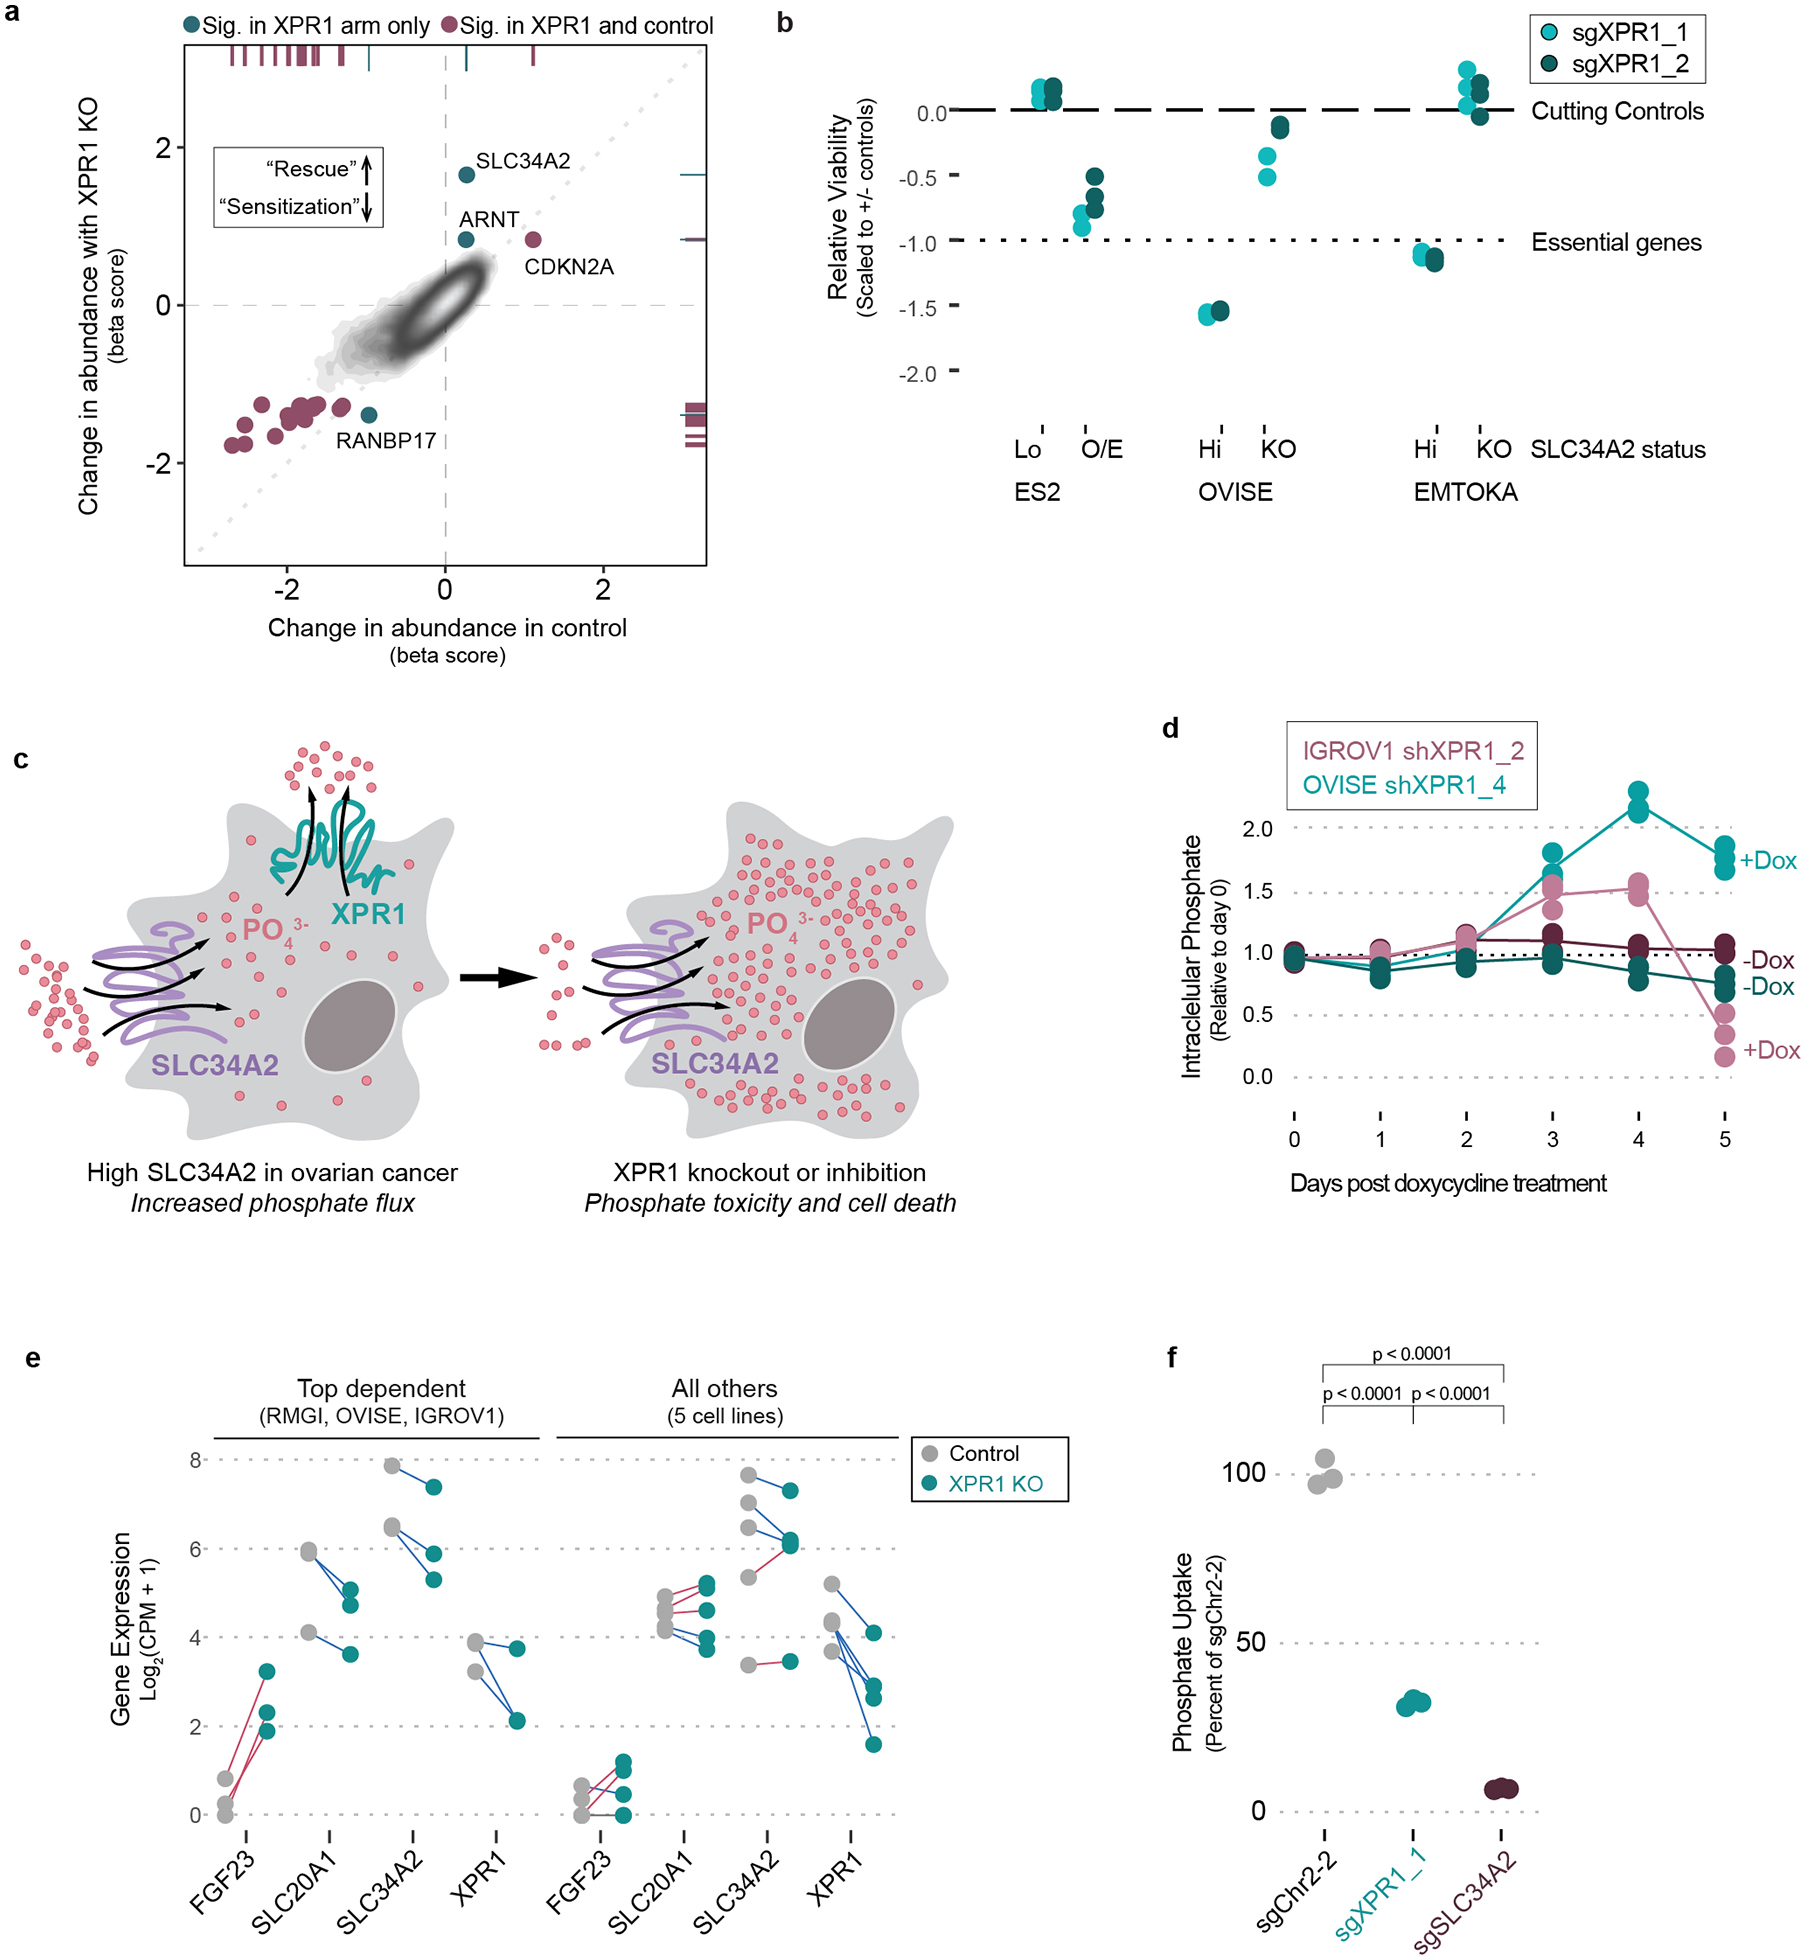
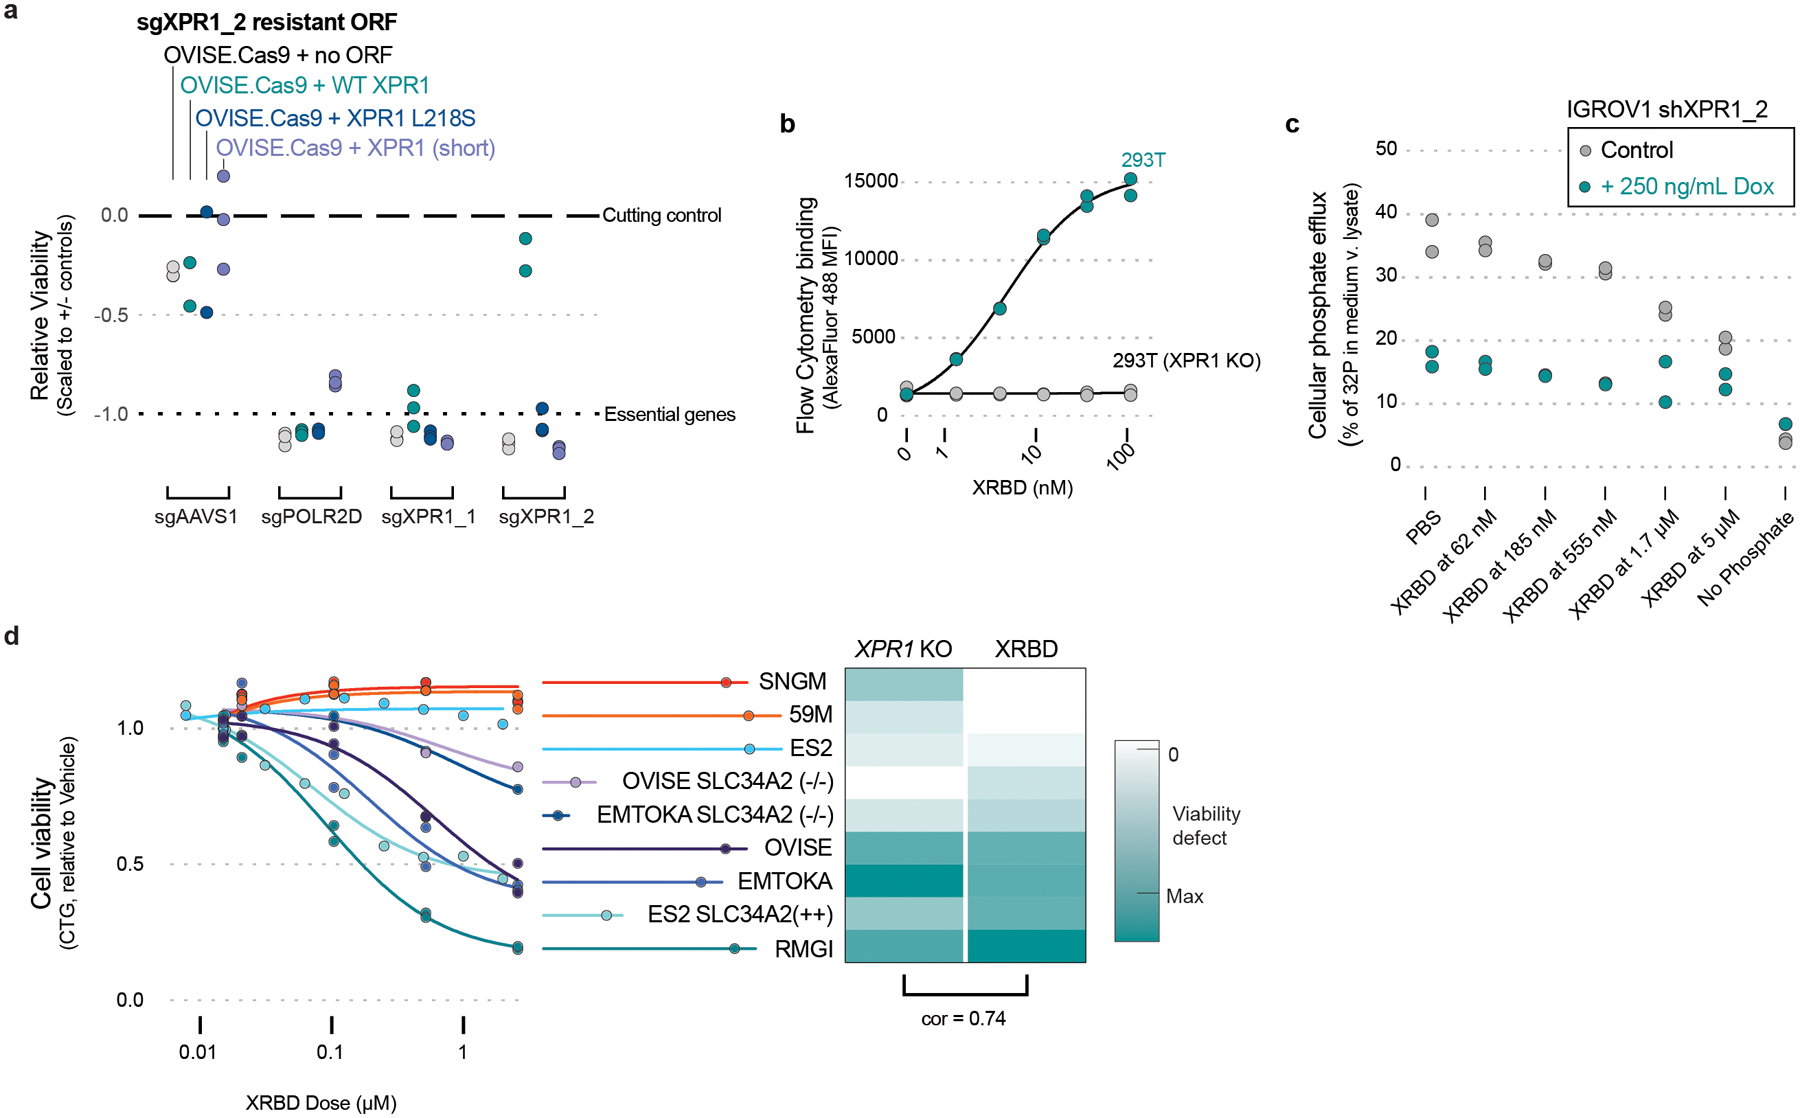
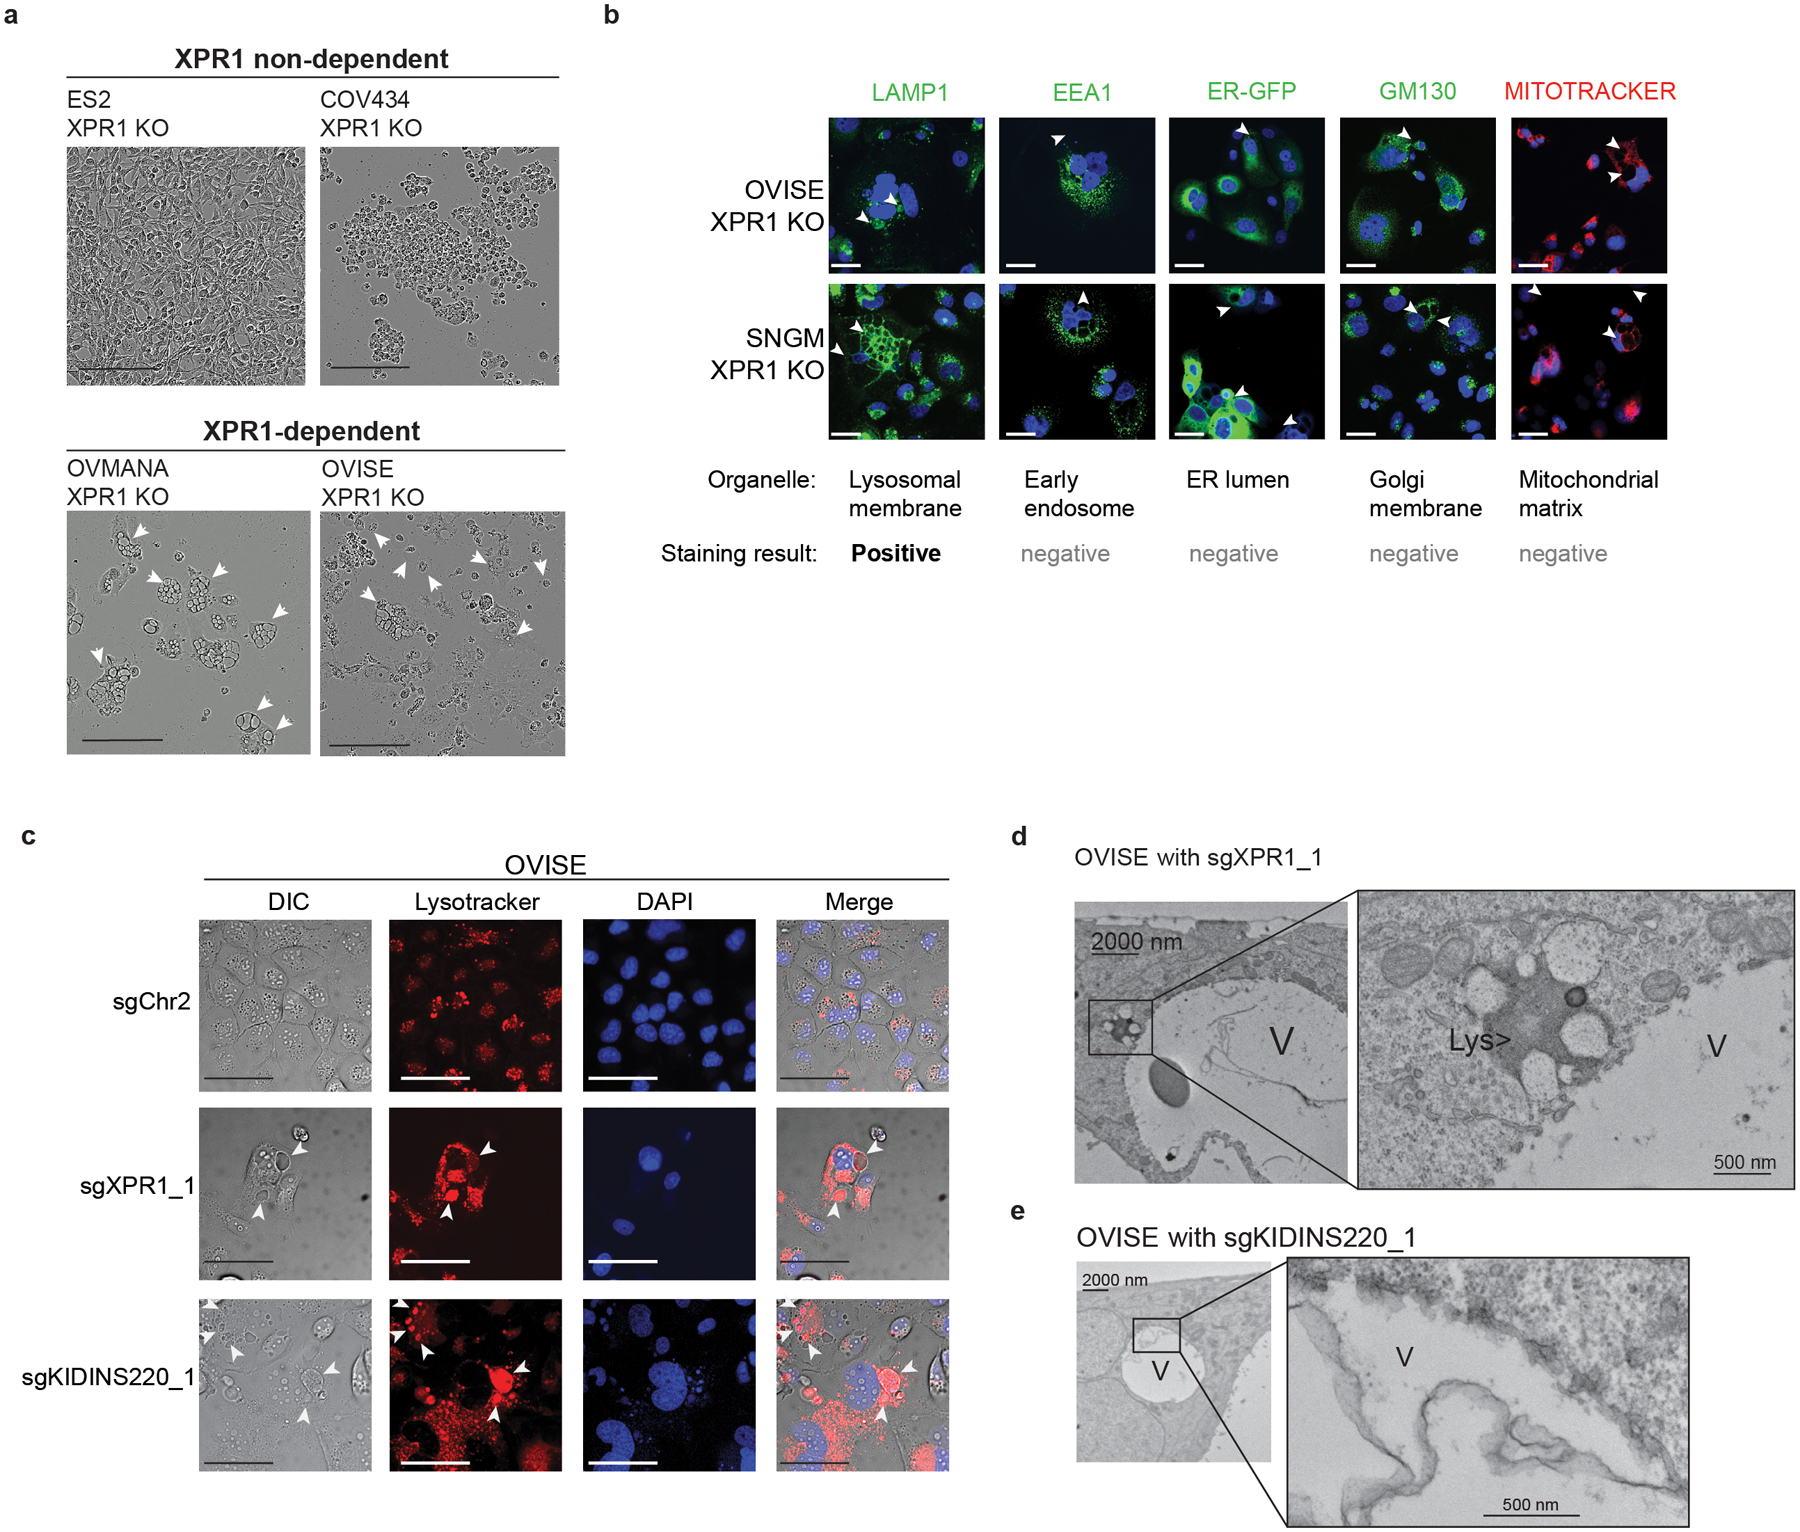
Despite advances in precision medicine, the clinical prospects for patients with ovarian and uterine cancers have not substantially improved. Here, we analyzed genome-scale CRISPR-Cas9 loss-of-function screens across 851 human cancer cell lines and found that frequent overexpression of SLC34A2-encoding a phosphate importer-is correlated with sensitivity to loss of the phosphate exporter XPR1, both in vitro and in vivo. In patient-derived tumor samples, we observed frequent PAX8-dependent overexpression of SLC34A2, XPR1 copy number amplifications and XPR1 messenger RNA overexpression. Mechanistically, in SLC34A2-high cancer cell lines, genetic or pharmacologic inhibition of XPR1-dependent phosphate efflux leads to the toxic accumulation of intracellular phosphate. Finally, we show that XPR1 requires the novel partner protein KIDINS220 for proper cellular localization and activity, and that disruption of this protein complex results in acidic "vacuolar" structures preceding cell death. These data point to the XPR1-KIDINS220 complex and phosphate dysregulation as a therapeutic vulnerability in ovarian cancer.


Conflict of interest statement

Competing Interests Statement

FV receives research funding from Novo Holdings. DER receives research funding from the Functional Genomics Consortium (Abbvie, Jannsen, Merck and Vir) and is a director of Addgene. TRG previously received cash and/or equity compensation for consulting to GlaxoSmithKline, Sherlock Biosciences and FORMA Therapeutics, currently is a paid consultant to Anji Pharmaceuticals, and receives research funding from Bayer HealthCare, Calico Life Sciences, and Novo Holdings. W.C.H. is a consultant for ThermoFisher, Solasta, MPM Capital, iTeos, Frontier Medicines, and Paraxel and is a Scientific Founder and serves on the Scientific Advisory Board (SAB) for KSQ Therapeutics. All other authors declare no competing interests.

Figures

Extended Data Fig. 1
Extended Data Fig. 1. XPR1 dependency is observed selectively in SLC34A2-high cancer cell lines
a) For every cell line profiled in the Cancer Dependency Map dataset (N=851 cancer cell lines), the degree of XPR1 essentiality is plotted on the Y-axis. The Chronos score is a scaled value of gene essentiality, where 0 is the effect of CRISPR/Cas9 genome editing and −1 is the effect of inactivation of pan-essential genes. Note that the ovarian lineage is separated into cancer subtypes. b) For every tissue type, the 10 highest SLC34A2 expressing cell lines were analyzed for their median expression of SLC34A2 (X-axis) and dependency on XPR1 (Y-axis). Note that some lineages may have less than 10 cell lines. Color encodes the correlation of SLC34A2 expression and XPR1 dependency across all cell lines within that lineage. c) Comparison of analytical methods for CRISPR/Cas9 genome-scale loss of function screens.
Extended Data Fig. 2
Extended Data Fig. 2. Validation of SLC34A2 and XPR1 protein levels and viability defects upon shRNA induction.
a) Validation of SLC34A2 in cell lines using immunohistochemistry. N=1 experiment. b) Five days after viral transduction of the indicated sgRNA in the indicated cell lines stably expressing Cas9, cells were harvested and XPR1 levels were analyzed by immunoblotting. Note that irrelevant lanes were cropped out for clarity, but that this image represents a single blot at a single exposure. N=1 technical replicate of at least N=5 representative experiments. c) Three days after induction of shRNA, protein levels were measured in cellular lysates by protein simple. Protein levels normalized to vinculin and the untreated (-Dox) conditions are expressed below each band. Note that shXPR1 reagents effectively suppress XPR1 protein levels but shSeed reagents do not. N=1 technical replicate of at least N=5 representative experiments. d) Colony formation assay to measure the long-term (14 day) penetrance and viability effect of suppression of XPR1 using shRNA in IGROV1 and OVISE cells . N=3 technical replicates of at least N=2 representative experiments. d) Colony formation assay to measure the long-term (14 day) penetrance and viability effect of suppression of XPR1 using shRNA in IGROV1 and OVISE cells . N=3 technical replicates of at least N=2 representative experiments. e) Growth curves of SLC34A2-expressing cell lines after suppression of XPR1. In 96-well plates, confluency of the indicated cell lines was assessed every 4 hours. N=3 technical replicates of at least N=2 representative experiments. f) Six days after induction of shXPR1 in the indicated cell lines, cells were stained with DAPI to distinguish live and dead cells and Annexin V to distinguish non- and pre-apoptotic cells. N=2 flow cytometric analyses of at least 10,000 cells, representative of N=2 experiments.
Extended Data Fig. 3
Extended Data Fig. 3. In vivo CRISPR/Cas9 competition assays for target validation in mouse xenografts
a) sgRNA abundance in SNGM tumor xenografts was evaluated by PCR and next-generation sequencing analysis, and the fold change compared to the early time point is shown as a heatmap for all of the negative control genes as well as any gene with a >4 fold change in abundance in any of the screens. Each tumor/replicate is shown as an individual column, N=1 transduction. b) Same as in d, but with the OVISE cancer cell line.
Extended Data Fig. 4
Extended Data Fig. 4. SLC34A2 in ovarian cancer is likely driven by PAX8
a) Using the combined GTEx, TCGA, and CCLE dataset, the differential expression of SLC34A2 in each tissue relative to the average of all tissues is compared. The relevant gynecological tissues (fallopian tube, ovary, and uterus) are highlighted in teal. The false discovery rate (FDR) was calculated using a two-sided Wilcoxon ranked sum test comparing each group to the average expression across all groups and correcting for multiple comparisons using Bonferoni’s method. The Cancer Genome Atlas abbreviations used include: LUAD = Lung adenocarcinoma; THCA = Thyroid carcinoma; KRP = Kidney renal cell papillary carcinoma ; LUSC = Lung squamous cell carcinoma; OV = Ovarian serous cystadenocarcinoma; UCEC = Uterine corpus endometrial carcinoma. b) The expression of PAX8 and SLC34A2 mRNA in the indicated tissues is plotted. The pearson correlation within these samples is indicated. c) Expression of PAX8 across the indicated tissues was compared as in Figure 3a. See methods for exact N values. Boxplots are drawn indicating the first and third quartiles, and whiskers span to the largest value within 1.5x the interquartile range. d) Immunoblot validation of CRISPR-interference mediated suppression of PAX8. N=1 technical replicate, representative of N=2 independent experiments. e) Gene expression - relative to un-perturbed, parental cell lines profiled in parallel - of reported PAX8 target genes (see main text) after stable overexpression of WT-PAX8 (“PAX8 O/E”) and/or induction of PAX8-target (sg4) or control (sg9) sgRNA and dCas9-KRAB. Data represents a single experiment. N=1 replicate. f) XPR1 expression across all tissues in TCGA and GTEx, with ovarian and uterine tissues highlighted in teal. Boxplots are drawn as in b. g) XPR1 copy number heatmap for a ~2.5 Mb region of chromosome 1 indicating XPR1 amplification in TCGA Uterine Corpus Endometrial Carcinoma 20. Each patient sample is represented by a horizontal line. Red indicates copy gain and blue indicates copy loss. Data are a subset of the samples rank-ordered by highest copy gain to indicate both focal and chromosome arm-level gains.
Extended Data Fig. 5
Extended Data Fig. 5. A genome-scale CRISPR/Cas9 screen validates the relationship between XPR1 dependency in the context of high expression of SLC34A2
a) Outline of the experimental method and analysis for a genome-scale, dual-knock-out modifier screen. OVISE (without Cas9 expression) is engineered to stably express sgRNA targeting XPR1 (the “anchor” sgRNA). Upon introduction of “all-in-one” lentivirus, containing both Cas9 ORF and a second sgRNA, both genes are simultaneously inactivated by Cas9. We used three achor sgRNA: one targeting a gene desert on chromosome 2 (sgChr2-2) and two targeting XPR1 (sgXPR1_1 and sgXPR1_2) and infecting the cells with the Brunello genome-scale sgRNA library. 15 days after infection, cells were harvested, genomic DNA was isolated, and sgRNA barcodes were quantified with next generation sequencing. See methods for full experimental and analytical details. b) Western confirmation of dual-knock-out of XPR1 and SLC34A2. The three cell lines used in the genome-scale screen were infected with “all-in-one” lentivirus expressing control-, XPR1-, or SLC34A2-targeting sgRNA. Note that in the sgXPR1 “anchor” cell lines, XPR1 is suppressed with the control virus, indicating that the first infection provides XPR1-targeting sgRNA and the second infection provides Cas9 protein. NIC stands for “no-infection control’. N=1 technical replicate representative of N=3 independent transductions. c) Arm-level results of the genome-scale modifier screen. See methods for full analysis details. Beta-scores represent the extent to which a gene was enriched or depleted relative to the initial plasmid representation. An XPR1-positive and control-neutral score represents a likely rescue gene (i.e. SLC34A2 and ARNT). XPR1-positive and control-positive scores represent genes with profound viability defects without specificity for XPR1 (e.g. RANBP17). N=1 transduction per anchor condition, expanded and cultured as N=2 independent replicates.
Extended Data Fig. 6
Extended Data Fig. 6. The XPR1 dependency is not affected by phosphate levels in the tissue culture
medium a) The concentration of phosphate in the growth medium of DepMap cell lines does not determine the extent of XPR1 dependency. Concentrations of phosphate were estimated from manufacturer formulations (see methods) and the pearson correlation between growth medium phosphate and XPR1 dependency is indicated. b) Experimental procedure for manipulating tissue culture medium and assessing its effect on XPR1 dependency. The same parental cancer cell line was engineered to express firefly luciferase and Cas9, or Renilla luciferase alone. After a one-week adaptation to lowered phosphate, the two variants were mixed together and infected with sgRNA-encoding lentivirus. After selection for lentivirus-infected cell lines, the initial representation of Cas9:parental cells was determined by measuring the ratio of Firefly:Renilla luciferase using a DualGlo assay (Promega). One week after infection (Day 16 of the protocol), the extent to which genetic perturbation was detrimental to cell viability was determined using the DualGlo assay. c) The XPR1 dependency is maintained in a low phosphate medium condition. SNGM and ES2 were profiled in the assay outlined in panel b. Note that the CERES score - displayed below the plot - represents the viability defect of the cell line 21 days after knock-out of XPR1 and growth in the indicated growth medium. N=5 technical replicates representative of N=2 experiments. d) The viability of cells (as measured by total protein content) was measured in parallel with total phosphate as in Figure 4d. N=3 technical replicates representative of N=4 independent experiments per cell line.
Extended Data Fig. 7
Extended Data Fig. 7. Transcriptional profiling reveals a phosphate-related homeostatic response after XPR1 inactivation
a) Experimental workflow to determine the transcriptional profile of XPR1 inactivation across many different cancer cell lines. See methods for full details; N=1 transduction event for panels b-g. b) The total number of cells per cell line de-multiplexed from the 10X scRNAseq library. c) The total number of unique transcripts measured for each cell, as measured by unique molecular identifiers (UMIs). Box plots represent the 1st – 3rd quartiles, with whiskers representing the minimum and the maximum. The exact N for each sample in c is indicated in panel b. d) UMAP projection of the 2,501 cells from the indicated cell lines (determined by SNP profiles) and perturbations (indicated by cell-surface antibody ‘hash-tag’ labeling). Arrows indicate the degree to which the average transcriptional profile changes between the control sgRNA and the sgXPR1 infection condition. e) Summary of transcriptional effects across cell lines after inactivation of XPR1. Middle, the log-fold change of the top 500 differentially expressed genes after regressing out the effect of cell cycle. Left, summary annotations for each cell line include XPR1 dependency (XPR1 CERES), the overall transcriptional change (average log2 fold-change), and the degree of cell cycle arrest observed in the single-cell data (ΔG0/G1). The pearson correlation of these values is shown above the heatmap. Right, the pearson correlation of the top 500 differentially expressed genes between each cell line. f) Differentially expressed genes - after correcting for cell cycle - in the less sensitive cell lines (COV413a, JHOS4, OVCAR4, HEC6, and JHUEM1). Significance was assessed by the limma-voom pipeline using a two-tailed statistical test (see methods). g) Same as in f, but for the highly correlated cell lines RMG1, IGROV1, and OVISE. h) Four days after induction of shXPR1_2 (IGROV1) or shXPR1_4 (OVISE) using doxycycline, the amount of secreted FGF23 was measured in the conditioned medium using ELISA. N=2 technical replicates representative of N=3 independent experiments. i) 72 hours after treatment with the XPR1 inhibitor XRBD, the indicated proteins were detected using immunoblot. N=1 technical replicate representative of N=2 independent experiments. j) Top, western blot analysis of SLC34A2 and XPR1 in the SLC34A2-high yet XPR1-insensitive lung cancer cell lines, five days after infection with lentivirus expressing the indicated sgRNA. Bottom, viability of the indicated cancer cell lines was assessed using Cell Titer Glo after a five day XRBD treatment to inhibit XPR1. Points represent the mean of N=3 technical replicates; error bars represent standard error of the mean. Data are representative of N=2 independent experiments.
Extended Data Fig. 8
Extended Data Fig. 8. Open-reading frames of XPR1 resistant to CRISPR/Cas9-mediated gene editing.
a)Immunofluorescent localization of XPR1 mutants using the V5 epitope tag. Left, WT XPR1 localizes to the secretory pathways as well as puncta within the cytoplasm. Middle, XPR1 (short) staining appears more diffuse. Note similar localization patterns between L218S and wildtype XPR1 alleles. Scale bar = 200 μm. N=1 experiment representative of N=2 independent transductions. b) Western blot validation of guide-resistant ORF. OVISE.Cas9 cells (parental, left, or overexpressing the WT XPR1 ORF, right, used in Figure 3e) were infected with the indicated sgRNA and harvested 5 days after infection. The XPR1 ORF includes a mutation to block binding of sgXPR1_2 but not sgXPR1_1. Note the inactivation of both endogenous and overexpression ORF with sgXPR1_1 and only endogenous XPR1 with sgXPR1_2. N=1 experiment representative of N=2 independent transductions.
Extended Data Fig. 9
Extended Data Fig. 9. KIDINS220 is a unique partner protein of the XPR1 phosphate efflux complex.
a) Genetic dependency correlations to XPR1 dependency across 851 cancer cell lines was assessed by pearson correlation test and corrected for multiple comparisons using the Benjamini-Hochberg method. Genes with significantly correlated dependency profiles are highlighted, as are proteins with known connection to XPR1 regulation. b) The viability defect of the indicated cancer cell lines after KIDINS220 inactivation was evaluated as in Figure 1c. N=3 technical replicates representative of at least N=2 independent transductions per cell line. c) SLC34A2 was inactivated in EMTOKA and OVISE, and the KIDINS220 dependency was evaluated as in b. N=3 technical replicates representative of at least N=2 independent transductions per cell line. d) The interacting partners of XPR1 and KIDINS220 were downloaded from the BioGrid and Bioplex databases and compared. Proteins present in the XPR1 or KIDINS220 interactomes are highlighted as text. e) Left, the mRNA expression of XPR1 and KIDINS220 is shown for the fifteen tissues with the highest correlation in expression. The line represents linear regression for these samples (N = 2,799). Right, the Pearson correlation for those tissues, highlighting the diverse tissues in which there is a high correlation between XPR1 and KIDINS220 expression. f) Mutants of XPR1 used in this manuscript. XPR1 WT refers to the 696 amino acid protein produced by NM_004736 (the only isoform detected by RT-PCR of OVISE mRNA), while XPR1 (short) refers to the 631 amino acid product of NM_001135669. All constructs have C-terminal V5 tags for immunoprecipitation, western blotting, and immunofluorescent detection. g) XPR1 or Luciferase (Luc) were overexpressed in 293T cells and immunoprecipitated using the V5 tag and analyzed by targeted immunoblot or for total protein. Proteins were extracted from this gel and identified using mass spectrometry, the results of which are shown in Figure 6c. N=1 replicate of N=2 independent transfections. h) Cas9 + sgRNA targeting XPR1 or KIDINS220 were transfected into 293T cells, and clones were isolated that lacked expression of the target proteins. For XPR1 inactivated cells, the XPR1 ORF was re-expressed, and the relative levels of the indicated proteins were detected by immunoblot. At least N=2 clonal populations were profiled for each inactivation condition. i) Five days after infection with the indicated sgRNA targeting XPR1 or KIDINS220, free inorganic intracellular phosphate was determined as in Figure 4d. N=3 technical replicates of N=3 independent transductions.
Figure 1 -
Figure 1 -. Functional genomics identifies XPR1 loss as a cancer vulnerability in SLC34A2high ovarian and uterine cancers
a) For the >18,000 genes tested in CRISPR/Cas9 loss of viability screens, the selectivity of the killing profile across all 851 cell lines (X-axis, likelihood ratio test, see methods) and the enrichment of that gene’s dependency (Chronos score) in ovarian and uterine cancers (Y-Axis) is plotted. The top 5% most predictable dependencies are highlighted in teal, where a random forest model using the genomic and molecular features of cancer cell lines can predict the strength of dependency. b) Heatmap indicating XPR1 and SLC34A2 expression (Log2(TPM+1)) and dependency (CERES) values across all cell lines, approximately ranked by decreasing dependency on XPR1. The pearson correlation coefficient across all 851 cell lines is indicated. c) Across a panel of ovarian and uterine cancer cell lines, viability effects after inactivation of XPR1 were evaluated by comparison to negative control sgRNA and sgRNA targeting pane-essential genes (N=3 independent transductions representative of at least N=2 independent experiments). Note that A2780 is not considered ovarian cancer despite its historical annotation. The data is scaled such that a value of 0 represents the viability effect of CRISPR/Cas9 genome editing and −1 represents loss of an essential gene. “High SLC34A2 expression” indicates mRNA expression greater than 3 TPM. d) Viability assessment seven days after suppression of XPR1 using the indicated shRNA or seed-matched controls (N=5 technical replicates representative of at least N=3 independent experiments per cell line). e) Six days after induction of shXPR1 in the indicated cell lines, cells were stained with DAPI to distinguish live and dead cells and Annexin V to distinguish non- and pre-apoptotic cells (N=1 flow cytometric analyses of at least 10,000 cells, representative of N=2 independent experiments). Right, quantitation of the percentage of cells in the indicated quadrants. f) Analysis of cell death pathways in OVISE and IGROV1 five days after suppression of XPR1 by shRNA using protein arrays (N=1). Note that OVISE has wildtype (WT) TP53, while IGROV1 has an inactivating mutation in TP53.
Figure 2 -
Figure 2 -. XPR1 inactivation prevents tumor formation in vivo.
a) Experimental design for in vivo competition assays. Using a rapid infection and selection protocol, pooled sgRNA can be introduced via lentivirus into cancer cell lines and inoculated as subcutaneous xenografts and the effect of gene inactivation can be evaluated in a more physiologically-relevant environment than tissue culture. b) After rapid infection with pooled sgRNA, 8 million SNGM or OVISE cells were inoculated as subcutaneous xenografts and allowed to grow. Tumor tissue was harvested at the indicated time points. c) Evaluation of sgRNA targeting XPR1 and other cancer vulnerabilities in a tumor formation competition assay, as described in a for the OVISE (squares) and SNGM (circles) cancer cell lines (N=2–3 independent tumors derived from the same transduction per cell line per timepoint.). GPX4: glutathione peroxidase 4, a metabolic dependency reliant on the amount of peroxidated lipids in the metabolic environment of the cancer cells. PAX8: paired box 8 is a transcription factor dependency in many ovarian cancer cell lines. POLR2D: RNA Polymerase II Subunit D is a pan-essential gene and is used as a positive control. Below, the significance of depletion of three sgRNA targeting XPR1 relative to 7 control sgRNA was calculated via t-test and corrected for multiple comparisons with the Holm-Sidak method.
Figure 3 -
Figure 3 -. XPR1 and SLC34A2 expression in patient samples indicate cancer-specific phosphate dysregulation caused by the lineage survival transcription factor PAX8
a) SLC34A2 is expressed in ovarian and uterine tumor samples at sufficient levels to predict dependency on XPR1. RNA expression values for SLC34A2 were compared within the idicated lineages. XPR1 dependency status is indicated by color where applicable (CERES < −0.5). q-values indicate the likelihood of the indicated populations having the same SLC34A2 expression according to a two-sided Wilcoxon ranked sums test with Bonferroni correction for multiple comparisons. Boxplots are drawn indicating the first and third quartiles, and whiskers span to the largest value within 1.5x the interquartile range. See methods for exact N values. b) The expression of SLC34A2 was measured using RNAseq (N=1) after stable overexpression of PAX8 as indicated (PAX8 O/E), and induction of a PAX8-targeting (sg4) or control (sg9) sgRNA and dCas9-KRAB. c) Seven days after transduction with the indicated sgRNA (N=2, separate transductions), RNA was extracted, converted to cDNA, and the expression of SLC34A2 was measured using RT-PCR. Significance was assessed by comparing the expression relative to sgChr2-2 across two cell lines with a one-tailed t-test, and corrected for multiple comparisons using the Bonferroni method. Data are representative of N=2 independent experiments. d) XPR1 copy number heatmap for a ~2.5 Mb region of chromosome 1 indicating XPR1 amplification in TCGA serous ovarian cancer. Each patient sample is represented by a horizontal line. Red indicates copy gain and blue indicates copy loss. Dashed vertical lines are the location of indicated genes. Data are a subset of the 489 samples, rank ordered by highest copy gain to indicate both focal and chromosome arm variants. e) XPR1 mRNA expression is increased in ovarian and uterine cancer. XPR1 mRNA expression values from the same sources as panel a are compared for the indicated tissues, with TCGA OV and TCGA UCEC color-coded by XPR1 copy number status as determined by GISTIC analysis. Boxplots are drawn as in a. Statistical differences between tissues were determined as in a. The correlation of XPR1 copy number and expression was performed using spearman’s ranked correlation test. See methods for exact N values.
Figure 4 -
Figure 4 -. XPR1 inactivation in SLC34A2-high ovarian cancer causes loss of cell viability via dysregulated intracellular phosphate homeostasis
a) Identification of rescue genes that protect OVISE ovarian cancer cells from XPR1 dependency. Beta scores (determined by MaGeCK MLE) represent the change in representation for each gene from the initial library to the final timepoint for the control condition (X-axis) or combined with XPR1 inactivation (Y-axis). See methods for full experimental and analytical details. N=1 transduction per cell line, expanded and cultured as N=2 independent cultures. b) The SLC34A2 status of normally XPR1-resistant (ES2, SLC34A2-low [lo]) or XPR1-sensitive (EMTOKA and OVISE, SLC34A2-high [hi]) cell lines was modified by overexpression (O/E) or inactivation (KO) of SLC34A2, and the XPR1 dependency was evaluated as in Figure 1c (N=3 separate transductions, representative of at least N=2 independent experiments per cell line). c) Because of their relative directionalities of phosphate transport, we hypothesize that XPR1 perturbation is toxic because of intracellular phosphate accumulation in SLC34A2-high ovarian and uterine cancers. d) At various time-points after treatment with doxycycline and induction of shRNA, the intracellular phosphate was measured in OVISE and IGROV1 cell lines (N=3 separate measurements per condition, representative of at least N=3 separate experiments). e) A pool of 8 cancer cell lines were transduced with lentivirus to inactivate XPR1, and 4 days later the cells were subjected to 10X single cell transcriptomic measurement (N=1 transduction). The measured transcriptional change (relative to control sgRNA infection) in the indicated genes are plotted for the three cell lines with the largest and most correlated transcriptional change (see Extended Data Figure 7) on the left and the other five cell lines on the right. Blue lines connect cell lines displaying decreased expression upon XPR1 inactivation, red lines indicate increased expression. f) XPR1 perturbation causes compensatory inhibition of phosphate uptake, measured by incubating OVISE ovarian cancer cells with medium supplemented with 32PO43- phosphate for 30 minutes prior to washing away excess medium and lysing the cells (N=1 transduction measured in technical duplicate, representative of N=2 independent experiments). Significance was assessed by one-way ANOVA and corrected for multiple comparisons using Bonferroni’s method.
Figure 5 -
Figure 5 -. Phosphate efflux activity by XPR1 is required for SLC34A2high cancer cell survival
a) The indicated XPR1 open reading frames were tested for their ability to rescue inactivation of endogenous XPR1 (N=3 independent transductions, representative of N=2 independent experiments). The L218S mutation in XPR1 has previously been shown to only have ~50% the phosphate efflux function of wild-type XPR1 (see main text). b) Purified XRBD (the soluble receptor binding domain of the NZB strain of xenotropic and polytropic murine leukemia virus) was incubated with 293T cells or 293T with XPR1 inactivation for 30 minutes at the indicated concentrations, washed, and stained with AlexaFluor488-conjugated anti-mouse secondary to detect the Fc tag on XRBD (N=2 flow cytometric analysis of at least 10,000 cells, representative of N=2 independent experiments). c) Phosphate efflux was measured in the presence of XRBD or XPR1 suppression in IGROV1 mixed lineage ovarian cancer cell lines. IGROV1 were treated with doxycline (where indicated) to induce expression of shXPR1_2 three days prior to evaluating phosphate efflux by loading cells with 32P-labeled phosphate, washing the cells to remove excess 32P, and measuring the percent of total 32P in the conditioned medium after 30 minutes (N=2 technical replicates representative of N=3 independent experiments). Where indicated, XRBD was added to the cells during both the 32P loading and efflux portions of the experiment. Note that medium without phosphate does not stimulate phosphate efflux, and was used as a control. d) Treatment of various cancer cell lines with the XPR1 inhibitor XRBD (the soluble receptor binding domain of the NZB strain of xenotropic and polytropic murine leukemia virus). Left, cells were incubated for 5 days with the indicated concentrations of XRBD and viability was assessed by Cell Titer Glo (N=2 independent treatments, representative of at least N=2 experiments per cell line.). Right, heatmap comparison of the viability defect after XPR1 inactivation (XPR1 KO) or XRBD treatment (5 μM dose), with pearson correlation coefficient indicated.
Figure 6 -
Figure 6 -. KIDINS220 is a critical component of the phosphate efflux protein complex.
a) Across 851 cancer cell lines, the viability defects of XPR1 and KIDINS220 inactivation in each cell line is plotted and the Pearson correlation is indicated. A chronos value of −1 is the median viability defect of inactivating pan-essential genes in a given cell line. b) The interaction between the V5-tagged XPR1 mutant and KIDINS220 was evaluated using co-immunoprecipitation. XPR1 WT corresponds to isoform NM_004736, while XPR1 (Short) corresponds to isoform NM_001135669. Green arrows indicate the expected molecular weight. N=1 experiment representative of N=3 independent transfections. c) After XPR1-V5 immunoprecipitation, interacting proteins were identified using in-gel tryptic digestion followed by mass spectrometry. The X and Y axes show the total number of peptides per protein detected specifically in the XPR1 immunoprecipitation for N=2 independent transfection and immunoprecipitations. Higher abundance proteins (>10 peptides detected in IP:XPR1) are highlighted in teal. d) Glycerol gradient sedimentation analysis of XPR1-containing native protein complexes with or without KIDINS220 inactivation. The crude lysate of the indicated cell lines was layered onto 10–30% glycerol gradients and centrifuged to fractionate protein complexes by molecular weight, followed by immunoblot analysis (N=1 centrifugation representative of N=3 independent experiments). The elution profile of protein standards is indicated below the immunoblot. e) Localization of XPR1-V5 proteins after inactivation of KIDINS220. Scale bar = 100 μm. N=1 technical replicate of N=2 independent experiments. f) Evaluation of XPR1 cell-surface localization after KIDINS220 inactivation. N=1 flow cytometric analysis of 10,000 cells, representative of N=4 independent experiments. g) Cellular phosphate efflux after KIDINS220 inactivation. Three days after genetic inactivation of XPR1 or KIDINS220, cellular phosphate efflux was assessed. Cells were loaded with 32P-labeled phosphate, washed extensively to remove excess 32P, and then phosphate efflux was measured at the indicated times by isolating conditioned medium and cellular lysates (N=3 technical replicates of the same transduction, representative of N=3 independent transductions). Phosphate efflux is calculated as the percentage of 32P in the conditioned medium relative to the total 32P measured for that sample. Note that medium without phosphate does not stimulate phosphate efflux, and was used as a control.
Figure 7 -
Figure 7 -. Vacuole structures precede loss of cell viability and are not derived from many common organelles
a) Phase-contrast images of ‘vacuole-like’ phenotype 4–5 days after XPR1 inactivation. Arrowheads indicate the location of ‘vacuole-like’ structures. Scale bars = 200 μm. Data are representative of N=2 independent transductions. b) 6 days after infection with lentivirus encoding sgXPR1_2, OVISE and SNGM cell lines were stained and imaged using the indicated dyes and stains. Arrowheads indicate the location of vacuole structures by phase contrast (not pictured). Positive staining was only observed for the lysosomal dye LAMP1. Scale bars = 100 μm. Data are representative of N=2 independent transductions. c) The acidic dye Lysotracker was used to stain live cells five days after inactivation of XPR1. Scale bars = 100 μm. Data are representative of N=2 independent transductions. d) Transmission electron micrographs of “vacuole-like” structures (labeled V) or lysosomes (Lys) in OVISE cancer cells after XPR1 inactivation. N=1 experiment. e) Same as d, but with KIDINS220 inactivation. N=1 experiment.

References

    1. Lord CJ & Ashworth A PARP inhibitors: Synthetic lethality in the clinic. Science 355, 1152–1158 (2017). - PMC - PubMed
    1. Lheureux S, Braunstein M & Oza AM Epithelial ovarian cancer: Evolution of management in the era of precision medicine. CA Cancer J. Clin 69, 280–304 (2019). - PubMed
    1. Vaughan S et al. Rethinking ovarian cancer: recommendations for improving outcomes. Nat. Rev. Cancer 11, 719–725 (2011). - PMC - PubMed
    1. Sung H et al. Global Cancer Statistics 2020: GLOBOCAN Estimates of Incidence and Mortality Worldwide for 36 Cancers in 185 Countries. CA Cancer J. Clin 71, 209–249 (2021). - PubMed
    1. Boehm JS et al. Cancer research needs a better map. Nature 589, 514–516 (2021). - PubMed

Publication types

MeSH terms