. 2022 May;23(5):757-767.
doi: 10.1038/s41590-022-01176-4. Epub 2022 Apr 18.

LAG3 associates with TCR-CD3 complexes and suppresses signaling by driving co-receptor-Lck dissociation

Affiliations

LAG3 associates with TCR-CD3 complexes and suppresses signaling by driving co-receptor-Lck dissociation

Clifford Guy et al. Nat Immunol. 2022 May.

Abstract

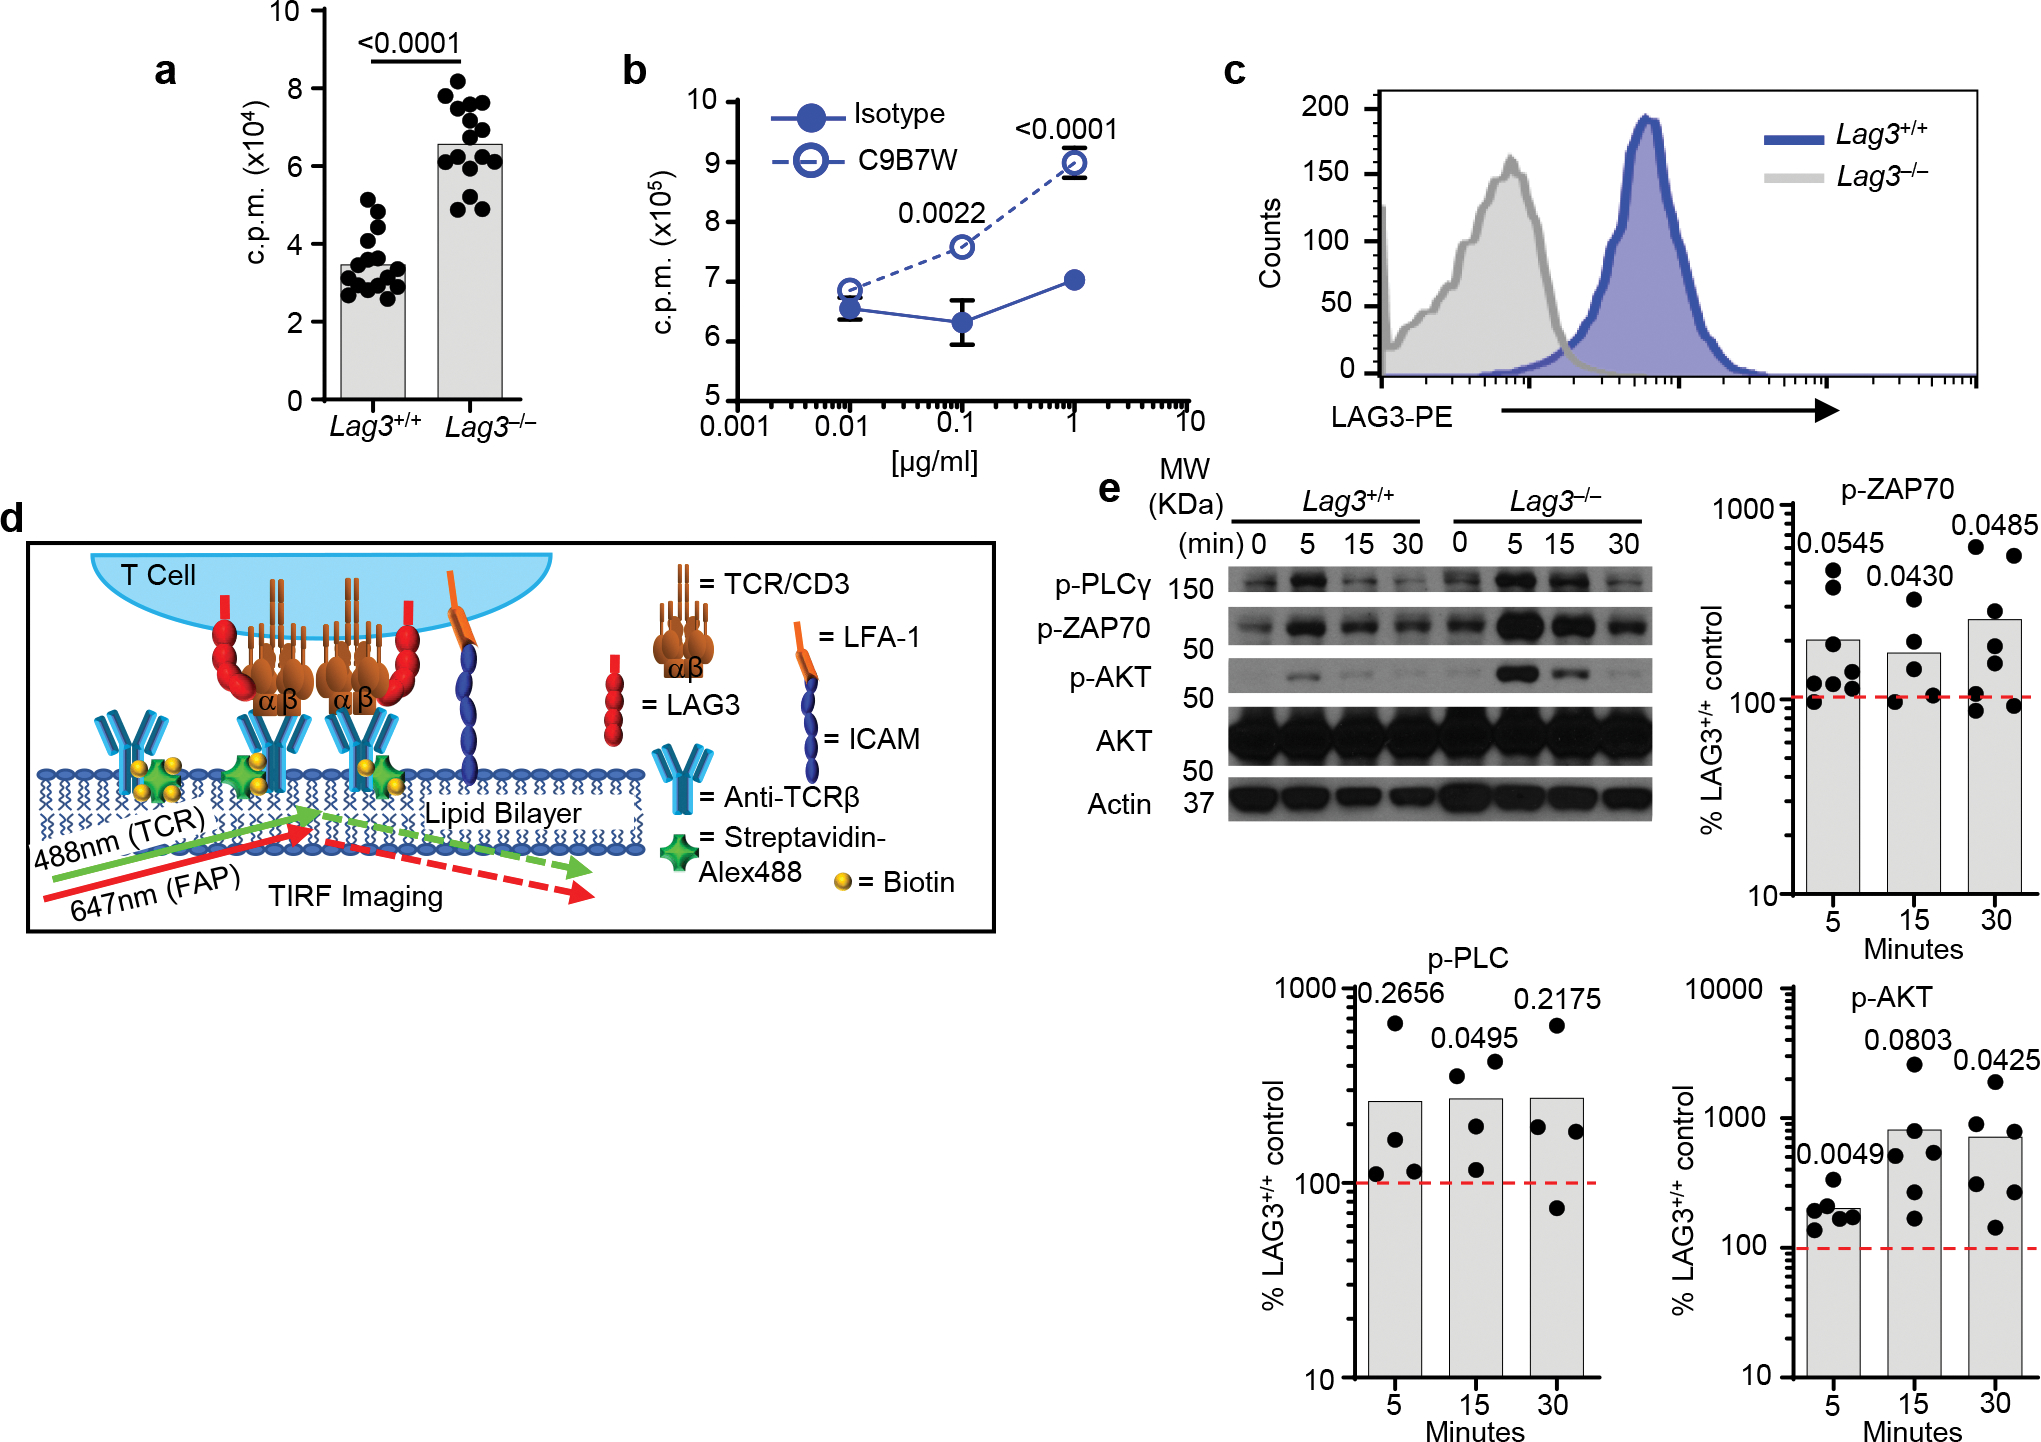
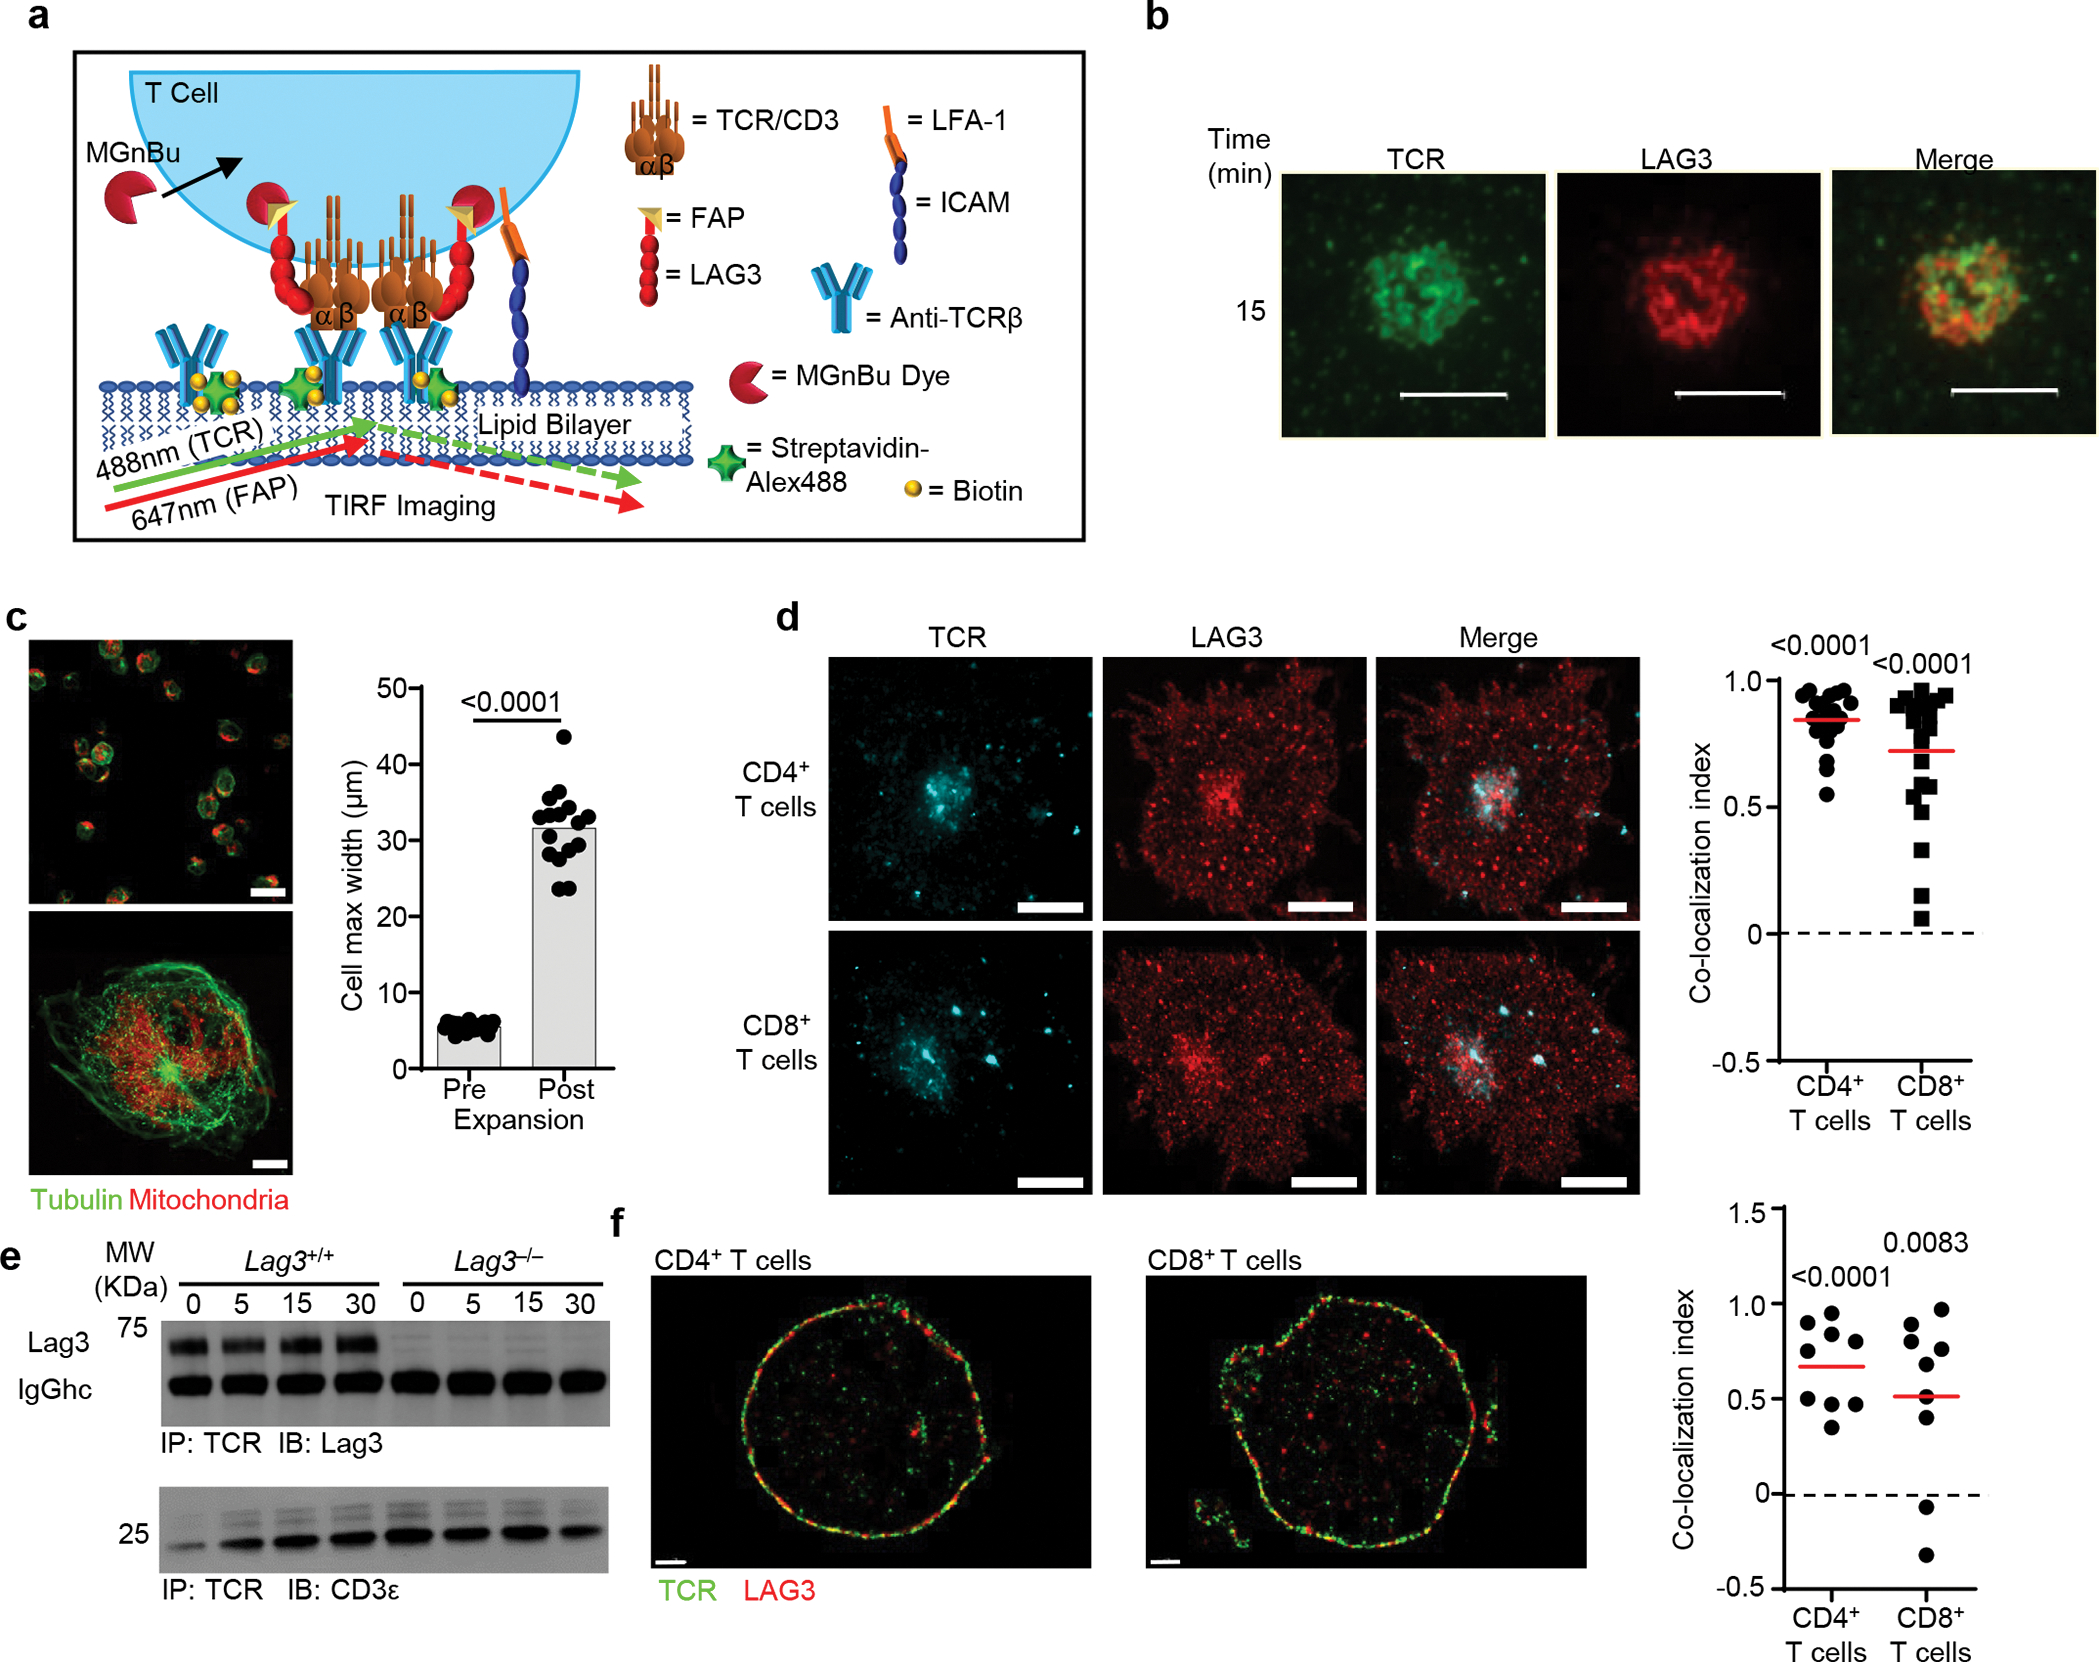
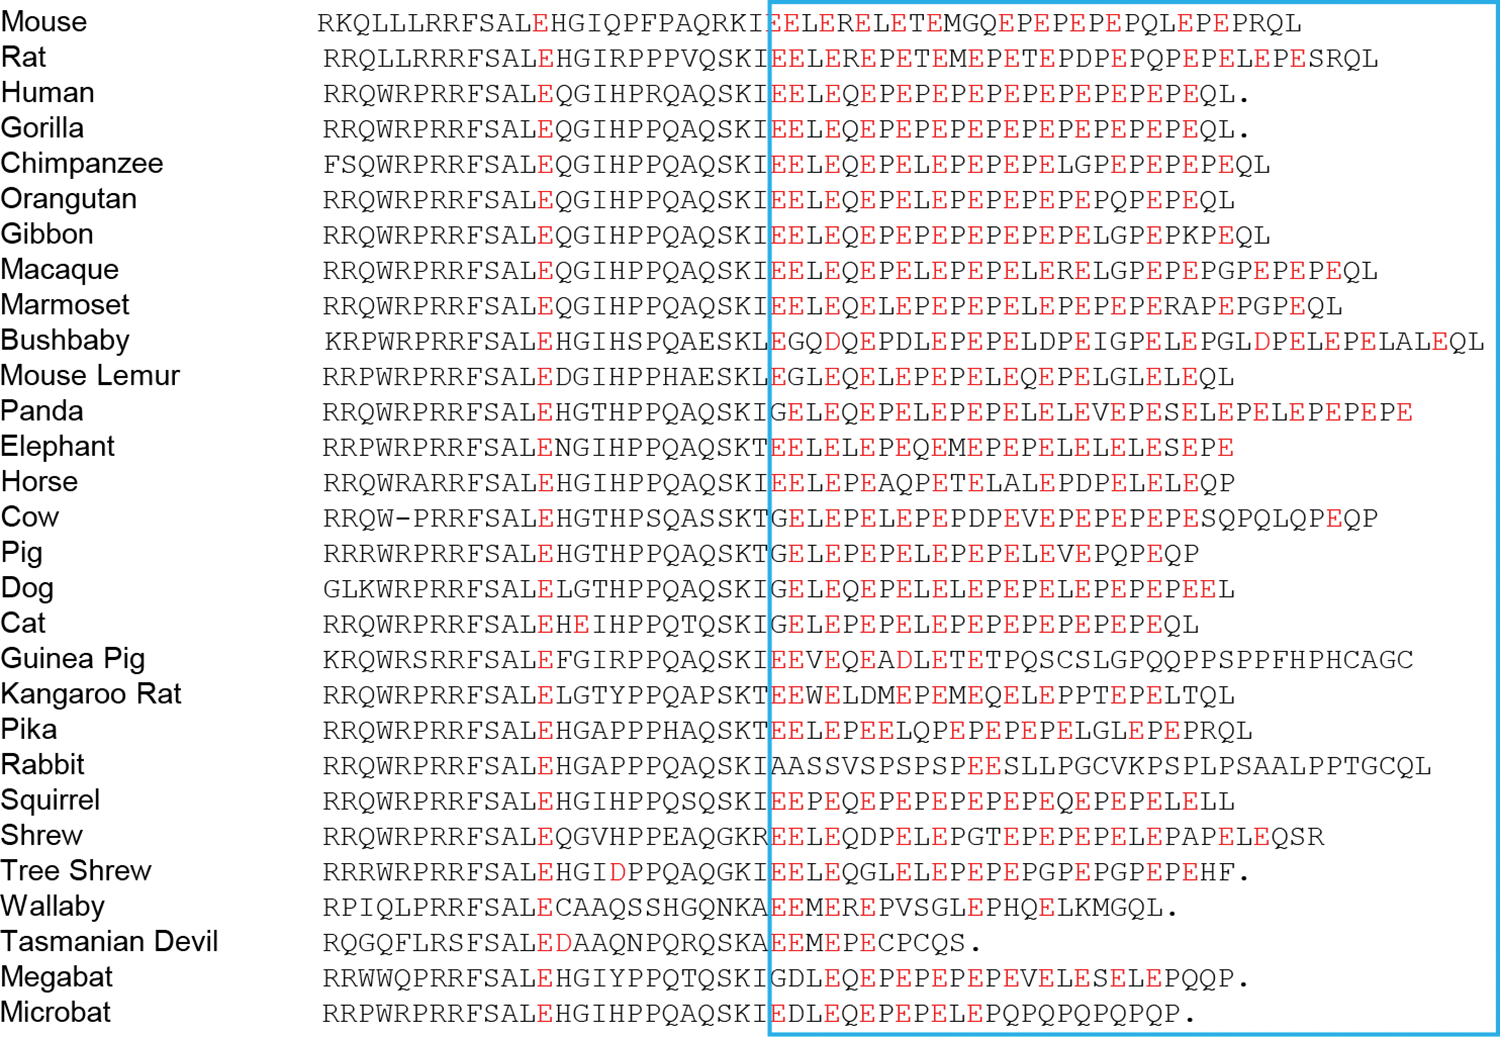
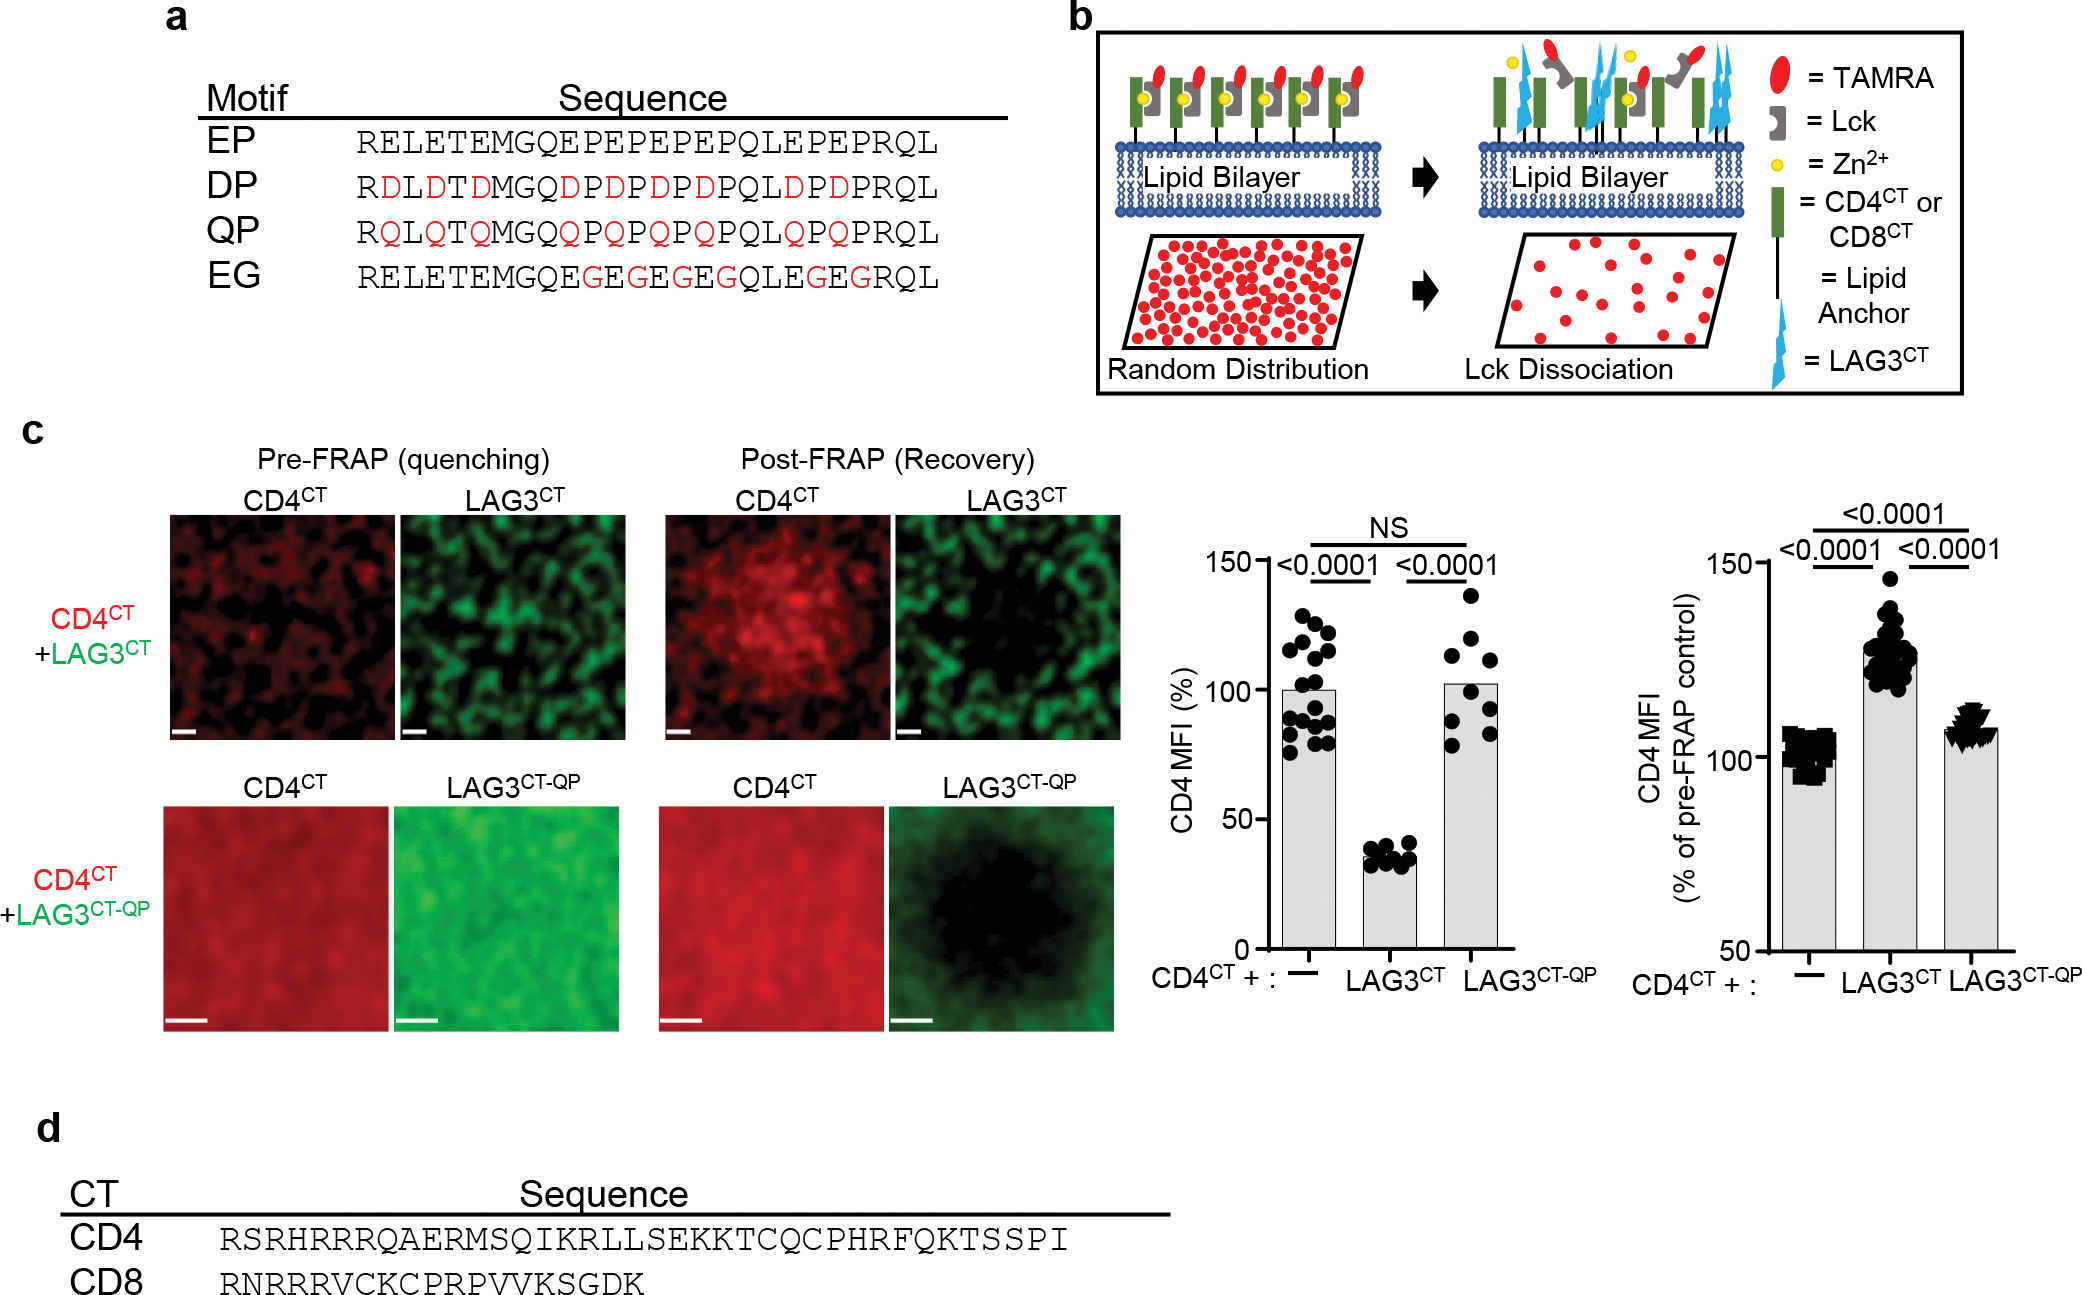
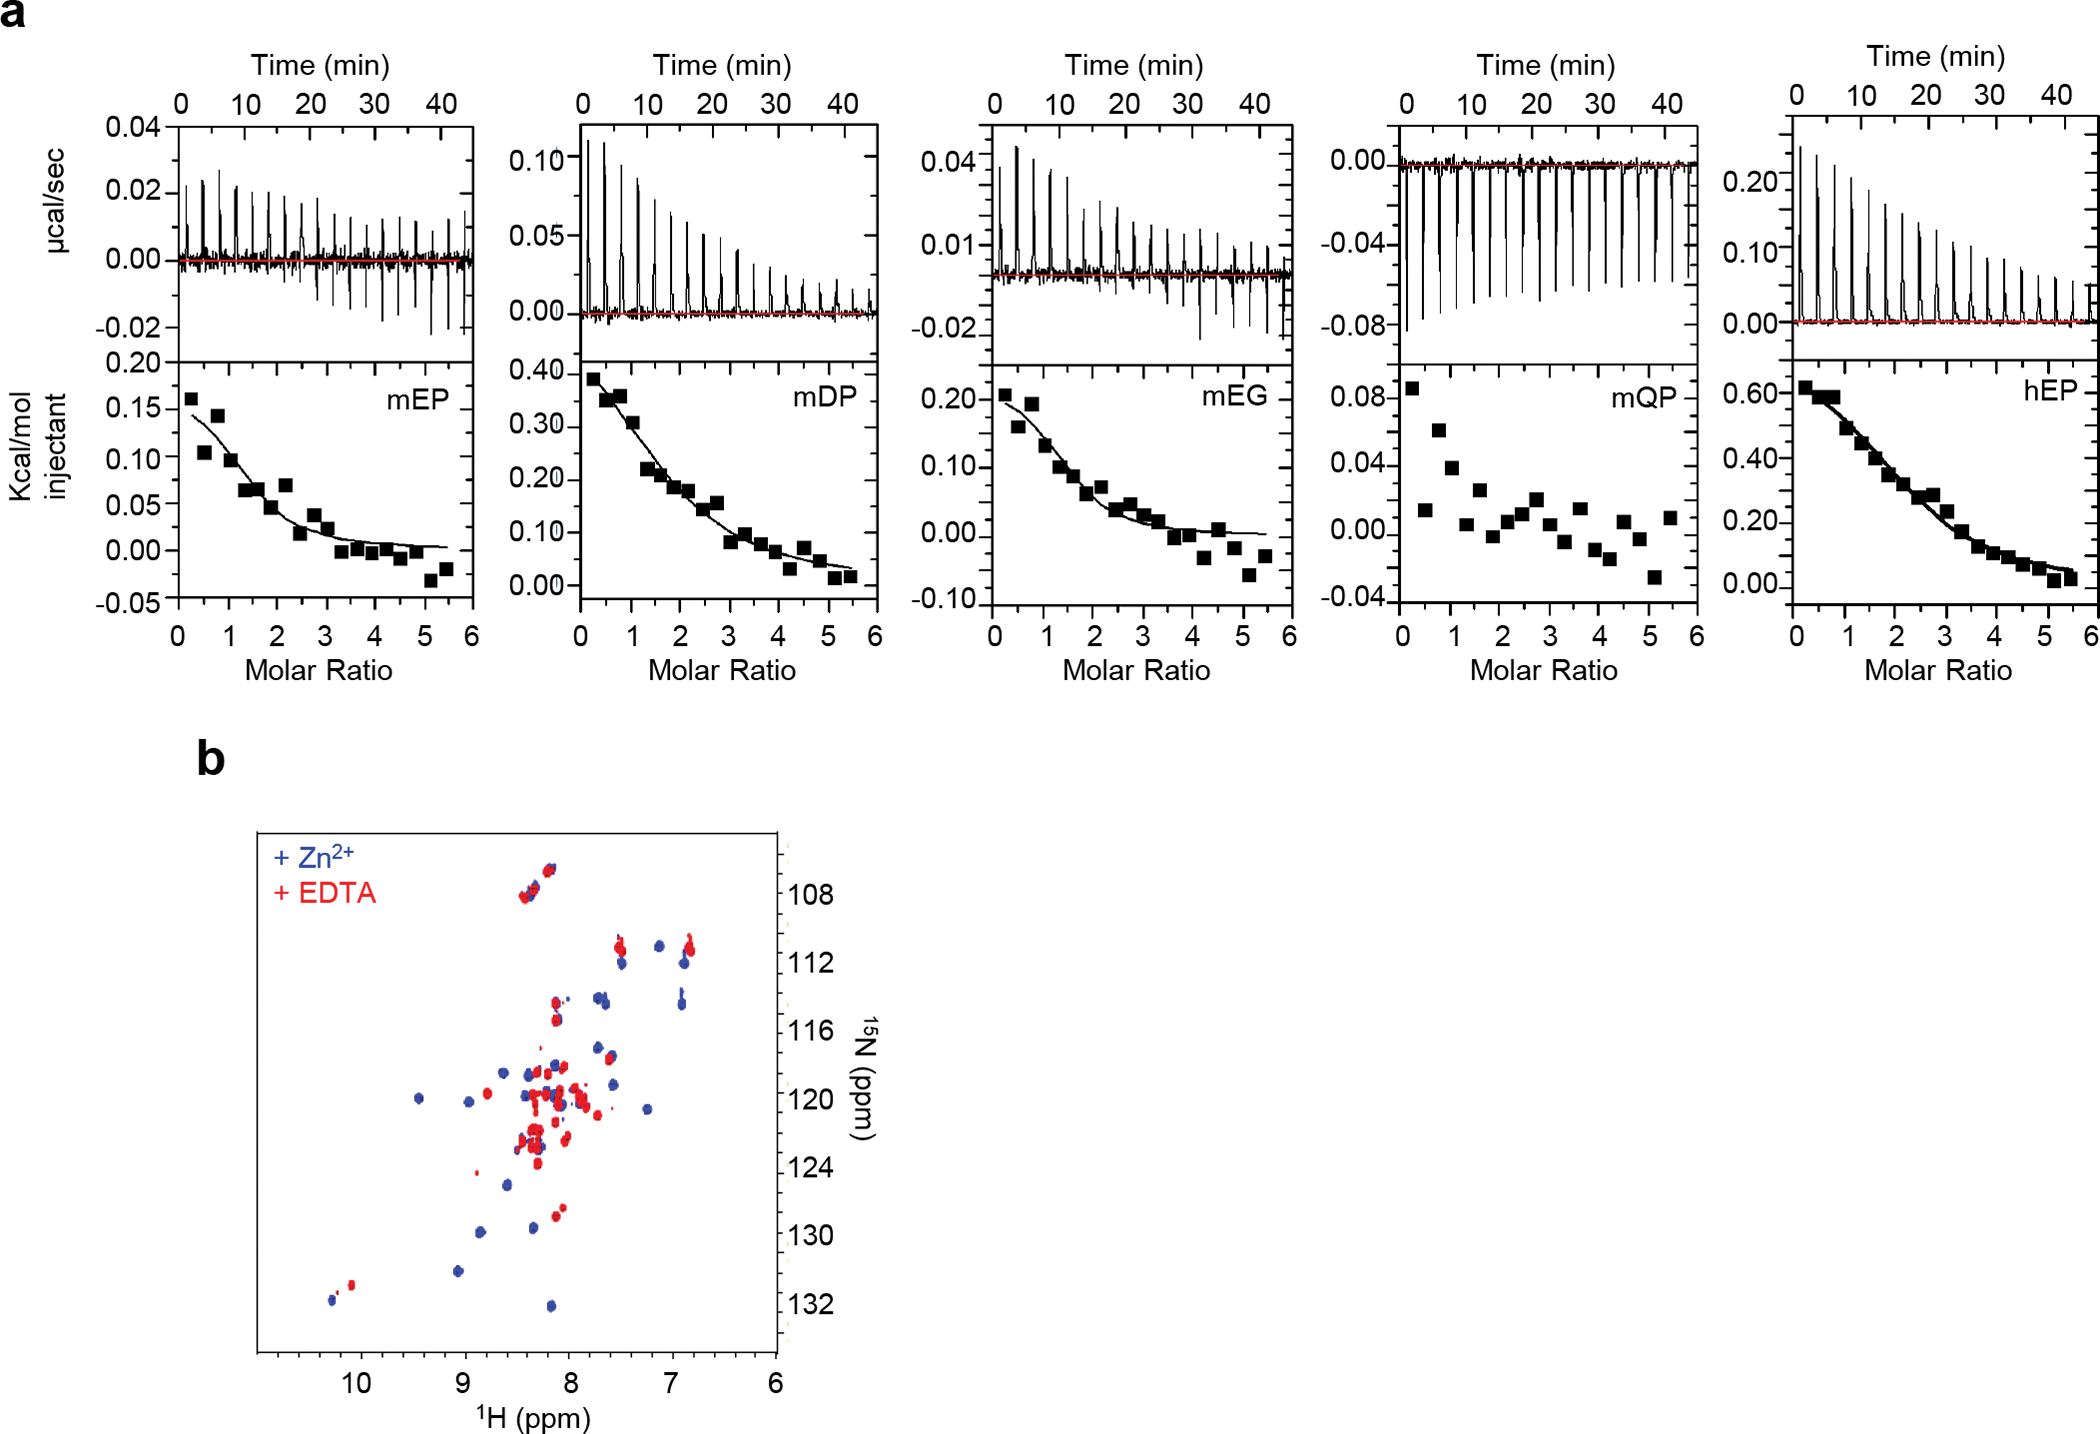
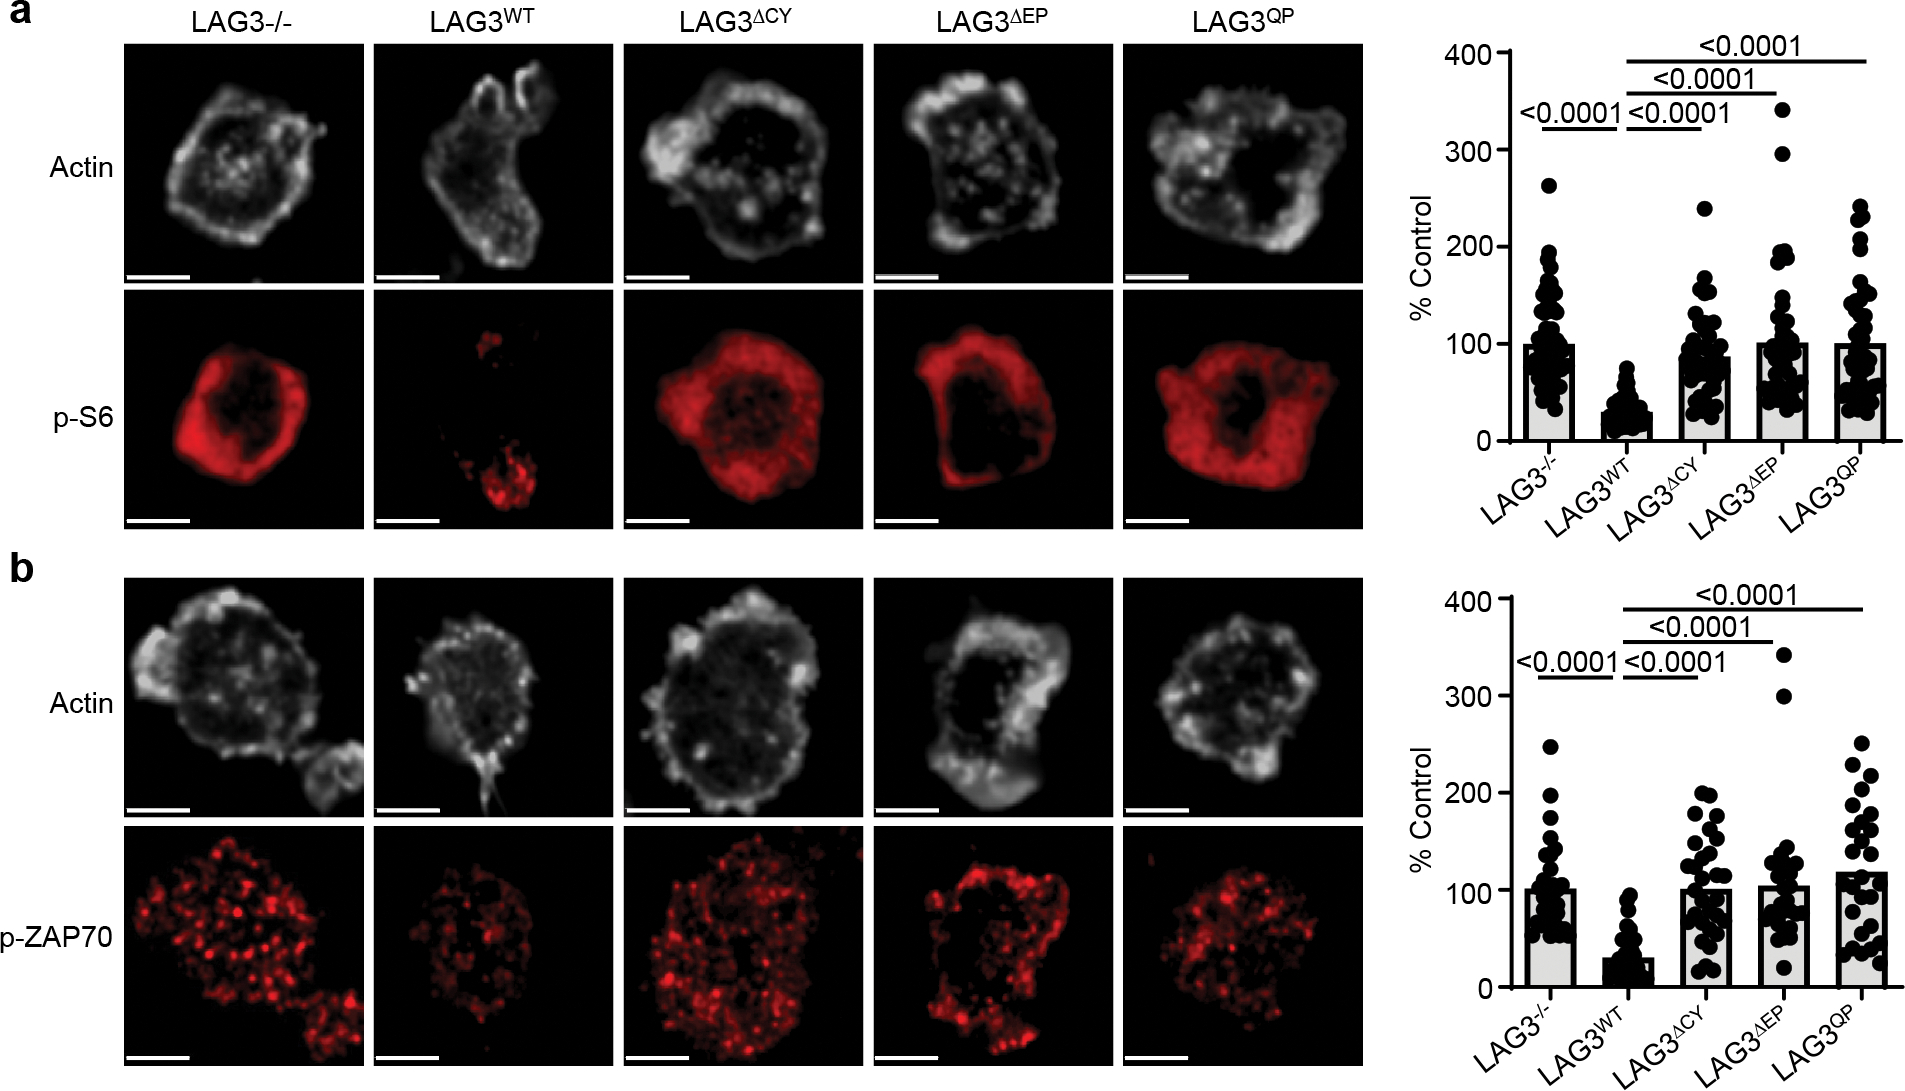
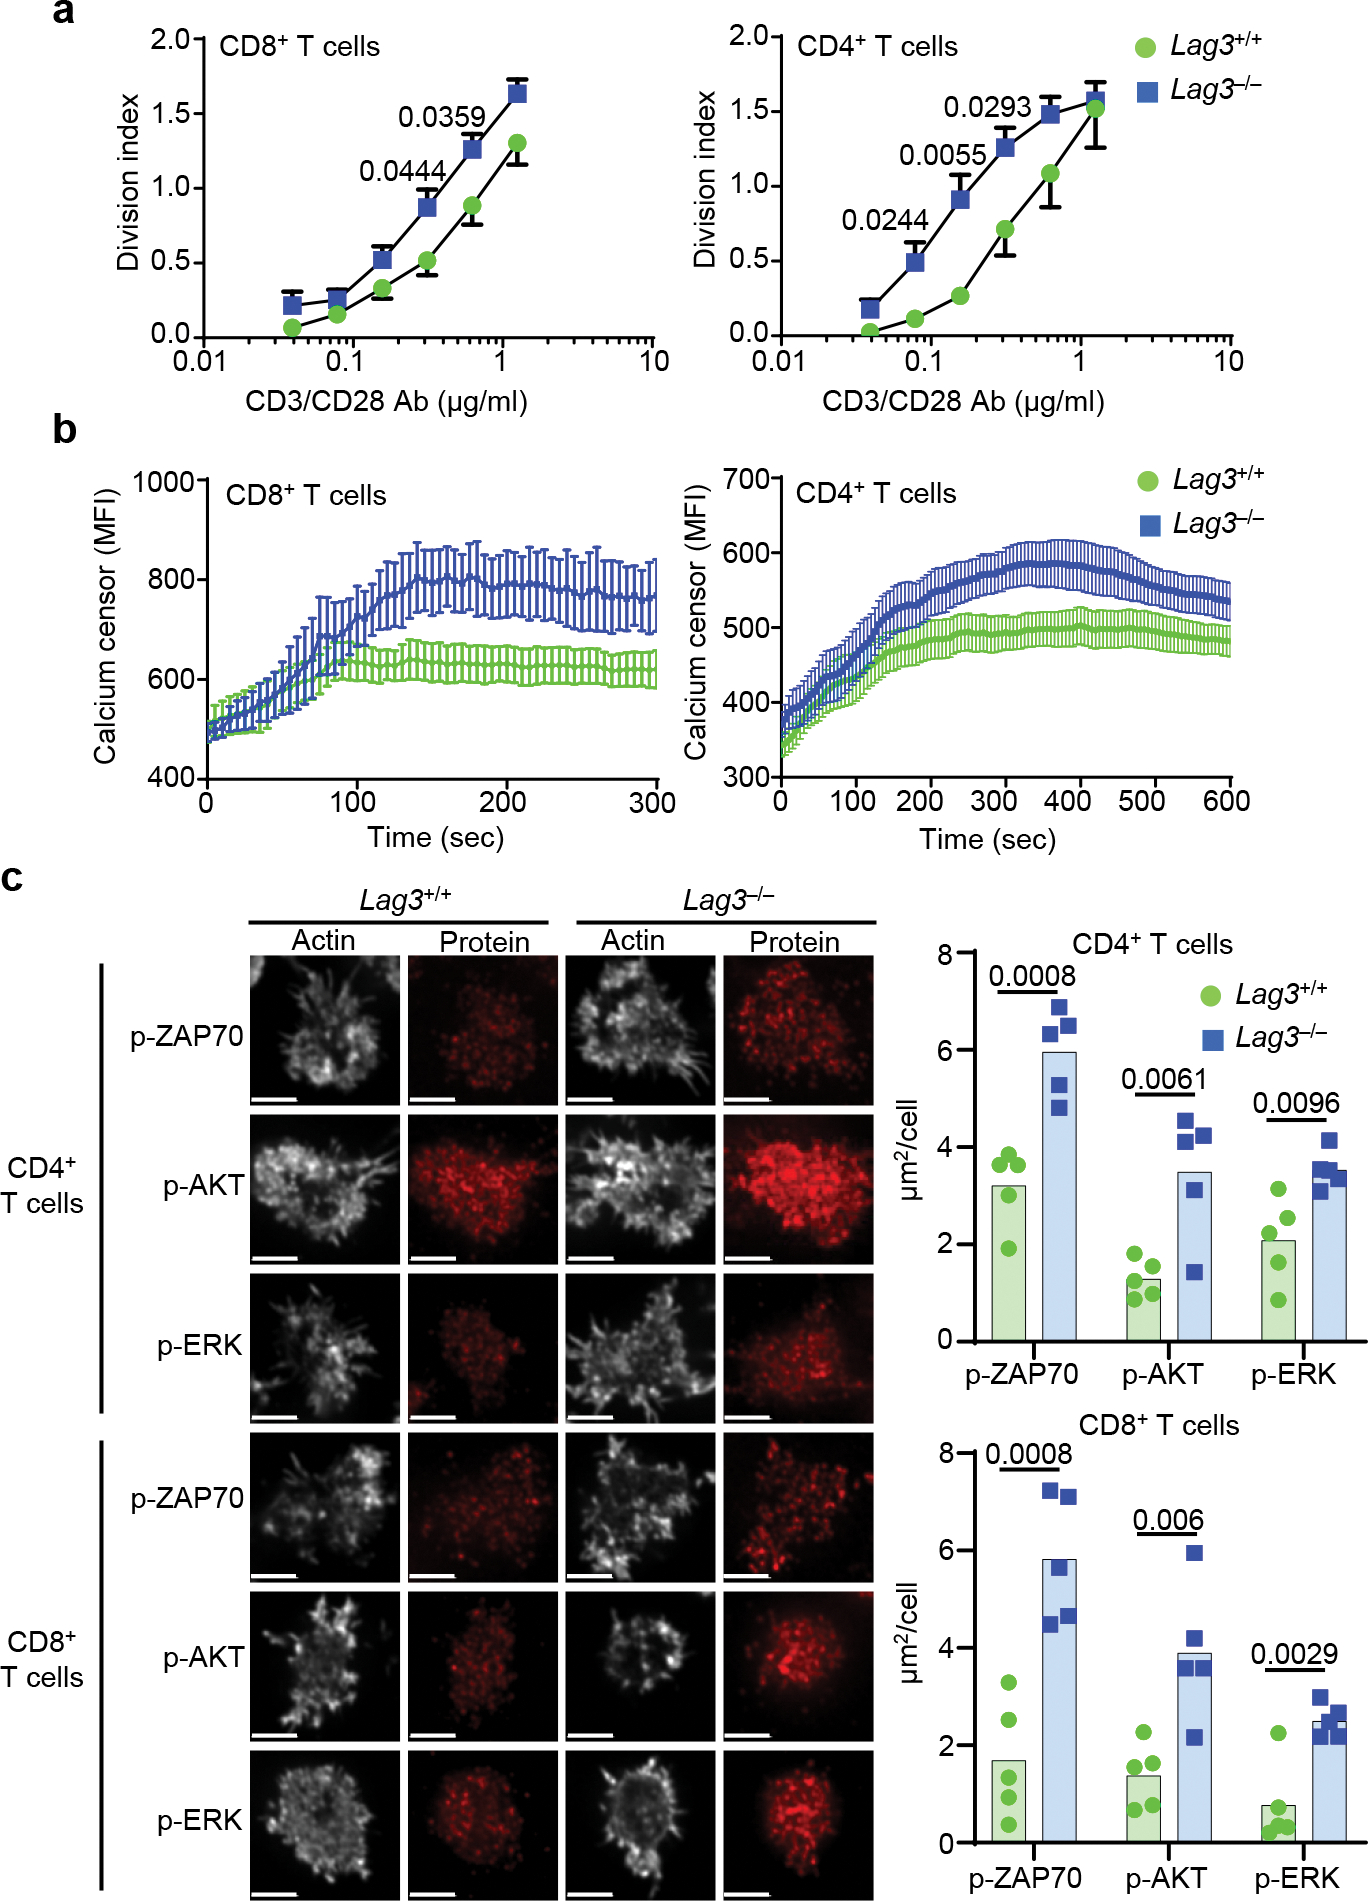
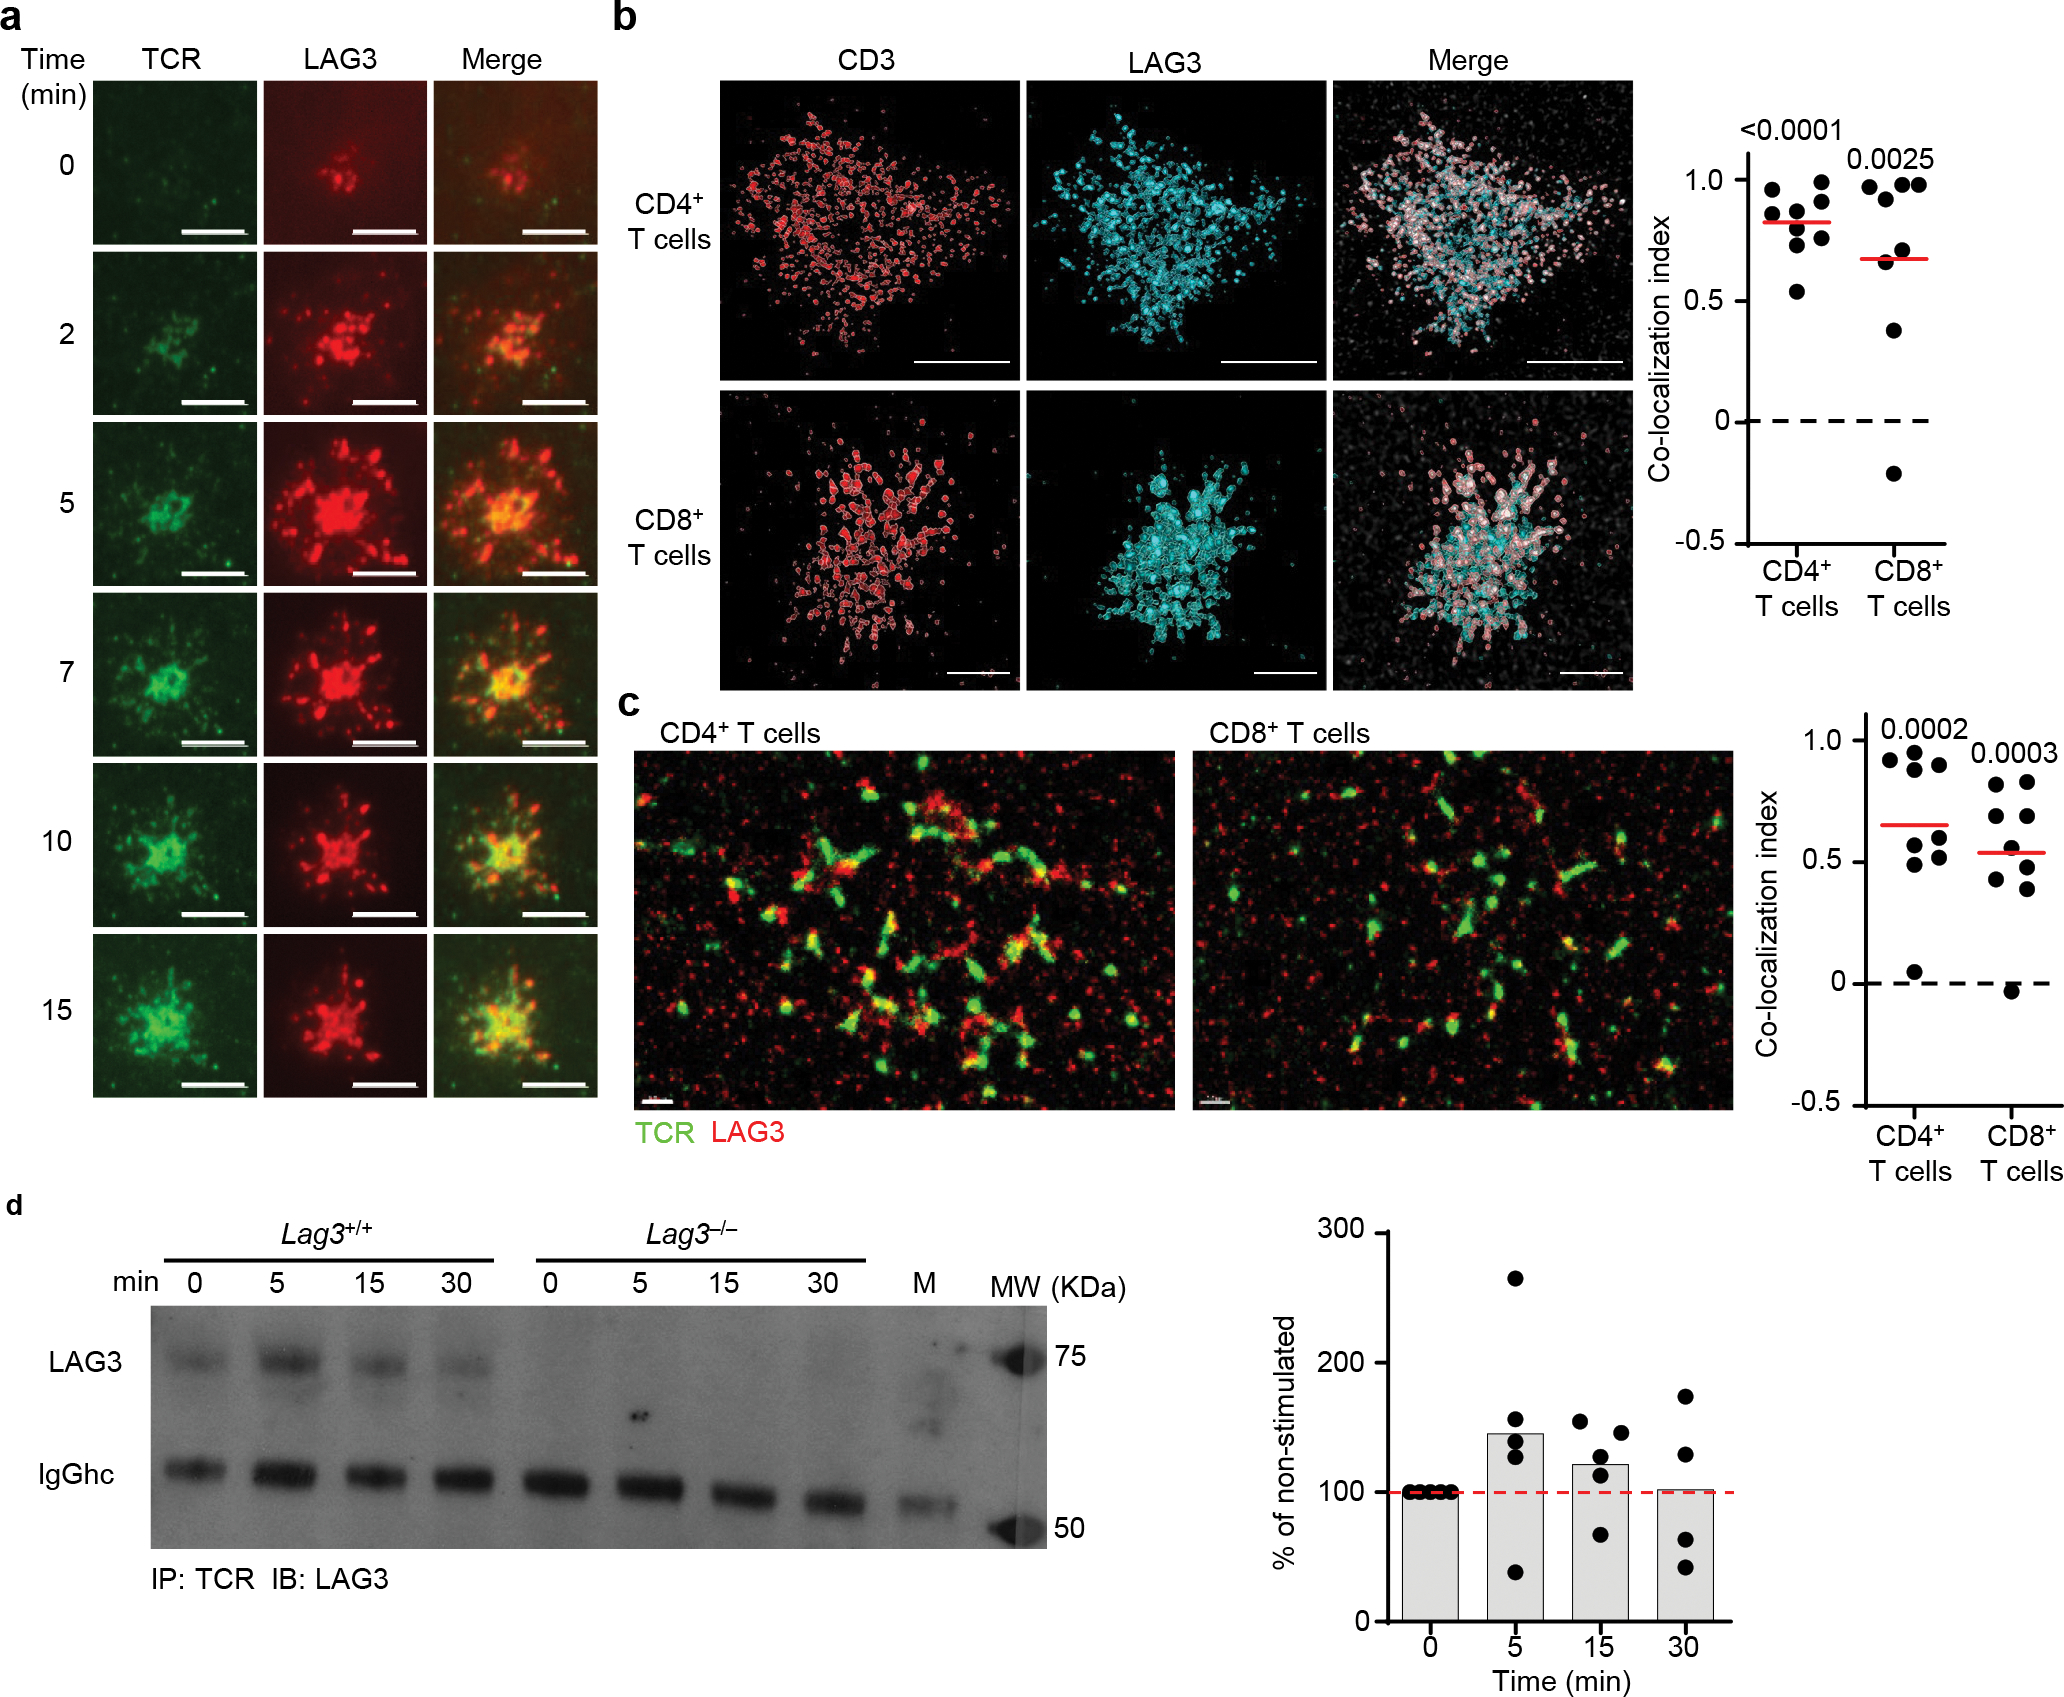
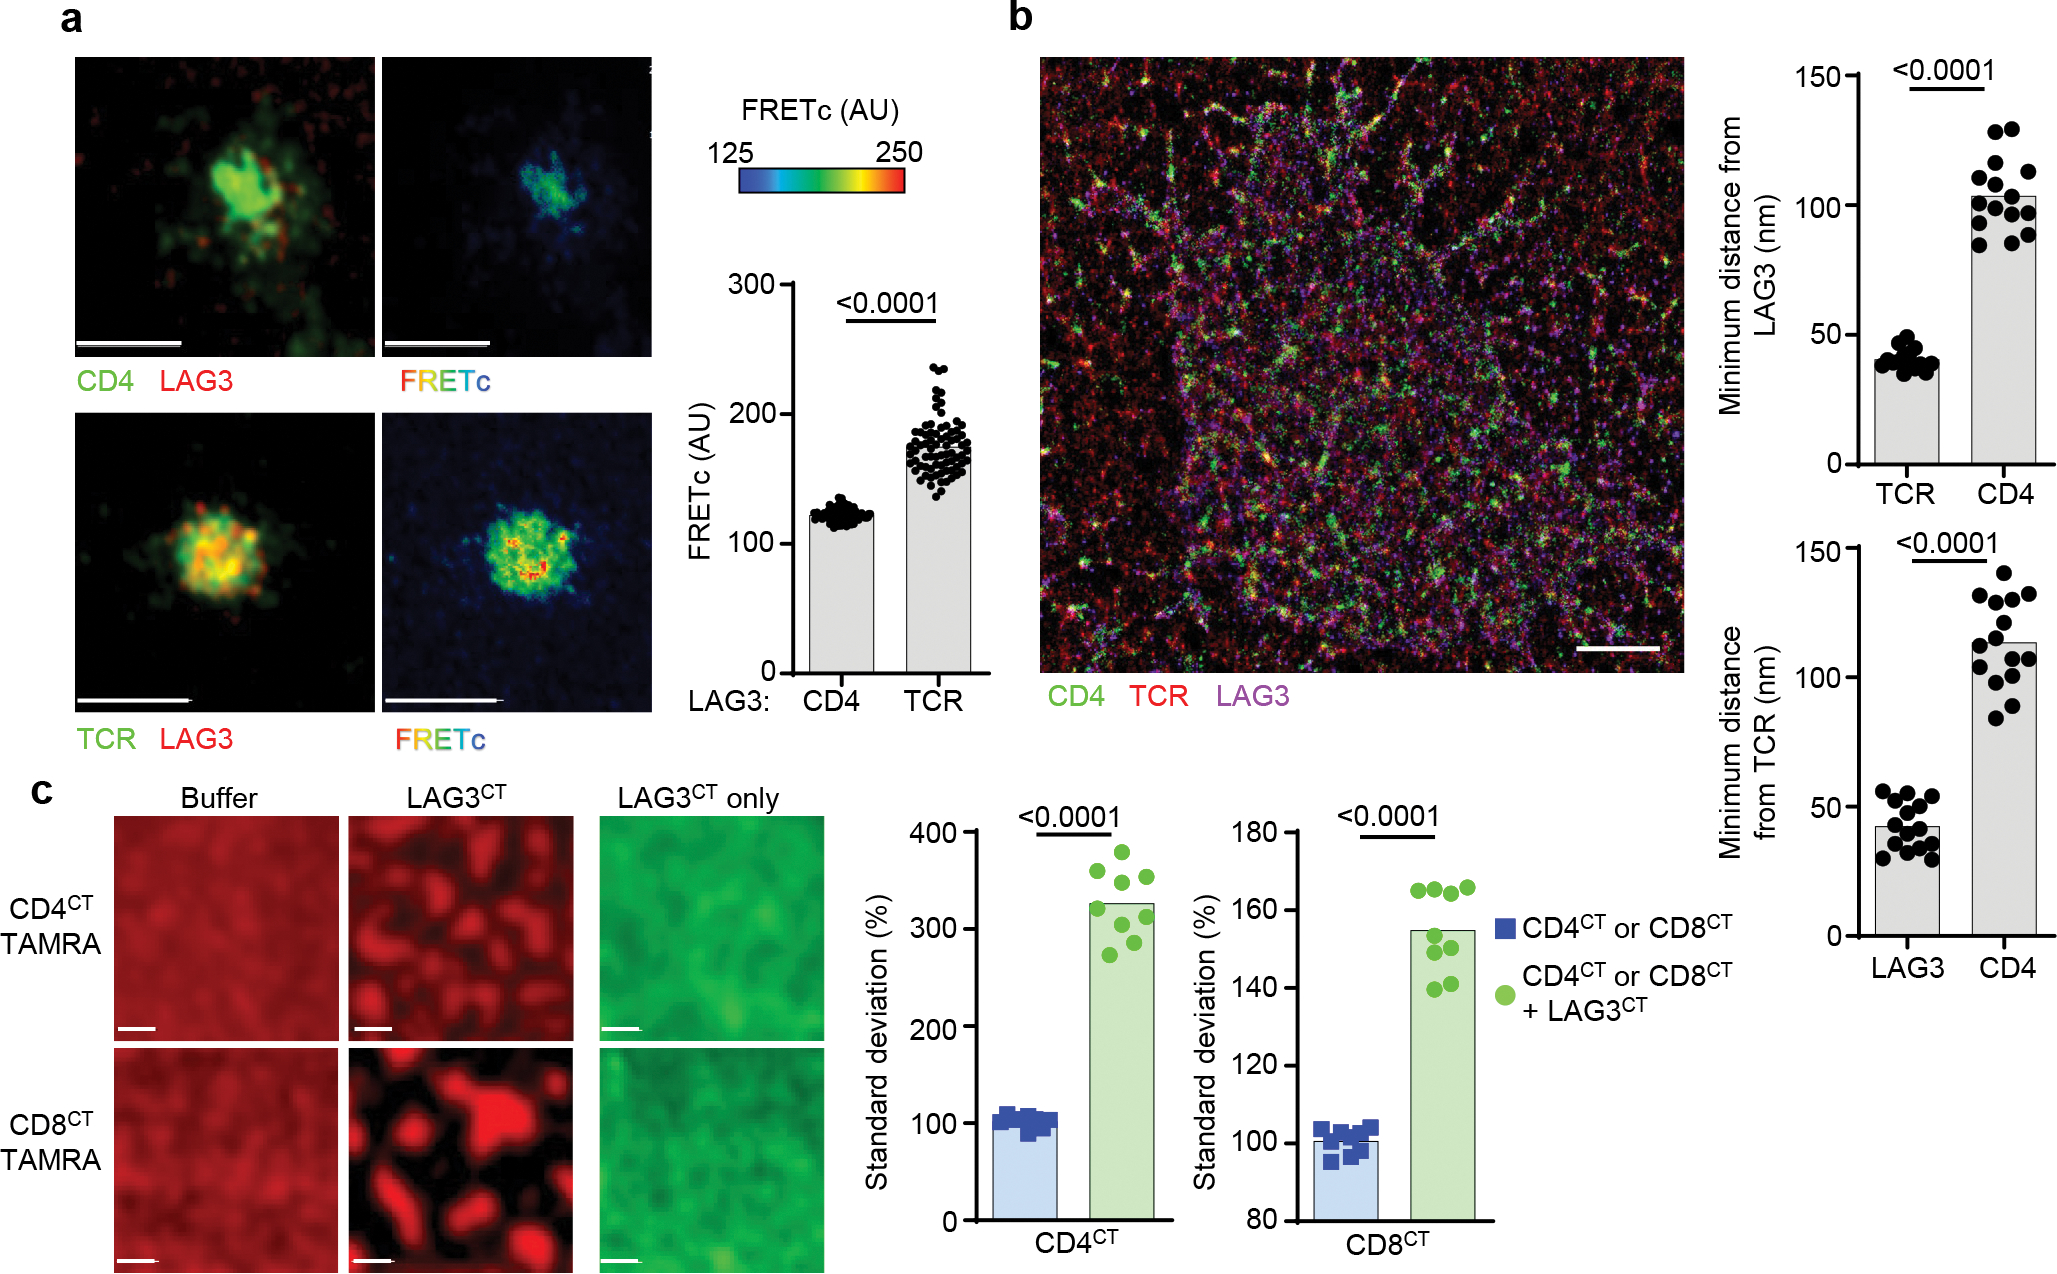
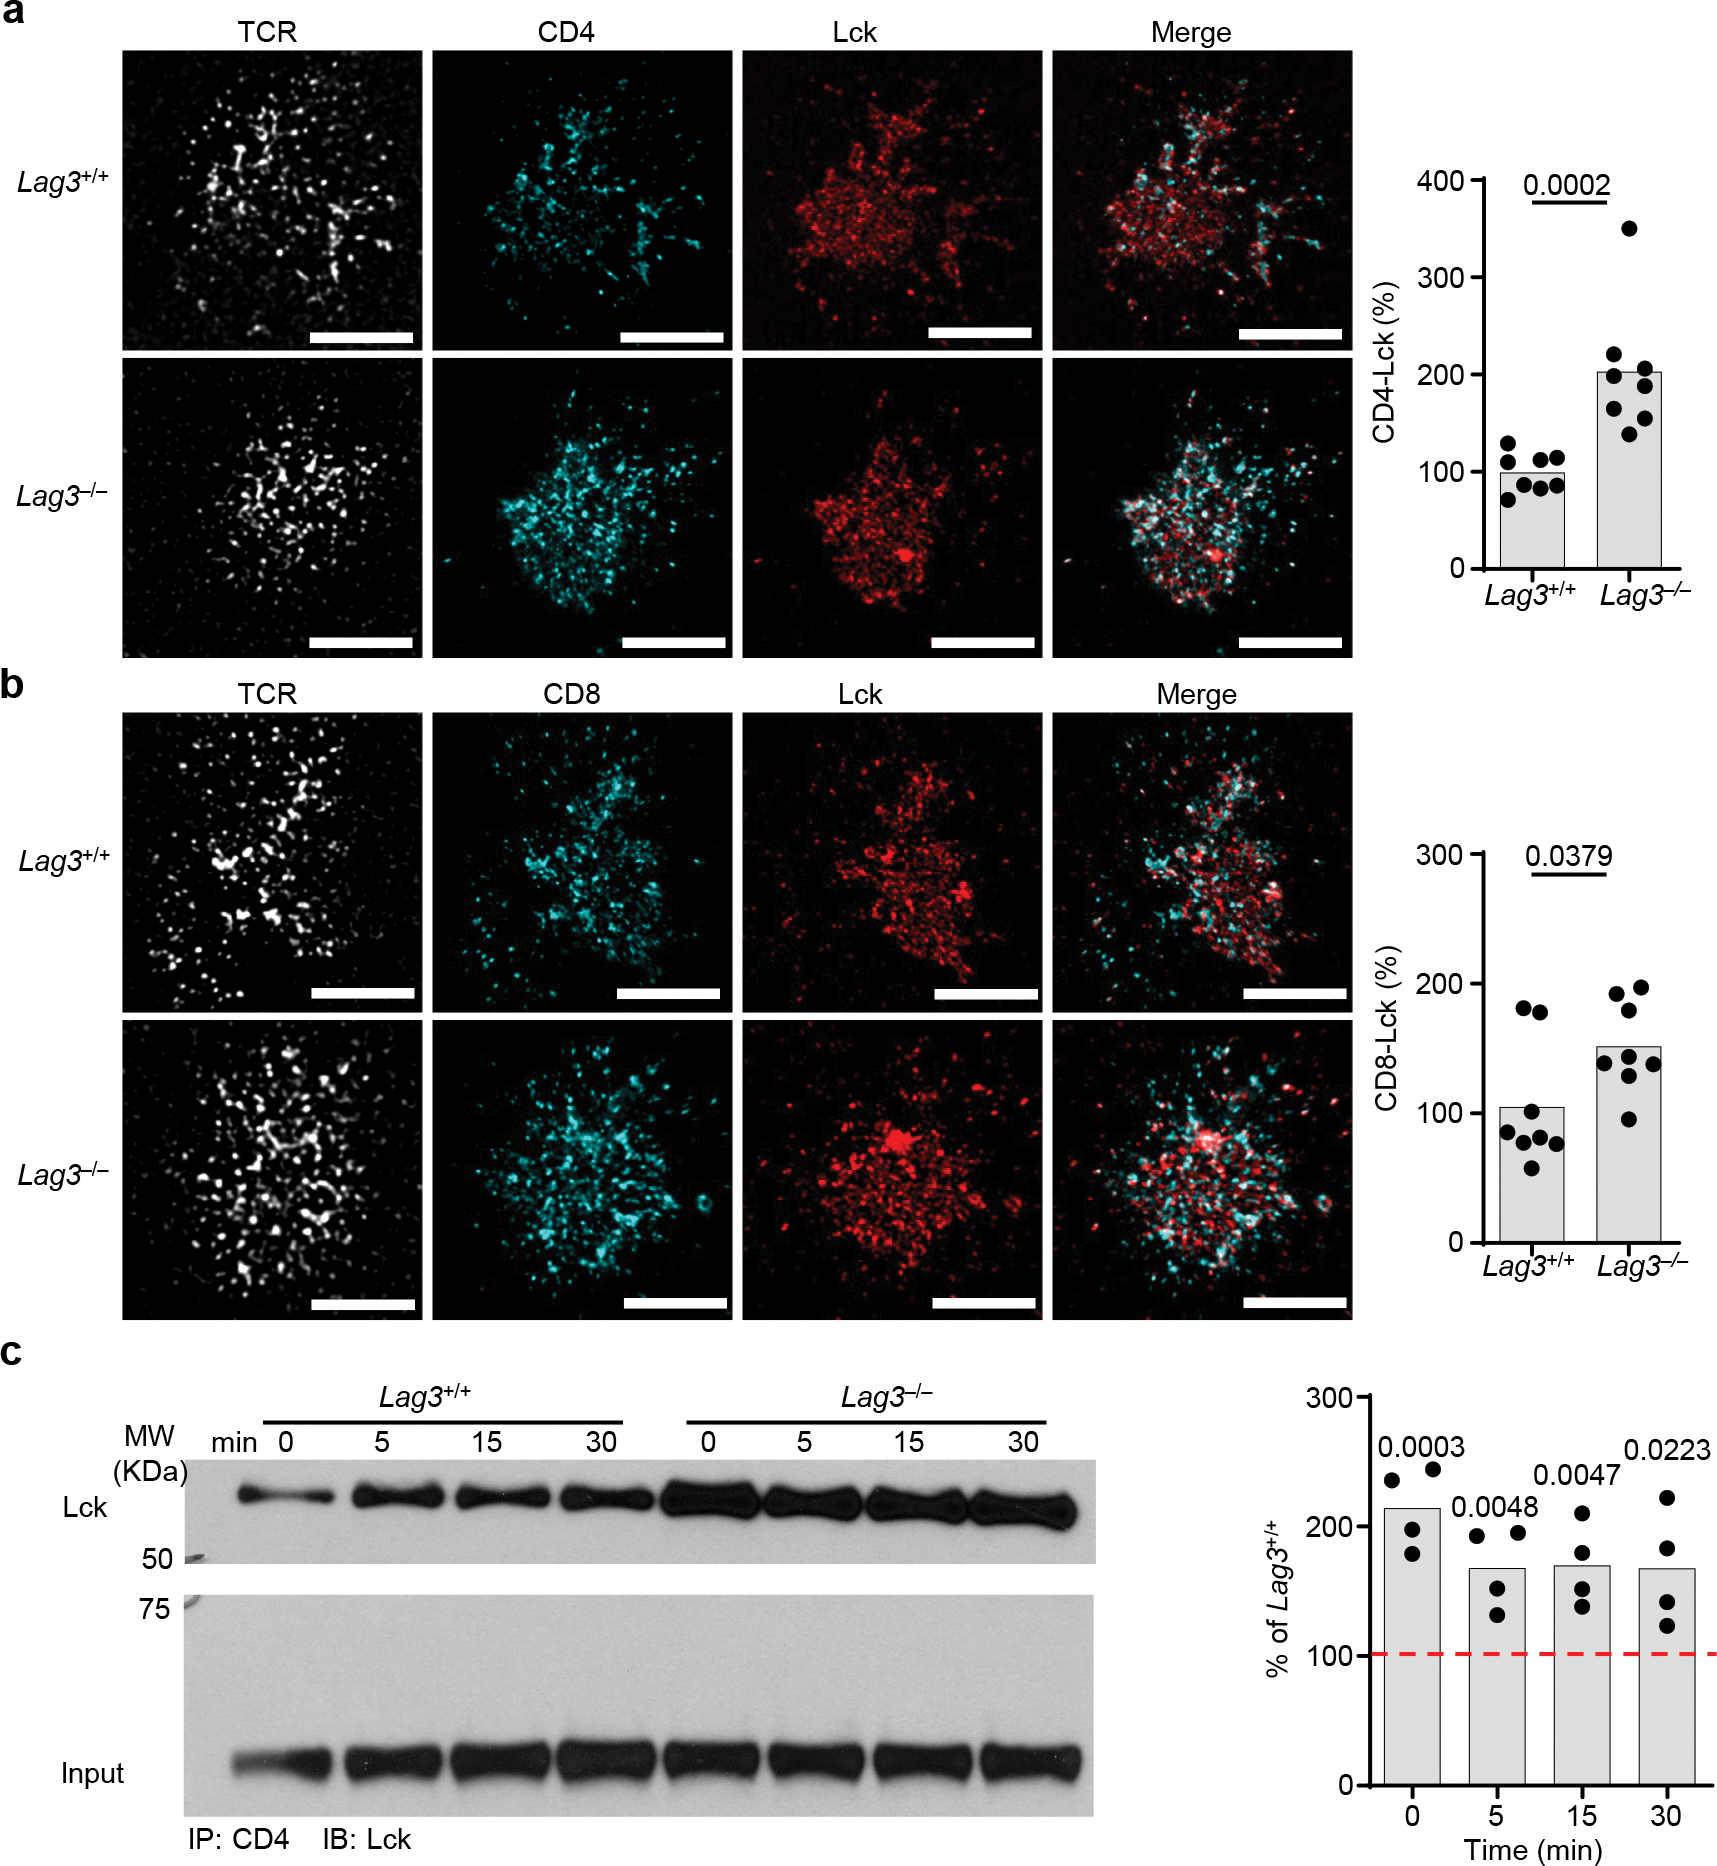
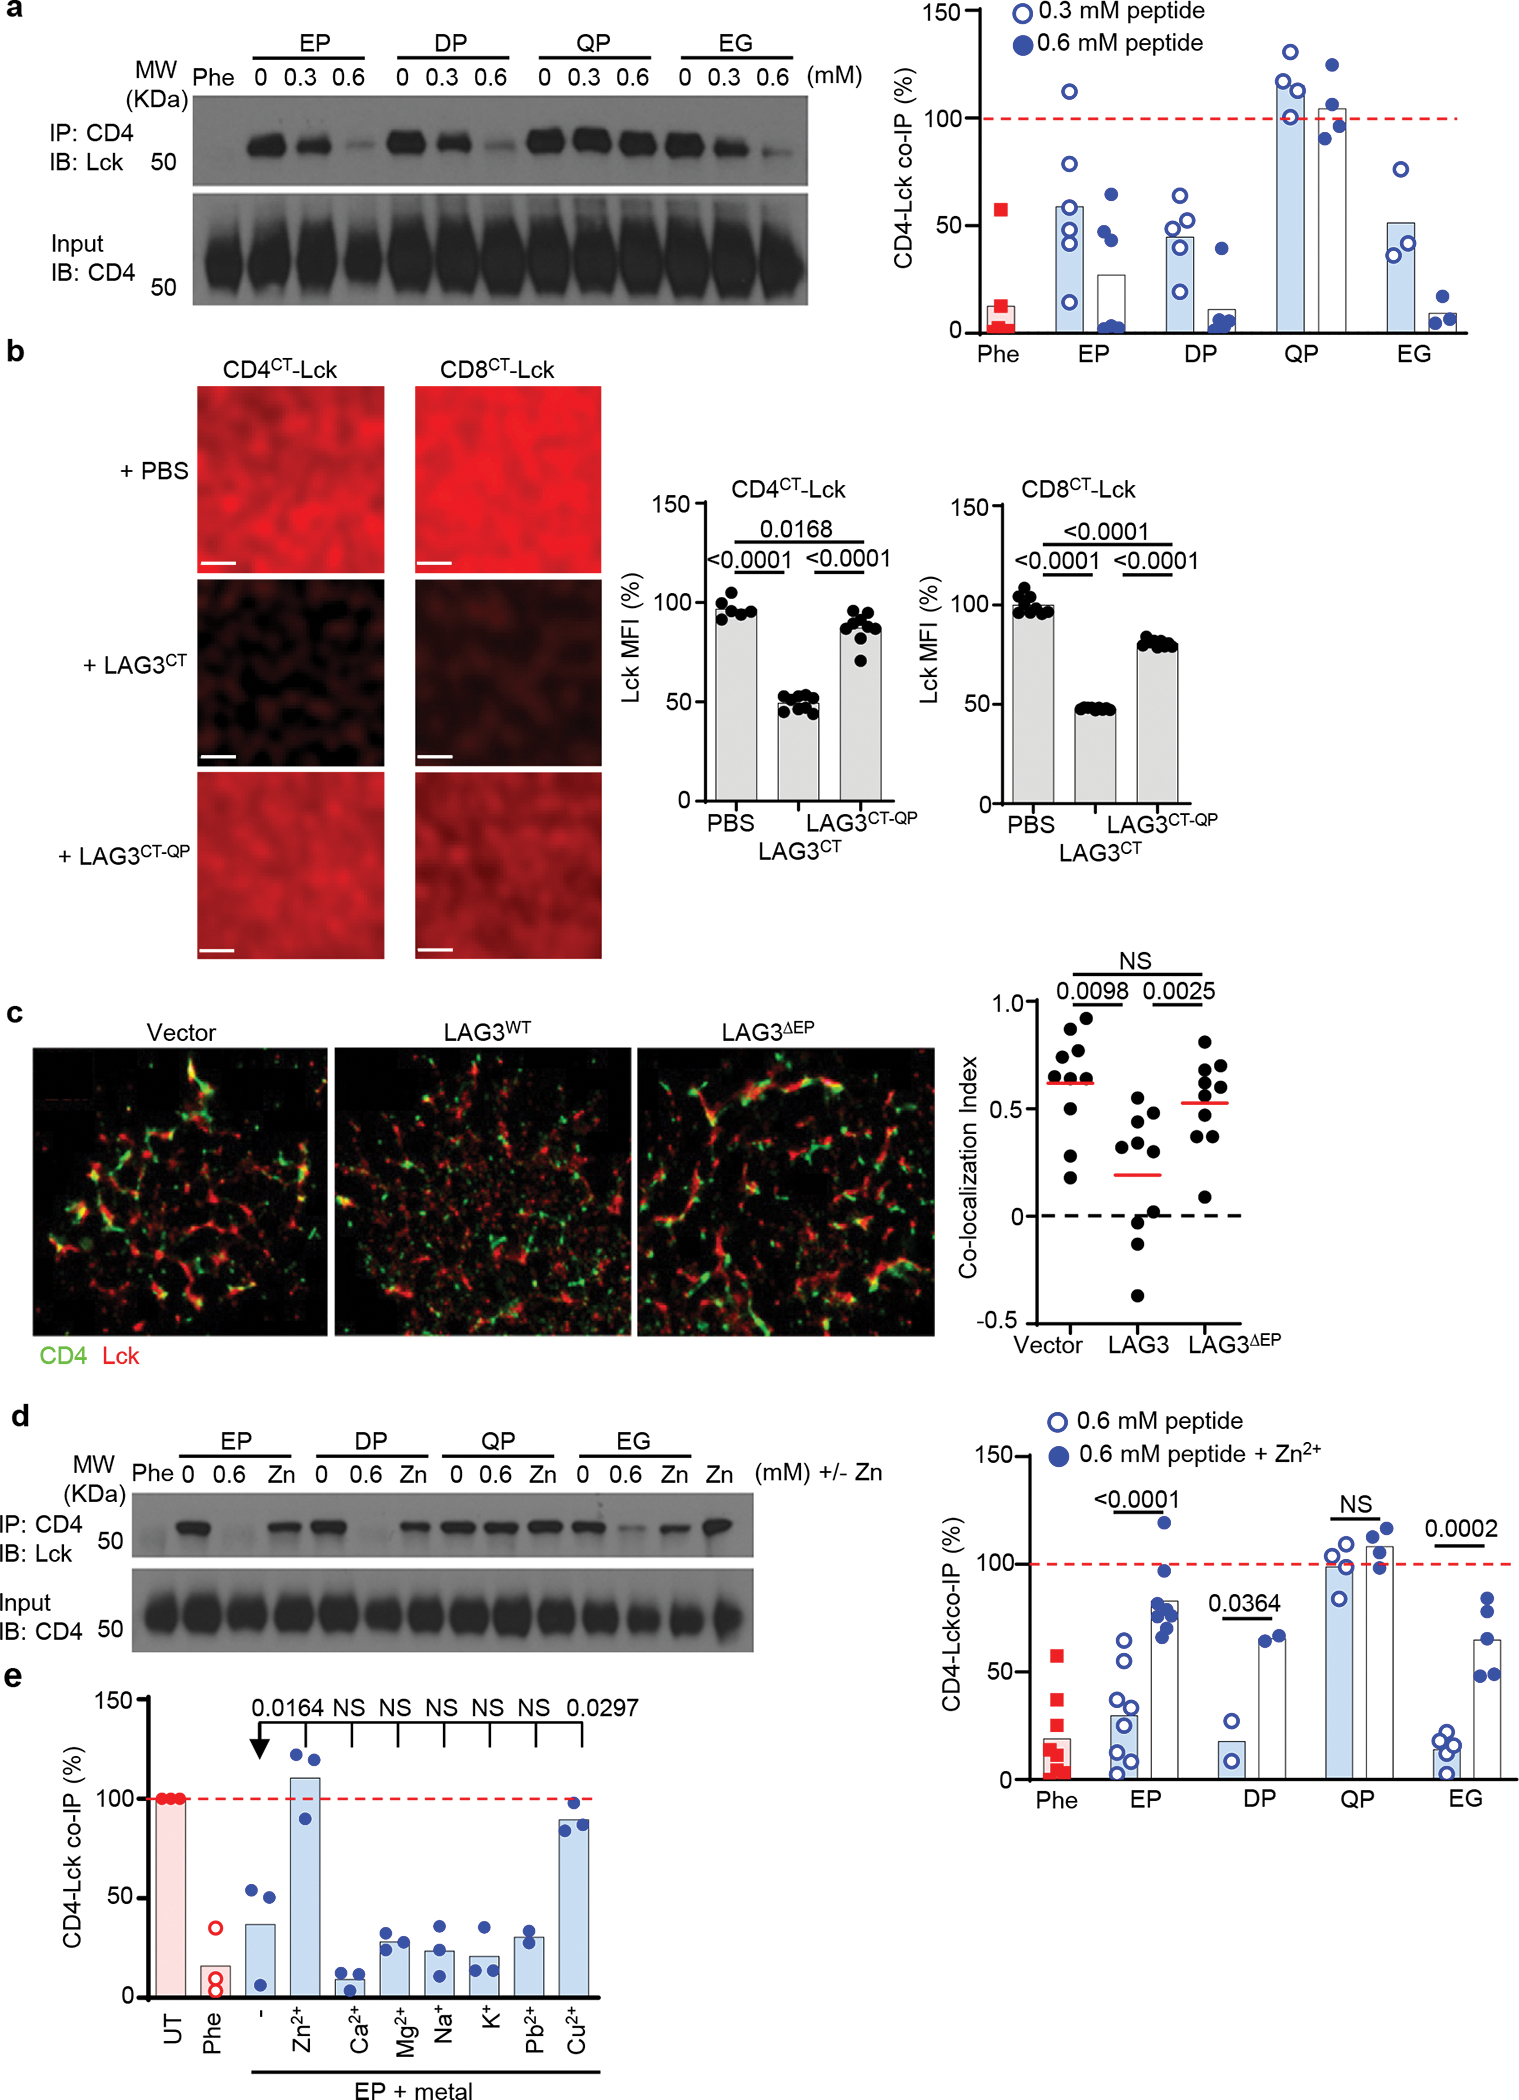
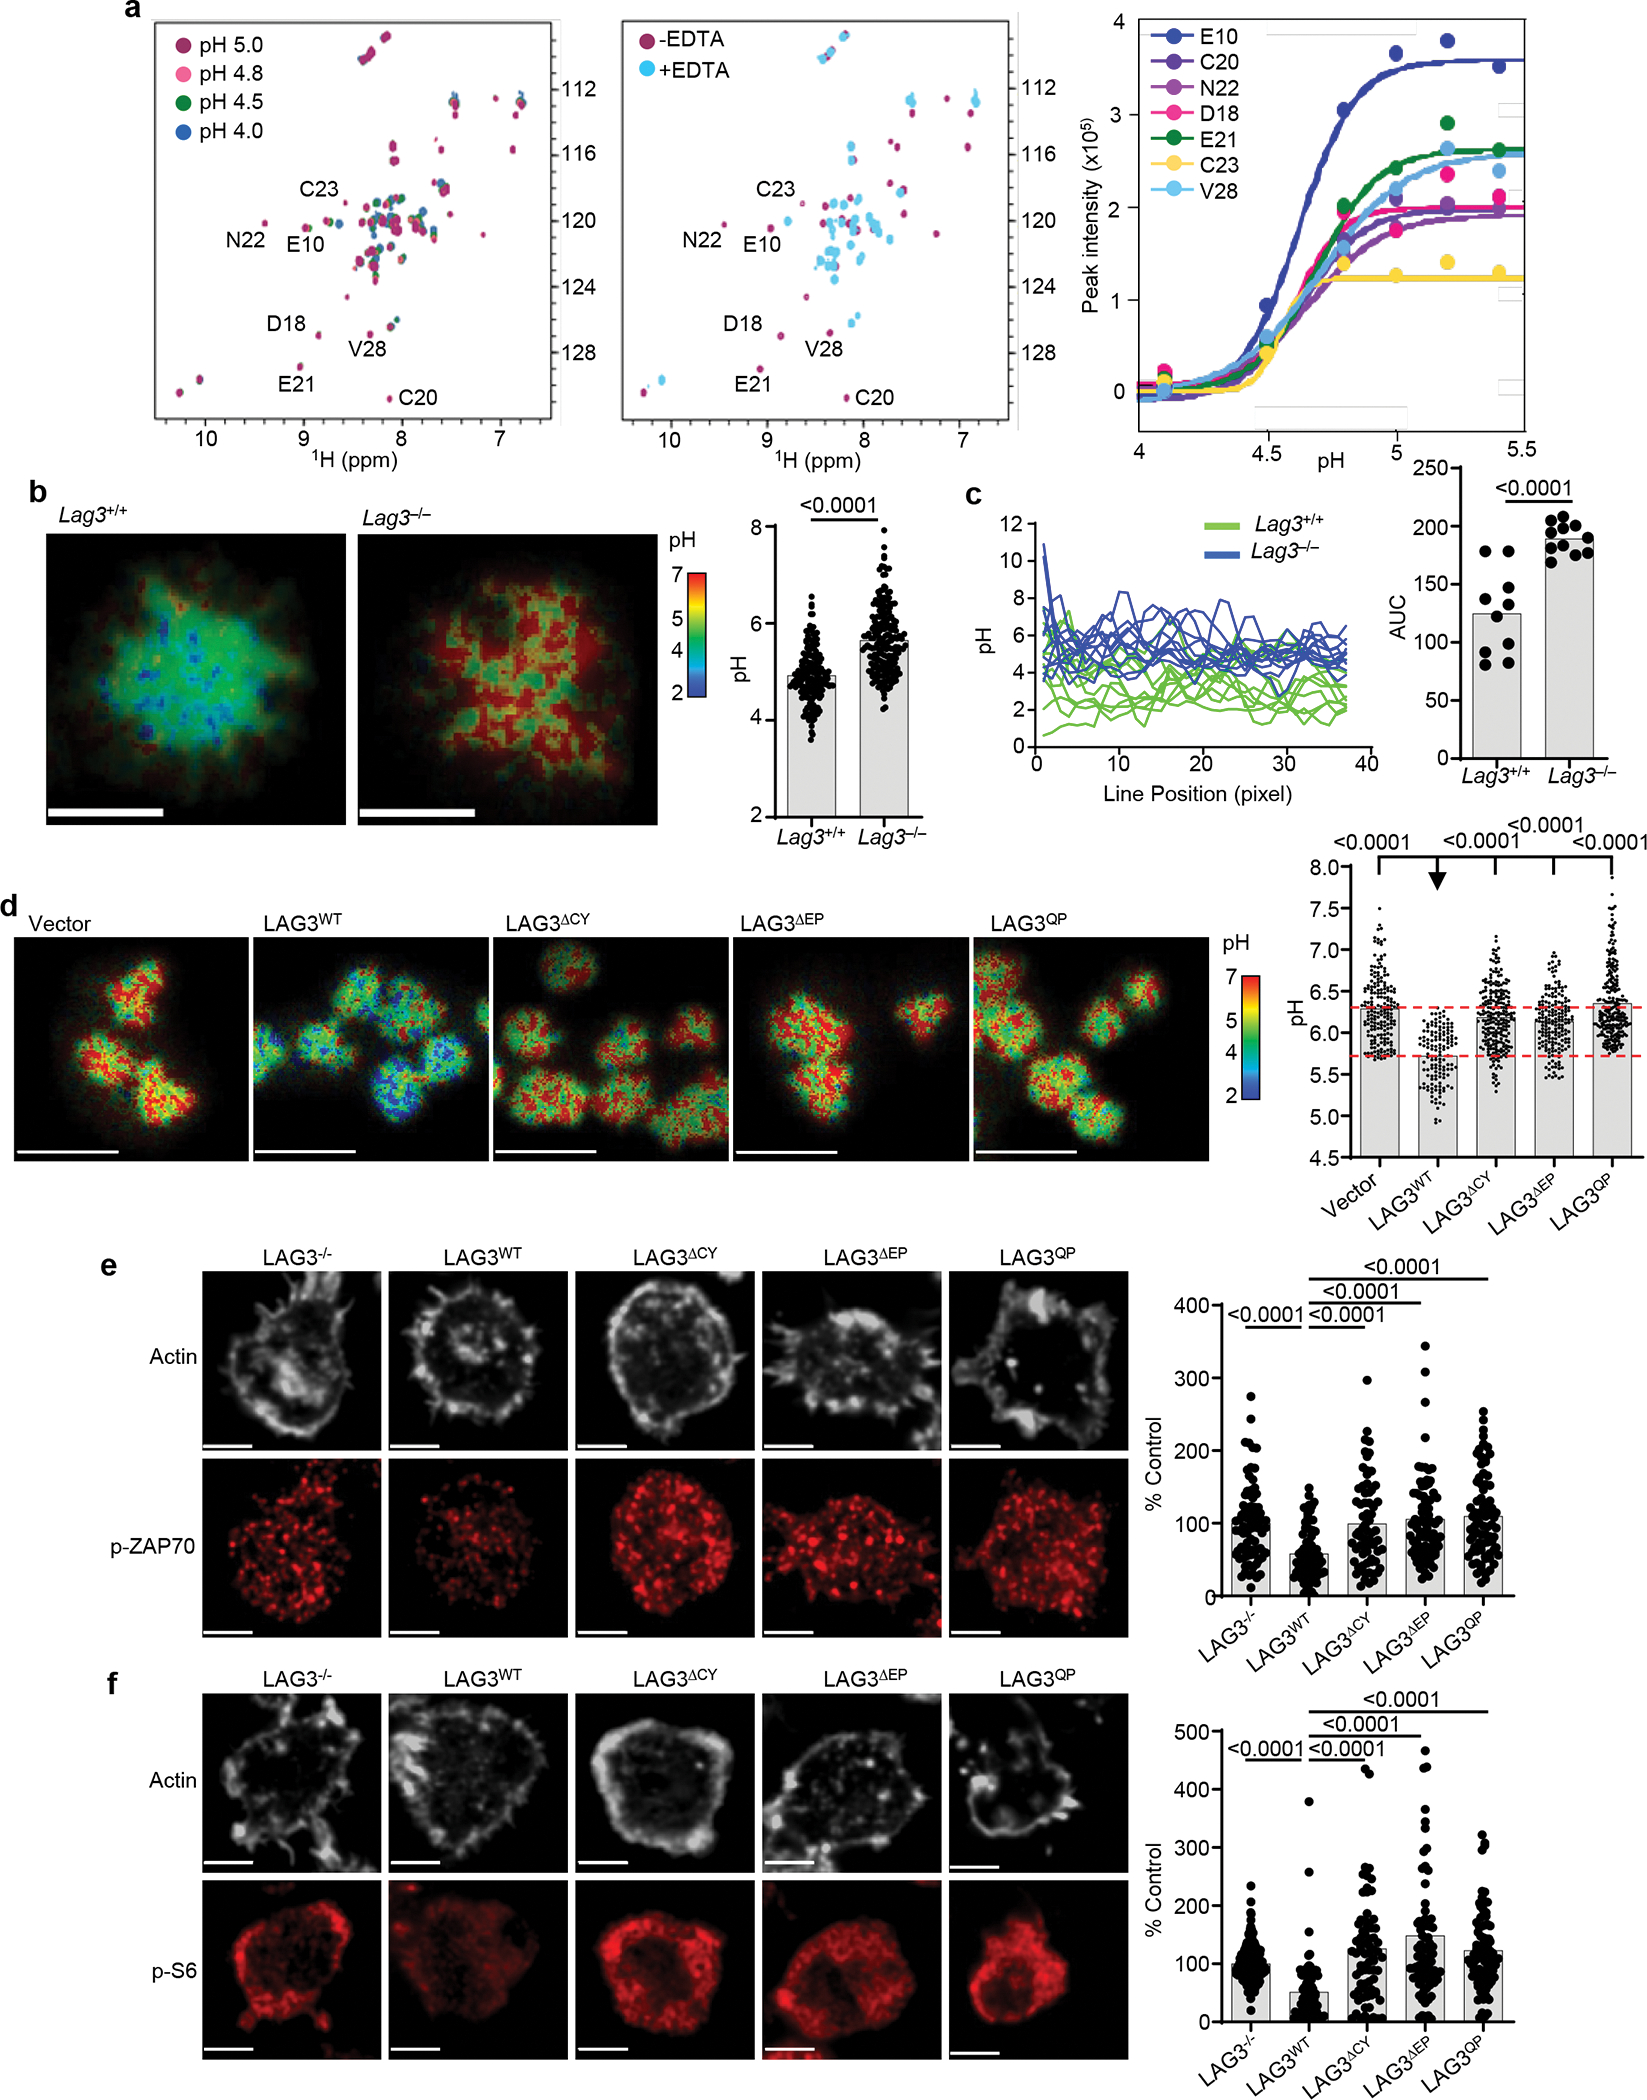
LAG3 is an inhibitory receptor that is highly expressed on exhausted T cells. Although LAG3-targeting immunotherapeutics are currently in clinical trials, how LAG3 inhibits T cell function remains unclear. Here, we show that LAG3 moved to the immunological synapse and associated with the T cell receptor (TCR)-CD3 complex in CD4+ and CD8+ T cells, in the absence of binding to major histocompatibility complex class II-its canonical ligand. Mechanistically, a phylogenetically conserved, acidic, tandem glutamic acid-proline repeat in the LAG3 cytoplasmic tail lowered the pH at the immune synapse and caused dissociation of the tyrosine kinase Lck from the CD4 or CD8 co-receptor, which resulted in a loss of co-receptor-TCR signaling and limited T cell activation. These observations indicated that LAG3 functioned as a signal disruptor in a major histocompatibility complex class II-independent manner, and provide insight into the mechanism of action of LAG3-targeting immunotherapies.


Conflict of interest statement

CONFLICTS OF INTEREST

The authors declare competing financial interests. D.M.M. is an employee and stock holder of Dewpoint Therapeutics. D.A.A.V. and C.J.W. have patents covering LAG3, with others pending, and are entitled to a share in net income generated from licensing of these patent rights for commercial development. DAAV: cofounder and stock holder – Novasenta, Potenza, Tizona, Trishula; stock holder – Oncorus, Werewolf, Apeximmune; patents licensed and royalties - Astellas, BMS, Novasenta; scientific advisory board member - Tizona, Werewolf, F-Star, Bicara, Apeximmune, T7/Imreg Bio; consultant - Astellas, BMS, Almirall, Incyte, G1 Therapeutics; research funding – BMS, Astellas and Novasenta. The remaining authors declare no competing interests.

Figures

Extended Data Fig. 1
(a) Thymidine incorporation proliferation assay with purified CD4+ T cells from spleen and lymph nodes of LAG3+/+ and LAG3−/− mice stimulated with plate bound CD3ε and CD28 Abs for 72h in the absence (a) or presence of isotype control or anti-LAG3 blocking antibodies (b). (c) LAG3 expression of LAG3+/+ CD4+ T cells, isolated as above following activation with CD3ε and CD28 Abs at 48hr. Cells were gated on a live lymphocyte gate, and CD4. (d) Diagram depicting TIRF microscopy analysis on stimulating lipid bilayer. (e) Western blot analysis and quantification of TCR–proximal signaling events in Lag3+/+ or Lag3−/− CD4+ T cells stimulated for 48 hr with CD3ε and CD28 Abs to induce LAG3 expression, allowed to rest in the presence of IL-2 and then re-stimulated for 5, 15 and 30 min with anti-CD3. Quantitation determined by percent density of Lag3−/− compared to Lag3+/+. Data in (a) represents the mean of n=16 (LAG3+/+) and n= 16 (LAG3−/−) individual mice. Data in (b) represents the mean of n=6 (LAG3+/+) and n= 6 (LAG3−/−) individual mice. Data in (e) represents the mean of 4–8 individual experiments. Statistical analysis performed using Student’s unpaired two-sided t test with P values noted in figures.
Extended Data Fig. 2
(a) Diagram depicting TIRF microscopy analysis of Lag3−/− CD4+ T cells containing FAP tagged LAG3 in the presences of MGnBu to visualize the FAP, stimulated on a planar lipid bilayer containing ICAM and biotinylated TCRβ Ab, with streptavidin Alexa 488 to allow for visualization of TCR clustering. (b) Real-time fluorescent TIRFM visualizing LAG3 (red) and TCR (green) of CD8+ T cells, isolated from spleen and lymph nodes of Lag3−/−mice, containing FAP tagged LAG3 stimulated on a planar lipid bilayer containing TCRβ Ab for 15 minutes (Scale bar = 5μm). (c) Activated T cells were immunolabeled for Tubulin (green) and mitochondria (Red) and imaged using 3-dimensional super resolution confocal either pre- (upper) or post-expansion microscopy (lower) and their maximum cell width determined as a measure of fold expansion. (d) Lag3+/+ and Lag3−/− CD4+ and CD8+ T cells, isolated as above, were immunolabeled to detect TCR and LAG3, and subjected to expansion microscopy with the degree of co-localization presented (Scale bar = 10μm). (e) Co-immunoprecipitation of the TCR-CD3 complex with LAG3 in resting Lag3+/+ and Lag3−/− transgenic CD4+ T cells and stimulated in the presence of peptide and MHC class II. (f) Molecular distribution of TCR and LAG3 in non-stimulated Lag3+/+ CD4+ and CD8+ T cells, isolated as above, as determined by STORM with quantification shown on the right (Scale bar = 1μm). Data in (b) and (d) is representative of 3 and 2 independent experiments respectively. Statistics (d, f) was determined by Wilcoxon matched pairs signed rank test or student’s unpaired two-sided t test (c) with P values noted in figures.
Extended Data Fig. 3
(a) Dynamic association of LAG3, TCR and CD8 on Lag3+/+ CD8+ T cells stimulated with TCRβ Ab using sensitized emission FRETc with quantification shown (Scale bar = 5μm). (b) The average number of LAG3 and CD4 molecules that are within 25 nm × 25 nm × 50 nm area around the TCR in Lag3+/+ CD4+ T cells, isolated as above, following stimulation with TCRβ Ab as determined by the STORM-derived coordinates. Data are representative of at least 3–5 experiments. (c) Diagram depicting a fluid planar lipid bilayer system for analysis of protein-protein interactions. In the system, fluorescently tagged (TAMRA) CD4CT or CD8CT are anchored to the lipid bilayer via his-binding phospholipids resulting in fluid, randomly distributed TAMRA molecules visualized using confocal microscopy. Protein interactions are observed following addition of a peptide (LAG3CT) resulting in phase separation and redistribution of molecules into supramolecular clusters. (d, e) Molecular distribution of CD4 (d), CD8 (e) and Lck within the IS of Lag3+/+ and Lag3−/− CD4+ or CD8+ T cells, isolated as above, as determined by STORM with quantification of the Co-localization index (Scale bar = 0.5μm). STORM imaging data are representative of 15 data sets derived from 3 separate experiments. Statistics determined by unpaired Student’s two sided t test (a, b) and by Wilcoxon matched pairs signed rank test (d, f). P values are noted in figures.
Extended Data Fig. 4
Sequence alignment of LAG3CT with acidic residues highlighted red.
Extended Data Fig. 5
(a) LAG3CT ‘EP’ and mutant peptide sequences. (b) Diagram depicting a fluid planar lipid bilayer system for analysis of the association/disassociation of p56lck from CD4 or CD8. In the system, TAMRA labeled p56lck is associated with CD4CT or CD8CT anchored to the lipid bilayer via his-binding phospholipids resulting in fluid, randomly distributed TAMRA molecules visualized using confocal microscopy. Dissociation of p56lck is observed following addition of a peptide (LAG3CT) resulting in a reduction of TAMRA labeled p56lck and reduced MFI. (c) Determination of phase separation and intermolecular interactions using TAMRA-labeled membrane-tethered CD4CT with AF647-labeled LAG3CT or LAG3CT-QP mutant as photoquencher. Quantification of CD4 quenching or recovery post-photobleaching of acceptor is shown from 2 independent experiments (Scale bar = 1μm). (d) hCD4 and hCD8 CT sequence. Statistics determined by unpaired Student’s two sided t test. P values are noted in figures.
Extended Data Fig. 6
(a) The disordered cytoplasmic tail of hLAG3 binds Zn2+ weakly, in an entropically driven thermodynamic process. ITC curves at 15°C of Zn2+ titrated into 75 μM hLAG3 peptides, in 10 mM Tris pH 7.0 buffer show that acidic residues are required for metal binding. (b) Cytoplasmic tails of hLck and hCD4 fold upon binding in the presence of Zn2+ as described in Kim PW et al., Science (2003). 1H/15N HSQC spectra of a 50 μM 1:1 complex 15N-Lck : CD4, in the presence of 1.2 molar equivalents of Zn2+ (blue) and the same sample treated with 0.25 mM EDTA (red).
Extended Data Fig. 7
(a, b) Analysis of TCR-induced signaling events in Lag3−/−CD8+ T cells, isolated as above, transduced with LAG3WT or LAG3 functional domain mutants and stimulated with TCRβ Abs. Representative super resolution confocal images are depicted, with quantification of single cell intensity measurements collected from two independent experiments presented as percent of LAG3-deficient parental cells as control (Scale bar 2μm). Statistics determined by unpaired Student’s two sided t test. P values are noted in figures.
Figure 1.
Figure 1.. LAG3 inhibits T cell function in the absence of MHC class II ligation.
(a) Proliferation of CD8+ or CD4+ T cells from spleen and lymph nodes of LAG3+/+ and LAG3−/− mice stimulated with plate bound CD3 and CD28 Abs for 72 hr. (b) Calcium flux in CD8+ or CD4+T cell of LAG3+/+ and LAG3−/− mice isolated as above restimulated on planar lipid bilayers containing TCRβ Ab. (c) Representative confocal images of TCR–proximal signaling events in CD4+ and CD8+ T cells from spleen and lymph nodes of Lag3+/+ and Lag3−/− mice, stimulated for 48 h with plate bound CD3ε and CD28 Abs to induce LAG3 expression, rested for 48h in the presence of IL-2 and re-stimulated with TCRβ Abs for 15 min on stimulating lipid bilayers with quantification of single cell intensity measurements presented as area of puncta representing phosphorylated signaling proteins (Scale bar = 5μm). (a,b) Data represents the mean of n=7 (LAG3+/+) and n= 9 (LAG3−/−) individual mice and statistics determined by unpaired Student’s two sided t test; (a, b, c) Data from 3–5 independent experiments with P values noted in figure.
Figure 2.
Figure 2.. LAG3 associates with the TCR-CD3 complex.
(a) TIRFM visualizing LAG3 (red) and TCR (green) of Lag3−/− CD4+ T cells isolated as above, containing FAP tagged LAG3 stimulated on a planar lipid bilayer with TCRβ Ab for 15 minutes (Scale bar = 5μm). (b) Representative super resolution STED of molecular distribution of TCR and LAG3 determined in CD4+ and CD8+ T cells isolated from spleen and lymph nodes of Lag3+/+ mice and stimulated with TCRβ Abs (scale bar = 2μm) with the co-localization index quantified shown. (c) Representative super resolution STORM of molecular distribution of TCR and LAG3 in stimulated CD4+ and CD8+ T cells as above (scale bar = 1μm) with the Co-localization index quantified shown. (d) Co-immunoprecipitation of the TCR-CD3 complex with LAG3 in resting and TCR stimulated Lag3+/+ and Lag3−/− CD4+ T cells, with quantification of 5 separate experiments depicted. Data in (a) is representative of at least 3 independent experiments. Data in (b, c) represents of the mean of 2 independent experiments and statistics determined by Wilcoxon matched pairs signed rank test with P values noted in figure. Data in (d) represents of the mean of 5 independent experiments.
Figure 3.
Figure 3.. LAG3 association with the TCR-CD3 complex increases LAG3 proximity to the co-receptors.
(a) Dynamic association of LAG3, TCR and CD4 on Lag3+/+ CD4+ T cells stimulated with TCRβ Ab using sensitized emission FRET with quantification shown (Scale bar = 5μm). (b) Representative super resolution STORM of molecular distribution of CD4, LAG3 and TCR within the IS determined in CD4+ T cells isolated from spleen and lymph nodes of Lag3+/+ mice and stimulated with TCRβ Abs. Three-dimensional intermolecular analyses of STORM molecule data and the median shortest distance from LAG3 to TCR and CD4 (top) or TCR to LAG3 and CD4 (bottom) (scale bar = 1μm). (c) Representative confocal image of phase separation assay using lipid bilayers containing TAMRA labeled CD4CT or CD8CT in the presence or absence of LAG3CT, with LAG3CT labeled with AF647 to visualize as a control (scale bar = 1μm). Quantification of phase separation assay with standard deviation as a measure of homogeneity. Data in (a, b and c) represent analyses from at least 3–4 independent experiments and statistics determined by unpaired Student’s two-sided t test or Wilcoxon matched pairs signed rank test with P values noted in figure.
Figure 4.
Figure 4.. LAG3 association with the TCR-CD3 complex increases LAG3 proximity to the co-receptors.
(a,b) Representative super resolution STED of association of Lck with CD4 and CD8 coreceptors in CD4+ or CD8+ T cells isolated from the spleen and lymph nodes of LAG3+/+ and LAG3−/− mice with quantification of their association shown (Scale bar = 2μm). (c) Co-immunoprecipitation western blot analyses of Lck with CD4 in CD4+ or CD8+ T cells isolated from the spleen and lymph nodes of LAG3+/+ and LAG3−/− mice, with quantification shown. Data in (a-c) represent analyses from at least 3–4 independent experiments and statistics determined by unpaired Student’s two-sided t test or (c) Wilcoxon matched pairs signed rank test with P values noted in figure.
Figure 5.
Figure 5.. The ‘EP’ motif in the CT of LAG3 disrupts co-receptor-Lck complex.
(a) Immunoblot analyses of CD4 and Lck in lysates of Lag3−/− CD4+ T cell stimulated with CD3ε and CD28 Abs, following one hour incubation with 26 amino acid LAG3 ‘EP’ peptide motif or peptides with amino acid substitutions as depicted with 1–10-O pheanthroline (Phe) utilized as a positive control. (b) Analysis of phase separation and dissociation of Lck from membrane-tethered CD4CT or CD8CT in response to LAG3CT or LAG3CT-QP mutant, with quantification shown. Scale bar 1μm. (c) Representative super resolution STORM of molecular interactions between CD4 and Lck in CD4+ T cells isolated from the spleens and lymph nodes of Lag3−/− mice, transduced with empty vector, LAG3 or LAG3 lacking the ‘EP’ motif (LAG3ΔEP) and stimulated with TCRβ Abs. The co-localization index of CD4 and Lck was analyzed and is depicted. Scale bar 5 μm. (d) Immunoblot and quantification of co-immunoprecipitation western blot analyses of CD4 and Lck in Lag3−/− CD4+ T cell lysates as above following addition of the LAG3 ‘EP’ peptide motif or peptide mutants in the presence or absence of competing Zn2+ or (e) alternative 2+ metals. Data in (a, b, d, e) are representative of 3–5 experiments, with statistical analysis performed using Student’s unpaired two-sided t test. For (c) data are representative of at least 2 experiments and 15 individual data sets with data represented as mean and statistics determined by Kruskal-Wallis test. P values are noted in figure.
Figure 6.
Figure 6.. LAG3 dissociates Lck from CD4 by lowering the local pH at the IS.
(a) Analyses of CD4-Lck complex formation evaluated by 2D NMR under conditions of varying pH, using the 1H/15N HSQC spectra of a 50 μM 1:1 complex 15N-Lck:CD4CT in the presence of 1.2 molar equivalents of Zn2+ with addition of EDTA as control. Right: pH-dependent changes in the peak intensity for selected residues normalized to their intensity in the spectrum of the fully folded complex. (b) Representative confocal FLIM images of BCECF-labeled CD4+ T cells isolated from spleen and lymph nodes of Lag3+/+ and Lag3−/− mice to determine the intracellular membrane-proximal pH by fluorescent lifetime imaging following stimulation with TCRβ Abs with quantification of membrane-proximal pH of individual cells. Scale bar 5μm. Data are replicates from 3 separate experiments. (c) pH values determined for each pixel along a line drawn through the center of the contact area with quantification of the area under the curve determined. (d) Representative confocal FLIM images of BCECF-labeled Lag3−/− CD4+ T cells transduced with LAG3 and mutants following stimulation with TCRβ Abs with quantification shown. Scale bar 10 μm. Data are replicates from 3 separate experiments. (e, f) Representative super resolution confocal images of TCR-induced signaling events in Lag3−/−CD4+ T cells, isolated as above, transduced with LAG3WT or LAG3 functional domain mutants and stimulated with TCRβ Abs. Single cell intensity measurements collected from two independent experiments presented as percent of LAG3-deficient parental cells as control. Scale bar 2μm. Data represent mean of replicate measurements from at least 2 separate experiments. Data shown for individual cells (b, e) and statistical analysis performed using unpaired Student’s two-sided t test with P values noted in figure.

Comment in

References

    1. Andrews LP, Marciscano AE, Drake CG & Vignali DA LAG3 (CD223) as a cancer immunotherapy target. Immunol Rev 276, 80–96, doi:10.1111/imr.12519 (2017). - DOI - PMC - PubMed
    1. Maruhashi T, Sugiura D, Okazaki IM & Okazaki T LAG-3: from molecular functions to clinical applications. J Immunother Cancer 8, doi:10.1136/jitc-2020-001014 (2020). - DOI - PMC - PubMed
    1. Ruffo E, Wu RC, Bruno TC, Workman CJ & Vignali DAA Lymphocyte-activation gene 3 (LAG3): The next immune checkpoint receptor. Semin Immunol 42, 101305, doi:10.1016/j.smim.2019.101305 (2019). - DOI - PMC - PubMed
    1. Huard B et al. Characterization of the major histocompatibility complex class II binding site on LAG-3 protein. Proc Natl Acad Sci U S A 94, 5744–5749 (1997). - PMC - PubMed
    1. Woo SR et al. Immune inhibitory molecules LAG-3 and PD-1 synergistically regulate T-cell function to promote tumoral immune escape. Cancer Res 72, 917–927, doi:10.1158/0008-5472.CAN-11-1620 (2012). - DOI - PMC - PubMed

Publication types

MeSH terms

Substances