. 2022 May;28(5):1006-1013.
doi: 10.1038/s41591-022-01767-6. Epub 2022 Apr 18.

Development of a clinical polygenic risk score assay and reporting workflow

Affiliations

Development of a clinical polygenic risk score assay and reporting workflow

Limin Hao et al. Nat Med. 2022 May.

Abstract

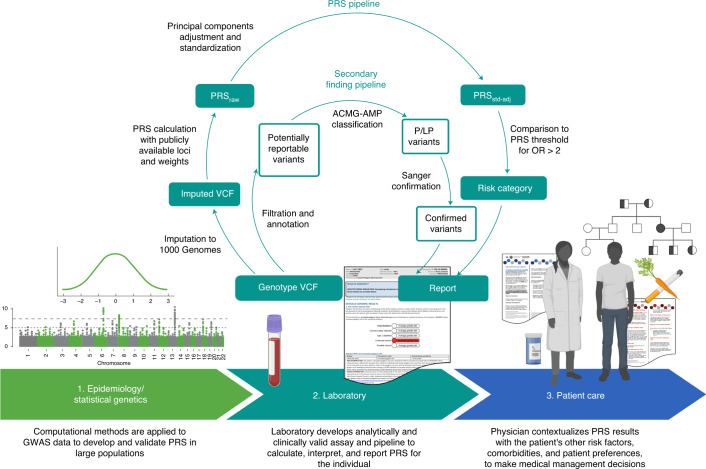
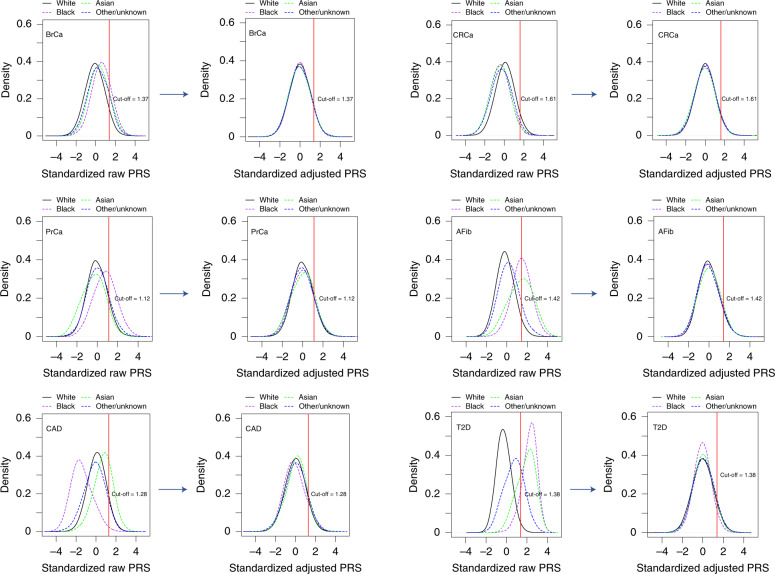
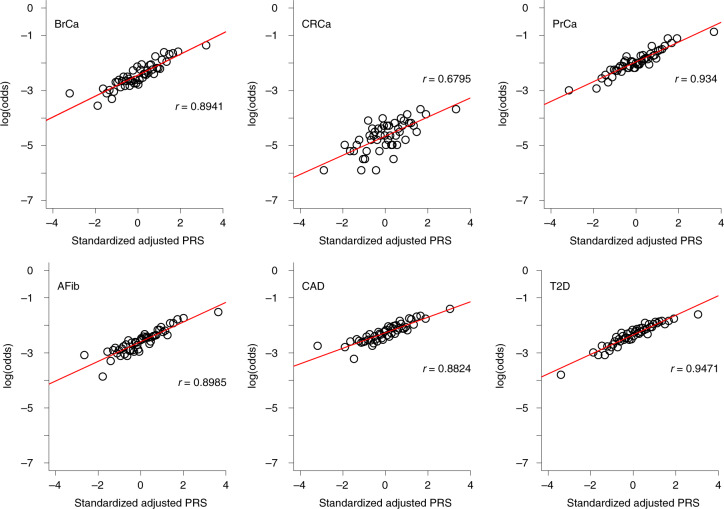
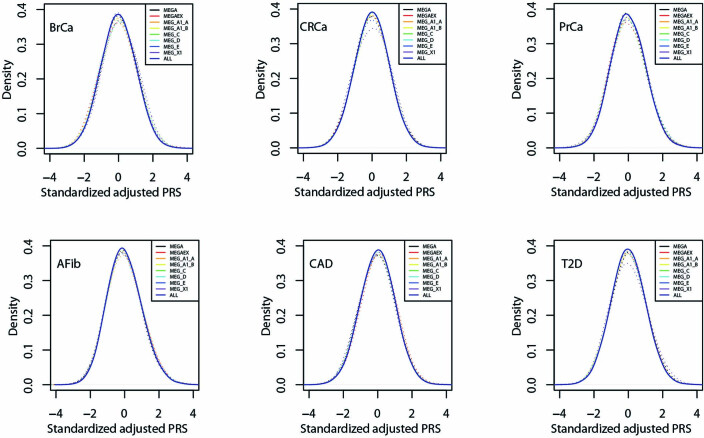
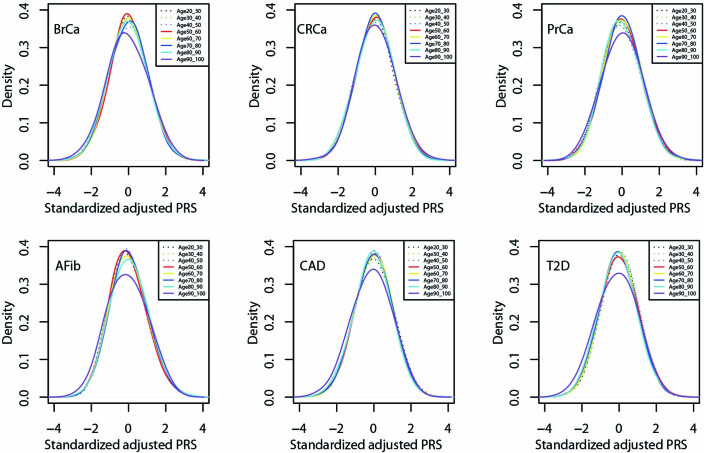
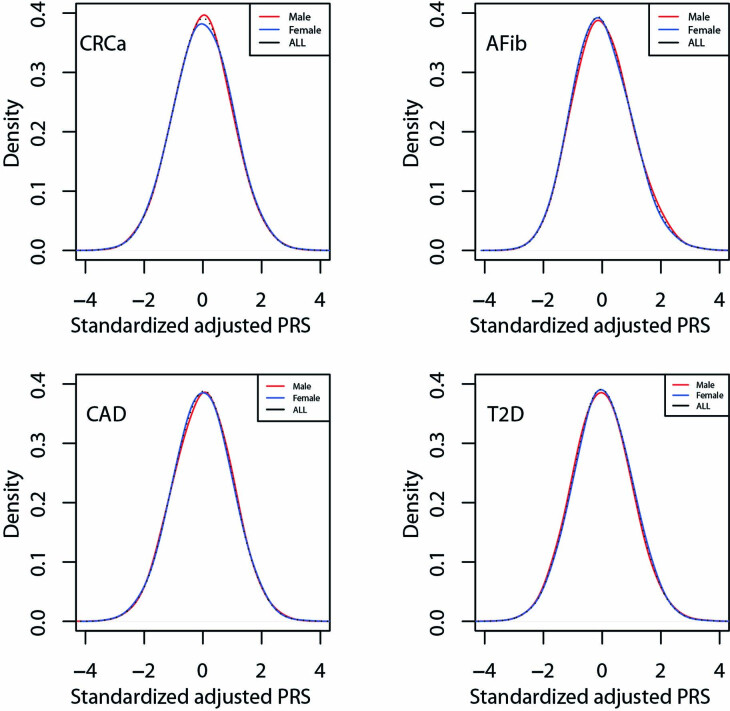
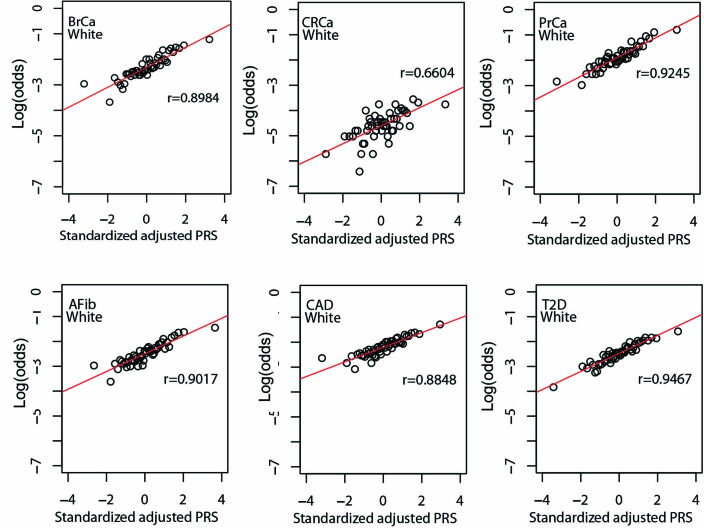
Implementation of polygenic risk scores (PRS) may improve disease prevention and management but poses several challenges: the construction of clinically valid assays, interpretation for individual patients, and the development of clinical workflows and resources to support their use in patient care. For the ongoing Veterans Affairs Genomic Medicine at Veterans Affairs (GenoVA) Study we developed a clinical genotype array-based assay for six published PRS. We used data from 36,423 Mass General Brigham Biobank participants and adjustment for population structure to replicate known PRS-disease associations and published PRS thresholds for a disease odds ratio (OR) of 2 (ranging from 1.75 (95% CI: 1.57-1.95) for type 2 diabetes to 2.38 (95% CI: 2.07-2.73) for breast cancer). After confirming the high performance and robustness of the pipeline for use as a clinical assay for individual patients, we analyzed the first 227 prospective samples from the GenoVA Study and found that the frequency of PRS corresponding to published OR > 2 ranged from 13/227 (5.7%) for colorectal cancer to 23/150 (15.3%) for prostate cancer. In addition to the PRS laboratory report, we developed physician- and patient-oriented informational materials to support decision-making about PRS results. Our work illustrates the generalizable development of a clinical PRS assay for multiple conditions and the technical, reporting and clinical workflow challenges for implementing PRS information in the clinic.


Conflict of interest statement

A.C.F.L. owns stock in Fabric Genomics. S.A.L. receives sponsored research support from Bristol Myers Squibb, Pfizer, Boehringer Ingelheim, Fitbit, Medtronic, Premier and IBM, and has consulted for Bristol Myers Squibb, Pfizer, Blackstone Life Sciences and Invitae. P.N. reports investigator-initiated grants from Amgen, Apple, Boston Scientific, AstraZeneca and Novartis, personal fees from Apple, Genentech, AstraZeneca, Blackstone Life Science, Foresite Labs and Novartis, spousal employment at Vertex, and being co-founder of TenSixteen Bio, all unrelated to the present work. R.C.G. has received compensation for advising the following companies: AIA, Allelica, Embryome, GenomeWeb, Genomic Life, Grail, Humanity, Meenta, OptumLabs, Plumcare, Verily, VinBigData; and is co-founder of Genome Medical, Inc. C.K. now works at Novartis Institutes for BioMedical Research. A.A.A., C.A.B., M.D. and J.L.V. are employees of the US Department of Veterans Affairs (DVA); the views expressed in this paper do not represent those of the DVA or US government. All other authors have no competing interests.

Figures

Fig. 1
Fig. 1. Translation of PRS from discovery to the clinic, including a clinical PRS laboratory pipeline for prospectively collected samples.
In phase 1, PRS are developed, validated and compared to optimize performance in large populations. In phase 2, a clinical laboratory chooses publicly available PRS to implement and develop an analytically and clinically valid assay. For the GenoVA Study, genotype array data are imputed against 1000 Genomes Project data and used to calculate published PRS (PRSraw). PRSraw is adjusted for population structure and standardized as described in the text (PRSstd-adj). High-risk status for each disease is defined as PRS values above published thresholds for OR > 2. A parallel pipeline annotates and filters variants for potentially actionable pathogenic (P) and likely pathogenic (LP) variants in the ACMG SF v2.0 secondary finding gene list. Variants are manually classified according to American College of Medical Genetics and Genomics–Association for Molecular Pathology (ACMG-AMP) criteria by qualified laboratorians and confirmed using Sanger sequencing. Results from both components of the pipeline are included on the laboratory report. In phase 3 the treating physician uses the whole patient context to interpret the significance of the PRS for the patient’s health and healthcare management. Both the physician and patient will probably need educational and consultative support to make medical decisions based on PRS results.
Fig. 2
Fig. 2. Frequency of disease and high-risk PRS results by race in the MGBB.
a, UpSet plot of total cases of each of six phenotypes in 36,423 biobank participants and the counts of participants with one or more diseases, by reported race. b, UpSet plot of total counts of high-risk PRS results (population structure-adjusted PRS corresponding to OR > 2) for each of six diseases and the counts of participants with one or more high-risk PRSstd-adj results, by reported race.
Fig. 3
Fig. 3. PRS distributions by reported race before and after adjustment for population structure.
Plots to the left of each arrow show the distributions of unadjusted published PRS (PRSstd-raw) by race for each of six diseases in up to 36,423 MGBB participants. Plots to the right of each arrow show these distributions after adjustment for population structure (PRSstd-adj), as described in the text. The red vertical line indicates the standardized PRS threshold corresponding to OR > 2 for each disease, based on the OR per standard deviation from the original publication.
Fig. 4
Fig. 4. Correlation between adjusted PRS and odds of disease.
The plots show log(odds) of each of six diseases versus quantile (n = 50) of standardized population structure-adjusted PRS (PRSstd-adj) in up to 36,423 MGBB participants.
Extended Data Fig. 1
Extended Data Fig. 1. Distribution of standardized, adjusted PRS by release batch for six diseases in MGBB.
Standardized, adjusted PRS (PRSstd-adj) plotted by eight batches of three versions of Illumina genotyping arrays (MEG, MEGA, MEGAEX) used to analyze data from up to 36,423 MGBB participants. Abbreviations: AFib, atrial fibrillation; BrCa, breast cancer; CAD, coronary artery disease; CRCa, colorectal cancer; MEG, Multi-Ethnic Global; MEGA, Multi-Ethnic Genotyping Array; MEGAEX, Expanded Multi-Ethnic Genotyping Array; MGBB, Mass General Brigham Biobank; PrCa, prostate cancer; PRS, polygenic risk score; T2D, type 2 diabetes.
Extended Data Fig. 2
Extended Data Fig. 2. Distribution of standardized, adjusted PRS by age for six diseases in MGBB.
Standardized, adjusted PRS (PRSstd-adj) plotted by decade of age among up to 36,423 MGBB participants. Abbreviations: AFib, atrial fibrillation; BrCa, breast cancer; CAD, coronary artery disease; CRCa, colorectal cancer; MGBB, Mass General Brigham Biobank; PrCa, prostate cancer; PRS, polygenic risk score; T2D, type 2 diabetes.
Extended Data Fig. 3
Extended Data Fig. 3. Distribution of adjusted PRS by sex for four diseases in MGBB.
Standardized, adjusted PRS plotted by sex among 16,704 male and 19,719 female MGBB participants. Abbreviations: AFib, atrial fibrillation; BrCa, breast cancer; CAD, coronary artery disease; CRCa, colorectal cancer; MGBB, Mass General Brigham Biobank; PrCa, prostate cancer; PRS, polygenic risk score; T2D, type 2 diabetes.
Extended Data Fig. 4
Extended Data Fig. 4. Correlation between standardized, adjusted PRS and odds of disease in reported white MGBB participants.
Plots show log(odds) of each of six diseases versus quantile (n = 50) of standardized population structure-adjusted PRS (PRSstd-adj) among up to 30,716 MGBB participants of reported white race. The correlation coefficient, r, is shown in each panel. Abbreviations: AFib, atrial fibrillation; BrCa, breast cancer; CAD, coronary artery disease; CRCa, colorectal cancer; MGBB, Mass General Brigham Biobank; OR, odds ratio; PrCa, prostate cancer; PRS, polygenic risk score; T2D, type 2 diabetes.
Extended Data Fig. 5
Extended Data Fig. 5. Correlation between standardized, adjusted PRS and odds of disease in reported Black MGBB participants.
Plots show log(odds) of each of six diseases versus quantile (n = 10) of standardized population structure-adjusted PRS (PRSstd-adj) among up to 1,807 MGBB participants of reported Black race. Results not reported for CRCa due to 0 CRCa cases in at least one quantile. The correlation coefficient, r, is shown in each panel. Abbreviations: AFib, atrial fibrillation; BrCa, breast cancer; CAD, coronary artery disease; CRCa, colorectal cancer; MGBB, Mass General Brigham Biobank; OR, odds ratio; PrCa, prostate cancer; PRS, polygenic risk score; T2D, type 2 diabetes.
Extended Data Fig. 6
Extended Data Fig. 6. Correlation between standardized, adjusted PRS and odds of disease in reported Asian MGBB participants.
Plots show log(odds) of each of six diseases versus quantile (n = 10) of standardized population structure-adjusted PRS (PRSstd-adj) among up to 786 MGBB participants of reported Asian race. Results not reported for CRCa, PrCa, or AFib due to 0 cases in at least one quantile. The correlation coefficient, r, is shown in each panel. Abbreviations: AFib, atrial fibrillation; BrCa, breast cancer; CAD, coronary artery disease; CRCa, colorectal cancer; MGBB, Mass General Brigham Biobank; OR, odds ratio; PrCa, prostate cancer; PRS, polygenic risk score; T2D, type 2 diabetes.
Extended Data Fig. 7
Extended Data Fig. 7. Correlation between standardized, adjusted PRS and odds of disease in MGBB participants of unknown or other reported race.
Plots show log(odds) of each of six diseases versus quantile (n = 50 for T2D, n = 10 for all other disease) of standardized population structure-adjusted PRS (PRSstd-adj) among up to 3,113 MGBB participants of unknown or other reported race. Results not reported for CRCa due to 0 cases in at least one quantile (n = 10). The correlation coefficient, r, is shown in each panel. Abbreviations: AFib, atrial fibrillation; BrCa, breast cancer; CAD, coronary artery disease; CRCa, colorectal cancer; MGBB, Mass General Brigham Biobank; OR, odds ratio; PrCa, prostate cancer; PRS, polygenic risk score; T2D, type 2 diabetes.
Extended Data Fig. 8
Extended Data Fig. 8. Difference in standardized, adjusted PRS between WGS and imputed genotyping arrays for 22 individual samples.
The PRSstd-adj of 22 samples obtained from WGS and from imputed genotyping arrays are subtracted, and the distribution of the difference of the scores is plotted for each disease. Abbreviations: AFib, atrial fibrillation; BrCa, breast cancer; CAD, coronary artery disease; CRCa, colorectal cancer; IMPU, imputed genotype data; MGBB, Mass General Brigham Biobank; PrCa, prostate cancer; PRS, polygenic risk score; T2D, type 2 diabetes; WGS, whole genome sequencing.

References

    1. Shendure J, Findlay GM, Snyder MW. Genomic medicine: progress, pitfalls, and promise. Cell. 2019;177:45–57. doi: 10.1016/j.cell.2019.02.003. - DOI - PMC - PubMed
    1. GWAS Catalog (National Human Genome Research Institute); https://www.ebi.ac.uk/gwas/
    1. Meigs JB, et al. Genotype score in addition to common risk factors for prediction of type 2 diabetes. N. Engl. J. Med. 2008;359:2208–2219. doi: 10.1056/NEJMoa0804742. - DOI - PMC - PubMed
    1. Ripatti S, et al. A multilocus genetic risk score for coronary heart disease: case-control and prospective cohort analyses. Lancet. 2010;376:1393–1400. doi: 10.1016/S0140-6736(10)61267-6. - DOI - PMC - PubMed
    1. Zheng SL, et al. Cumulative association of five genetic variants with prostate cancer. N. Engl. J. Med. 2008;358:910–919. doi: 10.1056/NEJMoa075819. - DOI - PubMed

Publication types