. 2022 Jun;31(12):3374-3388.
doi: 10.1111/mec.16473. Epub 2022 Apr 28.

Experimental sexual selection reveals rapid evolutionary divergence in sex-specific transcriptomes and their interactions following mating

Affiliations

Experimental sexual selection reveals rapid evolutionary divergence in sex-specific transcriptomes and their interactions following mating

Paris Veltsos et al. Mol Ecol. 2022 Jun.

Abstract

Post copulatory interactions between the sexes in internally fertilizing species elicits both sexual conflict and sexual selection. Macroevolutionary and comparative studies have linked these processes to rapid transcriptomic evolution in sex-specific tissues and substantial transcriptomic post mating responses in females, patterns of which are altered when mating between reproductively isolated species. Here, we tested multiple predictions arising from sexual selection and conflict theory about the evolution of sex-specific and tissue-specific gene expression and the post mating response at the microevolutionary level. Following over 150 generations of experimental evolution under either reduced (enforced monogamy) or elevated (polyandry) sexual selection in Drosophila pseudoobscura, we found a substantial effect of sexual selection treatment on transcriptomic divergence in virgin male and female reproductive tissues (testes, male accessory glands, the female reproductive tract and ovaries). Sexual selection treatment also had a dominant effect on the post mating response, particularly in the female reproductive tract - the main arena for sexual conflict - compared to ovaries. This effect was asymmetric with monandry females typically showing more post mating responses than polyandry females, with enriched gene functions varying across treatments. The evolutionary history of the male partner had a larger effect on the post mating response of monandry females, but females from both sexual selection treatments showed unique patterns of gene expression and gene function when mating with males from the alternate treatment. Our microevolutionary results mostly confirm comparative macroevolutionary predictions on the role of sexual selection on transcriptomic divergence and altered gene regulation arising from divergent coevolutionary trajectories between sexual selection treatments.

Keywords: Sfps; ejaculate-female interactions; experimental evolution; female post mating response; reproduction; reproductive isolation; sexual conflict.


Conflict of interest statement

The authors declare that they have no conflict of interest.

Figures

FIGURE 1
FIGURE 1
Differential gene expression (absolute log2FC changes, y‐axis) in virgin (a) male or (b) female tissues comparing responses of upregulated genes in either polyandry (E: light grey) or monandry (M: dark grey) selection treatments. Dots indicate differentially expressed (DE) genes and their number is noted above each box
FIGURE 2
FIGURE 2
Effect of sexual selection on expression of genes coding for (a) all and (b) differentially expressed male accessory gland genes between polyandry (positive x‐axis values) and monandry (negative x‐axis values) treatments. Line colours in a) differentiate between all accessory gland genes (black) or those categorized as proteome (red), secretome (green) or seminal fluid proteins (blue) based on Karr et al. (2019). The number of genes is indicated in the (a) parentheses and (b) above the boxes. Bar colours (b) differentiate the number (dots) and magnitude of absolute gene expression changes (y‐axis) for all differentially expressed (DE) male accessory gland genes (All RNAseq; grey) or for the DE accessory gland proteome genes (Proteome; coloured) showing either elevated expression in E (light grey or pink) or M (dark grey or red) males. NB: secretome and SFP genes were not DE [Colour figure can be viewed at wileyonlinelibrary.com]
FIGURE 3
FIGURE 3
Post mating gene expression (log2FC) responses and enriched gene ontology (GO) biological process (BP) terms in female reproductive tissues for (a) differentially expressed (DE) genes in female reproductive tracts (FRT), (b) BP term enrichment for significant factors, and (c) DE genes in ovaries. DE genes are indicated with blue triangles for the main effect of mating status, yellow diamonds for the main effect of sexual selection treatment and green crosses for the interaction between the two. In (a) the axes show the coevolved post mating response for each sexual selection treatment, which allows visualisation of the interaction between sexual selection treatment and mating as the diagonal on which the green crosses fall. In (c) the axes represent the two main effects (note change in scale), as there were no significant interaction effects. The number of DE genes is indicated in parentheses. See Table 1 for statistics [Colour figure can be viewed at wileyonlinelibrary.com]
FIGURE 4
FIGURE 4
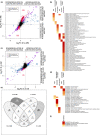
Post mating responses of differentially expressed (DE) genes (log2FC) in the female reproductive tracts (FRT) of (a) monogamy and (c) polyandry females when mated to males either from the same sexual selection treatment or the opposite treatment. Genes are categorized as being DE only in coevolved mating (blue +), only in noncoevolved mating (red x) or regardless of male treatment (purple o). In each plot, the x‐axis represents is the coevolved post mating response and the y‐axis the noncoevolved post mating response with negative values representing virgin‐biased genes and positive values representing mating‐biased. The coloured numbers within the plots are the number of DE genes for each gene category. (b) and (d) Represent the associated gene ontology (GO) biological process (BP) enrichment of the DE genes of panels (a) and (c), respectively. (e) Shows the overlap of genes corresponding to coevolved and noncoevolved mating separately in monogamy and polyandry females, and (f) shows the GO BP enrichment of the 32 consistently DE genes all (e) contrasts [Colour figure can be viewed at wileyonlinelibrary.com]

References

    1. Ahmed‐Braimah, Y. H. , Unckless, R. L. , & Clark, A. G. (2017). Evolutionary dynamics of male reproductive genes in the Drosophila virilis subgroup. G3 (Bethesda), 7, 3145–3155. - PMC - PubMed
    1. Ahmed‐Braimah, Y. H. , Wolfner, M. F. , & Clark, A. G. (2020). Differences in post‐mating transcriptional responses between conspecific and heterospecific matings in Drosophila . Molecular Biology and Evolution, 38, 986–999. - PMC - PubMed
    1. Alexa, A. , & Rahnenfuhrer, J. (2010). topGO: enrichment analysis for gene ontology. R package version 2.
    1. Anders, S. , Pyl, P. T. , & Huber, W. (2015). HTSeq‐a Python framework to work with high‐throughput sequencing data. Bioinformatics, 31, 166–169. 10.1093/bioinformatics/btu638 - DOI - PMC - PubMed
    1. Anderson, W. W. (1974). Frequent multiple insemination in a natural population of Drosophila pseudoobscura . The American Naturalist, 108, 709–711. 10.1086/282949 - DOI

Publication types

LinkOut - more resources