

Nanobodies dismantle post-pyroptotic ASC specks and counteract inflammation in vivo
- PMID: 35438238
- PMCID: PMC9174887
- DOI: 10.15252/emmm.202115415
Nanobodies dismantle post-pyroptotic ASC specks and counteract inflammation in vivo
Abstract
Inflammasomes sense intracellular clues of infection, damage, or metabolic imbalances. Activated inflammasome sensors polymerize the adaptor ASC into micron-sized "specks" to maximize caspase-1 activation and the maturation of IL-1 cytokines. Caspase-1 also drives pyroptosis, a lytic cell death characterized by leakage of intracellular content to the extracellular space. ASC specks are released among cytosolic content, and accumulate in tissues of patients with chronic inflammation. However, if extracellular ASC specks contribute to disease, or are merely inert remnants of cell death remains unknown. Here, we show that camelid-derived nanobodies against ASC (VHHASC ) target and disassemble post-pyroptotic inflammasomes, neutralizing their prionoid, and inflammatory functions. Notably, pyroptosis-driven membrane perforation and exposure of ASC specks to the extracellular environment allowed VHHASC to target inflammasomes while preserving pre-pyroptotic IL-1β release, essential to host defense. Systemically administrated mouse-specific VHHASC attenuated inflammation and clinical gout, and antigen-induced arthritis disease. Hence, VHHASC neutralized post-pyroptotic inflammasomes revealing a previously unappreciated role for these complexes in disease. VHHASC are the first biologicals that disassemble pre-formed inflammasomes while preserving their functions in host defense.
Keywords: arthritis; extracellular inflammasomes; gout; nanobodies; pyroptosis.
© 2022 The Authors. Published under the terms of the CC BY 4.0 license.
Figures
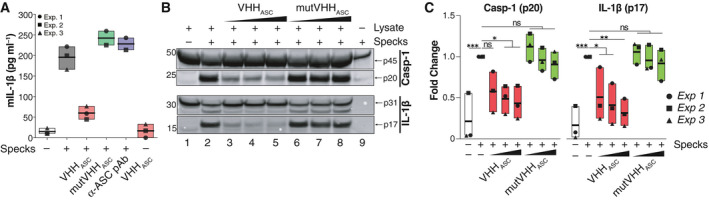
Mouse IL‐1β (mIL‐1β) concentrations in cell‐free supernatants of LPS‐primed BMDMs (200 ng ml−1, for 2 h), that were stimulated with in vitro‐generated human ASC specks (200 µg ml−1, O/N). ASC specks were pre‐incubated with 200 µg ml−1 of an anti‐human ASC nanobody (VHHASC), its mutated variant, mutVHHASC or 50 µg ml−1 of polyclonal ASC antibody (a‐ASC pAb, AL177) for 15 min at RT. Data is pooled from at least two independent experiments, each represented by a different symbol, and is displayed as floating bars with the max/min values and mean (thicker band).
Immunoblot analysis of pro‐ (p31) and cleaved (p17) IL‐1β, and pro‐ (p45) and cleaved (p20) caspase‐1 in cytosolic fractions of ASC deficient (Pycard −/−) immortalized murine macrophages that were primed with LPS (200 ng ml−1, for 3 h). Fractions were incubated with recombinant ASC specks in the presence of 2, 20 or 200 µg ml−1 of VHHASC or mutVHHASC. One representative of three independent experiments is shown.
Quantitative analysis of band densitometry of three independent experiments as shown in B. Data represents the fold change from all conditions (lanes 1–9) vs. Pycard −/− lysates incubated with ASC specks alone (lane 2). ns P > 0.05; *P < 0.05; **P < 0.005; ***P < 0.0002, One‐way ANOVA, multiple comparison (Dunnet test). Data is displayed as floating bars with the max/min values and mean (thicker band).
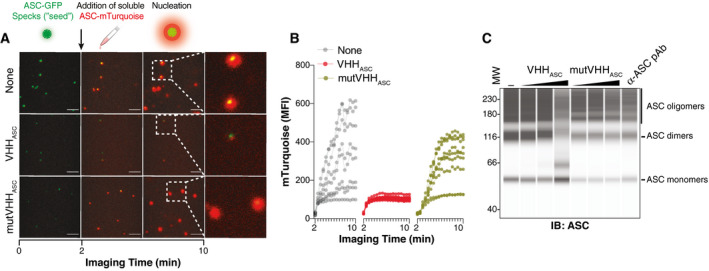
Time‐lapse confocal imaging of the in vitro nucleation of soluble ASC‐mTurquoise (red) by ASC‐TagGFP (ASC‐GFP) specks (green), that were left untreated (None), or pre‐incubated with VHHASC or mutVHHASC (200 µg ml−1 for 15 min). Scale bars: 10 μm.
Median fluorescence intensity (MFI) of mTurquoise graphed over time showing its polymerization seeded by ASC‐TagGFP specks. Each line shows the mTurquoise MFI around a seeding ASC‐TagGFP speck. Data is one representative of three independent experiments.
WES capillary electrophoresis and immunoblotting of DSS cross‐linked in‐vitro‐generated human ASC‐mTurquoise (ASC) specks that were incubated for 1 h (RT) with 2, 20 or 200 µg ml−1 of VHHASC, mutVHHASC or with 20 µg ml−1 of a polyclonal anti‐ASC Ab (a‐ASC pAb). Data is from one representative of four independent experiments.
- A–D
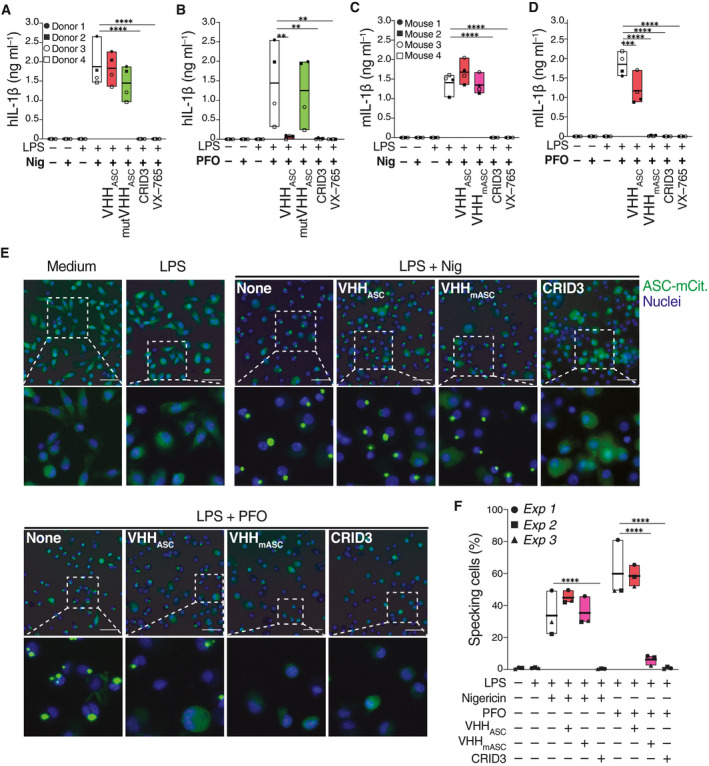
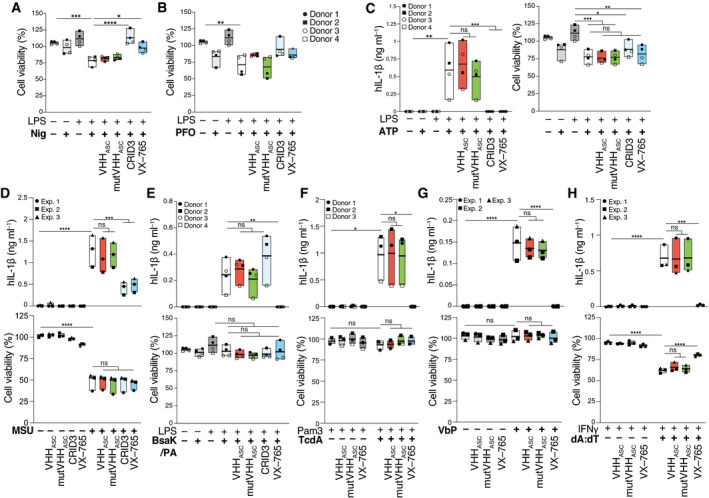
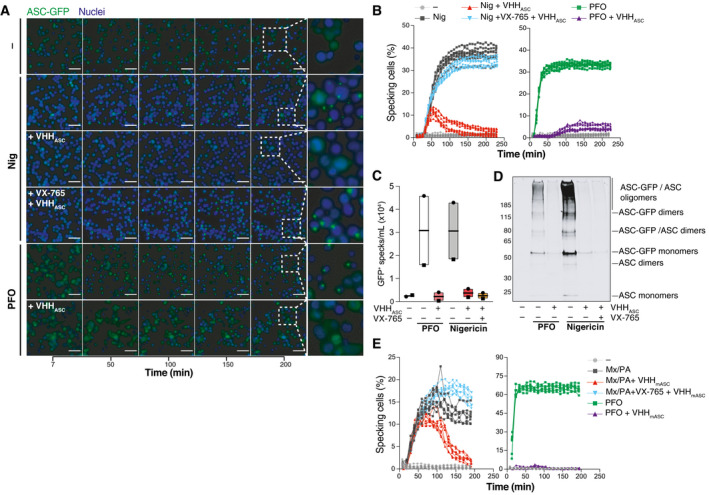
(A, B) Human IL‐1β (hIL‐1β) concentrations in cell‐free supernatants of LPS‐primed (10 ng ml−1, 150 min) primary human macrophages that were left untreated, or pre‐incubated with VHHASC or mutVHHASC (100 µg ml−1), CRID3 (50 µM) or VX‐765 (50 µM) for 30 min before stimulation with (A) nigericin (10 µM), or (B) PFO (30 ng ml−1) for 2 h. (C‐D) Mouse IL‐1β (mIL‐1β) concentrations in cell‐free supernatants of LPS‐primed mouse BMDMs (200 ng ml−1, 150 min), incubated with VHHs, CRID3 or VX765, before activation with nigericin (10 µM), or PFO (250 ng ml−1). Data is combined from two independent experiments, each performed with two donors (A, B) or mice (C, D), represented with individual symbols (4 donors or mice in total). Data is displayed as floating bars with the max/min values and mean (thicker band).
- E, F
(E) Epifluorescence microscopy imaging and (F) quantification of ASC speck formation in BMDMs from ASC‐mCitrine (Green) transgenic mice. Cells were primed with LPS (200 ng ml−1, 150 min), pre‐treated with VX‐765 (50 µM, 30 min), then treated with VHHASC, VHHmASC (100 µg ml−1) or CRID3 (50 µM) for another 30 min before stimulation with nigericin (top), or PFO (bottom) for 2 h and finally fixed with 4% PFA. Nuclei was stained with DRAQ5 (Blue). Scale bars: 100 μm. Images in (E) are from one representative out of three independent experiments that were quantified in F. Data in F is displayed as floating bars with the max/min values and mean (thicker band).
- A, B
Cell viability (CTB) assay on LPS‐primed primary human macrophages that were left untreated, or pre‐incubated with VHHASC or mutVHHASC (100 µg ml−1), CRID3 (50 µM) or VX‐765 (50 µM) for 30 min before being activated with (A) nigericin (10 µM), or (B) PFO (30 ng ml−1) for 2 h. Data is from the experiments displayed in Fig 3A and B.
- C
Human IL‐1β (hIL‐1β) concentrations in cell‐free supernatants (left), and cell viability assay (right) of LPS‐primed primary human macrophages that were incubated with VHHASC or mutVHHASC (100 µg ml−1), CRID3 (50 µM) or VX‐765 (50 µM) for 30 min before being stimulated with 2.5 mM ATP.
- D
hIL‐1β concentrations in cell‐free supernatants (top), and cell viability assay (bottom) of PMA‐differentiated THP‐1 cells treated with VHHASC or mutVHHASC (100 µg ml−1), CRID3 (10 µM) or VX‐765 (50 µM) for 30 min before 4.5 h stimulation with 250 µg ml−1 MSU crystals.
- E
hIL‐1β concentrations in cell‐free supernatants (top), and cell viability assay (bottom) of LPS‐primed primary human macrophages that were incubated with VHHASC or mutVHHASC (100 µg ml−1), CRID3 (50 µM) or VX‐765 (50 µM) for 30 min before being stimulated with 0.1 µg ml−1/0.5 µg ml−1 mixture of LFn‐BsaK and PA for 2 h.
- F
hIL‐1β concentrations in cell‐free supernatants (top), and cell viability assay (bottom) of Pam3CysK4‐primed (1 µg ml−1) primary human CD14+ monocytes that were incubated with VHHASC or mutVHHASC (100 µg ml−1), or VX‐765 (50 µM) for 30 min before being stimulated with 1 µg ml−1 TcdA.
- G
hIL‐1β concentrations in cell‐free supernatants (top), and cell viability assay (bottom) of keratinocyte cells (N‐TERT) that were treated with VHHASC or mutVHHASC (100 µg ml−1), or VX‐765 (50 µM), then directly stimulated with 30 µM Val‐boroPro (VbP) for 22 h.
- H
hIL‐1β concentrations in cell‐free supernatants (top), and cell viability assay (bottom) of PMA‐differentiated THP‐1 cells treated with IFNγ (500 U ml−1) for 16 h and that were incubated with VHHASC or mutVHHASC (100 µg ml−1), CRID3 (10 µM) or VX‐765 (50 µM) for 30 min before 2 h stimulation with 1 µg ml−1 poly(dA:dT) in complex with Lipofectamine 2000.
- A
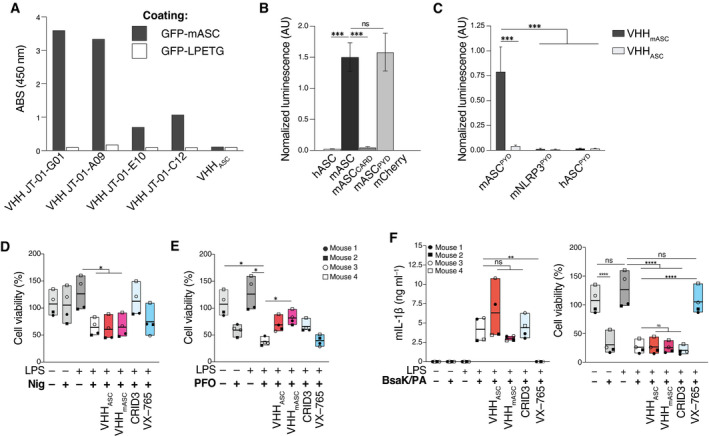
Specificity of different single‐domain antibodies (VHHs) probed by ELISA. Recombinant murine ASC as an eGFP fusion or eGFP alone (GFP‐LPETG) as control, were coated onto ELISA plates at 1 µg ml−1/well. Wells were incubated with HA‐tagged VHHs (100 nM), anti‐HA‐tag mouse mAb coupled to HRP, and the HRP substrate TMB. Binding was quantified by measuring the absorbance at 450 nm.
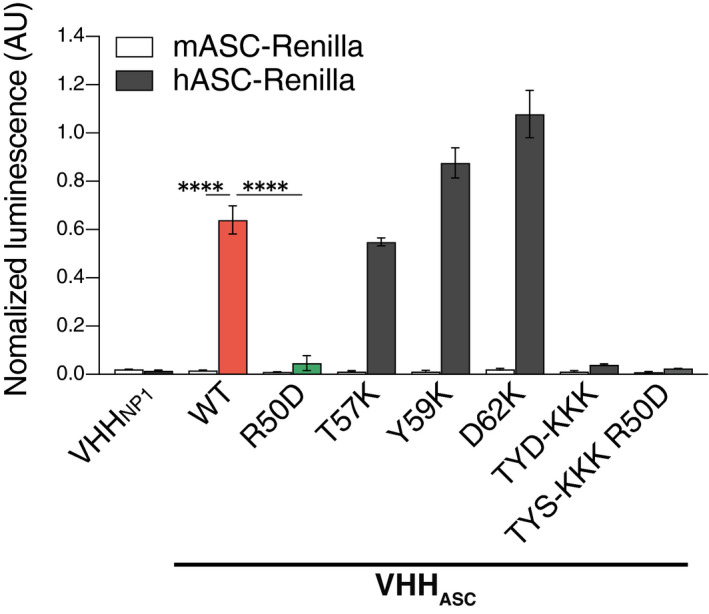
- B, C
Lysates of HEK 293T cells transiently expressing HA‐tagged VHHmASC or VHHASC and the indicated bait proteins fused to Renilla luciferase were used to immunoprecipitate VHHs with immobilized anti‐HA antibody. Renilla luciferase activity of the co‐immunoprecipitated proteins was measured and normalized to the input luciferase. Data represents mean values ± SEM from three independent experiments.
- D, E
Cell viability (CTB) assay on LPS‐primed (200 ng ml−1) primary mouse BMDMs that were left untreated, or pre‐incubated with VHHASC or VHHmASC (100 µg ml−1), CRID3 (50 µM) or VX‐765 (50 µM) for 30 min before being activated with (D) nigericin (10 µM), or (E) PFO (250 ng ml−1) for 2 h. Data is from the experiments displayed in Fig 3C and D. Data is displayed as floating bars with the max/min values and mean (thicker band).
- F
Mouse IL‐1β (mIL‐1β) concentrations in cell‐free supernatants (left), and cell viability assay (right) of LPS‐primed mouse BMDMs incubated with VHHs, CRID3 or VX–765, before stimulation with 0.1 µg ml−1/0.5 µg ml−1 mixture of LFn‐BsaK and PA for 2 h. Each symbol represents one mouse. Data is displayed as floating bars with the max/min values and mean (thicker band).
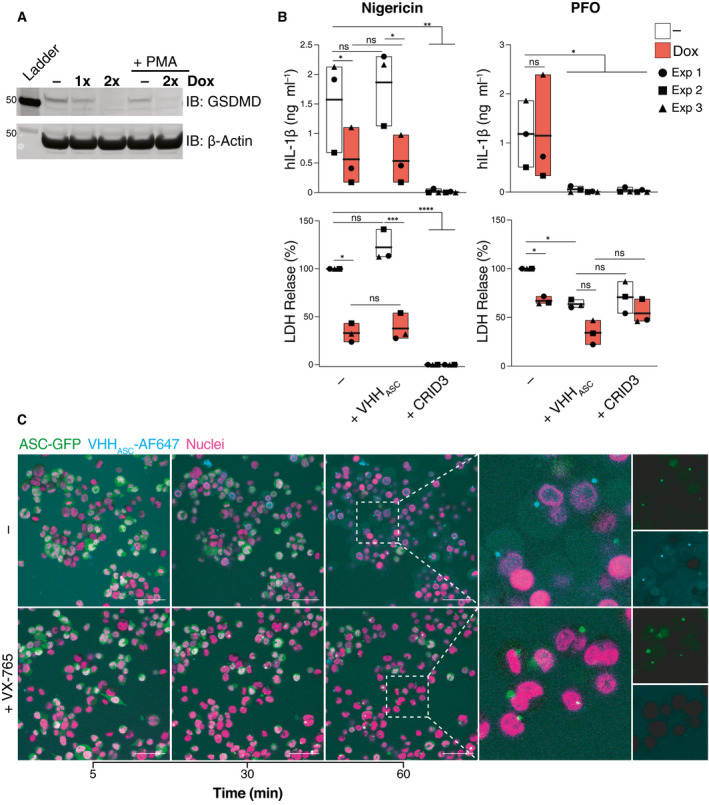
Immunoblot analysis of GSDMD expression following the indicated course of Dox treatment and PMA‐differentiation, as indicated. Data is from one representative of two independent experiments.
IL‐1β concentration or percentage of LDH released into cell‐free supernatants of PMA‐differentiated THP‐1 cells that were treated with VHHASC (200 µg ml−1) or CRID3 (25 µM) for 30 min prior to stimulation with nigericin (10 µM, left panels) or PFO (30 ng ml−1, right panels) for 2 h. Data is average of experimental duplicates from three independent experiments, each represented by a different symbol. ns P > 0.05; *P < 0.05; **P < 0.01; ***P < 0.001; ****P < 0.0001, Two‐way ANOVA, multiple comparison (Tukey test). Data is displayed as floating bars with the max/min values and mean (thicker band).
Live confocal imaging of PMA‐differentiated and nigericin‐treated (10 µM) THP‐1 cells expressing human ASC‐GFP (green) in the presence of AlexaFluor647‐labeled VHHASC (VHHASC‐AF647, 10 µg ml−1, cyan) in the medium. Cells were either left untreated (–) or incubated with VX‐765 (50 µM) for 1 h prior to nigericin stimulation. Nuclei were stained with Hoechst 34580 (magenta). Scale bar: 50 µm. Data is from one representative out of two independent experiments.
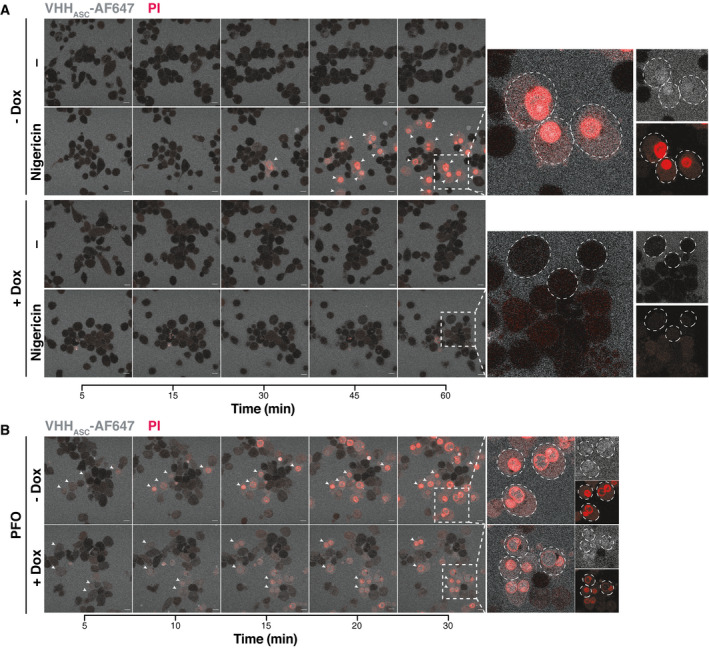
- A, B
Confocal microscopy images of GSDMD competent (–Dox) or GSDMD‐KO (+Dox) cells primed with PMA and that were either left untreated or treated with (A) nigericin (10 µM) or (B) PFO (30 ng ml−1) for the indicated periods of time and in the presence of AlexaFluor647‐labeled VHHASC (VHHASC‐AF647, 10 µg ml−1, blue) and propidium iodide (PI, 3.33 µg ml−1, red). White arrows indicate of cells with intracellular VHHASC‐AF647 signal. Dashed circles define boundaries of representative cells. Data is from one representative out of three independent experiments. Scale bar: 10 µm. Also see Movie EV1.
- A
Wide‐field fluorescence microscopy imaging of live PMA‐differentiated and nigericin‐ (10 µM, top) or PFO‐activated (25 ng ml−1, bottom) THP‐1 expressing human ASC‐GFP. Cells were incubated with VHHASC (200 µg ml−1) alone or in the presence of the caspase‐1 inhibitor VX‐765 (50 µM). Nuclei were stained with DRAQ5 (blue). Cells were imaged live with a CellDiscoverer 7 microscope. For each condition, a total of 8 positions within 2 wells (2 × 4 images/well) were imaged. Data is maximal intensity projections from Z‐stacks. Scale bars: 50 µm. See also Movie EV2.
- B
Graphic representation of the percent of specking cells over time. Maximal intensity projections from Z‐stacks were generated for each image set before the number of cells and specks per field were calculated using CellProfiler. (A) represents images from one experiment out of three independent experiments of which percentage of specking cells data is represented in (B) with each line representing one field‐of‐view.
- C, D
(C) Flow cytometry quantification, and (D) immunoblotting analysis of ASC‐GFP oligomers (DSS cross‐linked) in extracellular specks recovered from supernatants of cells treated as in A. Data in (C) is from two independent experiments (each represented by a different symbol). And in (D) is from one out of at least two independent experiments. Data is displayed as floating bars with the max/min values and mean (thicker band).
- E
Mouse BMDMs expressing ASC‐mCitrin and primed with LPS (200 ng ml−1) for 3 h were pre‐treated with VHHmASC (200 µg ml−1) alone or in the presence of the caspase‐1 inhibitor VX‐765 (50 µM) for 30 min. Cells were then treated with a mixture of LFn‐MxiH and PA (Mx/PA, 100 ng ml−1/1 µg ml−1) or PFO (250 ng ml−1) and imaged as in (A) for 3 h. Data is a graphic representation of specking cells over time calculated as in (B). Data is from one experiment out of three independent experiments. See also Movie EV6.

PMA‐differentiated (50 ng ml−1) THP‐1 ASC‐GFP cells were treated with IFNγ (500 U ml−1) for 16 h. Then, cells were pre‐incubated with VHHASC (100 µg ml−1), or VX‐765 (50 µM) for 30 min before being activated with poly(dA:dT) (dA:dT, 1 µg ml−1) and imaged live with a CellDiscoverer 7 microscope as described in Fig 4 over 3 h. Data is a graphic representation of the percent of specking cells over time. Maximal intensity projections from Z‐stacks were generated for each image set (8 images per condition) before the number of cells and specks per field were calculated using CellProfiler. Also see Movie EV3.
Flow cytometric quantification (left), or western‐blot (right, following DSS cross‐linking) assessement of GFP+ specks in the supernatants of cells pre‐treated with VHHASC or VX‐765 and then activated with poly(dA:dT) for 3.5 h. Data in left panel is displayed as floating bars with the max/min values and mean (thicker band).
Flow cytometric quantification or western‐blotting of GFP+ specks released by PMA‐differentiated THP‐1 ASC‐GFP cells pre‐incubated with VHHASC (100 µg ml−1), or VX‐765 (50 µM) for 30 min before stimulation with LFn‐MxiH/PA (100 ng ml−1/1 µg ml−1) for 3 h and imaged live with a CellDiscoverer 7 microscope. Also see Movie EV4.
GFP+ specks detected by flow cytometry (left) or western‐blot (right, following DSS cross‐linking) in the supernatants of cells pre‐treated with VHHASC or VX‐765 and then activated with LFn‐MxiH/PA for 3.5 h. Data in left panel is displayed as floating bars with the max/min values and mean (thicker band).
PMA‐differentiated THP‐1 ASC‐GFP cells were pre‐incubated with VHHASC (100 µg ml−1), or VX‐765 (50 µM) for 30 min before stimulation with MSU crystals (250 µg ml−1) for 4.5 h and imaged live with a CellDiscoverer 7 microscope. Imaging and quantifications were done as in (A). Also see Movie EV5.
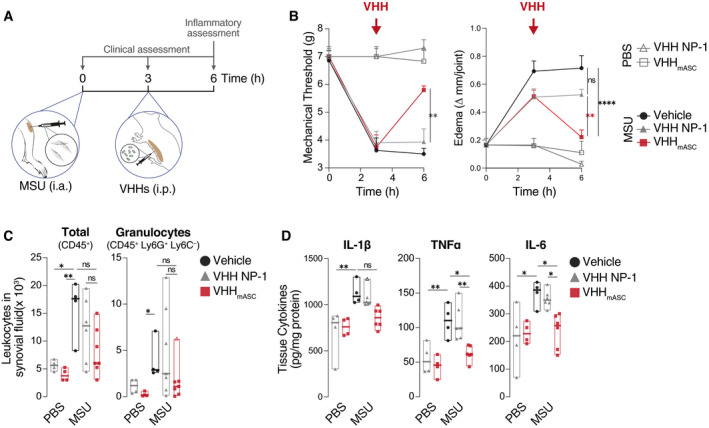
Schematic representation of the experimental setting used for the MSU‐gout model. Mice were injected i.a with 100 µg of monosodium urate (MSU) crystals into the knee. After 3 h, mice were treated intraperitonially (i.p.) with VHHmASC, VHH NP‐1 as unrelated nanobody (both 5 mg kg−1), or vehicle (PBS).
Mechanical allodynia threshold and edema were evaluated at 3 and 6 h post‐MSU challenge. Error bars represent SEM from biological replicates: t0, n = 3 for all groups; t3 and t6: PBS + VHH NP‐1 and PBS + VHHmASC, n = 3 (Mechanical threshold) or n = 4 (Edema); MSU + Vehicle, n = 4; MSU + VHH NP‐1, n = 7; MSU + VHHmASC, n = 7.
Flow cytometric assessment of infiltrating total leukocytes (CD45+) and granulocytes (CD45+ Ly6G+ Ly6C−) recovered in the synovial fluid of the knee joints of mice treated as in (A). Data in (C) is displayed as floating bars with the max/min values and mean (thicker band). Biological replicates are: PBS + VHH NP‐1, n = 4; PBS + VHHmASC, n = 4; MSU + Vehicle, n = 4; MSU + VHH NP‐1, n = 7; MSU + VHHmASC, n = 7.
ELISA of IL‐1β, TNFα and IL‐6 in tissue homogenates of knee joints of mice treated as in (A). Data in (C) is displayed as floating bars with the max/min values and mean (thicker band). Biological replicates are PBS + VHH NP‐1, n = 4; PBS + VHHmASC, n = 4; MSU + Vehicle, n = 4; MSU + VHH NP‐1, n = 7; MSU + VHHmASC, n = 7.
- A
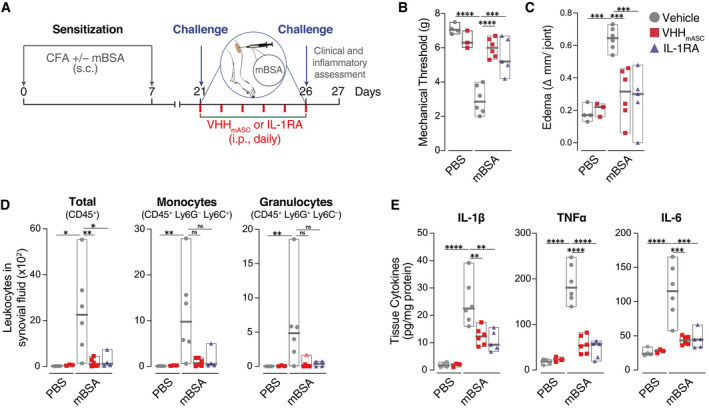
Schematic representation of the experimental setting used for the mBSA‐induced arthritis model. Mice were injected sub‐cutaneously (s.c.) with mBSA (500 µg/animal) in an emulsion containing 1 mg ml−1 Freund’s adjuvant on day 0 and day 7. Control mice received injections lacking mBSA. Mice were then immunized with an intra‐articular injection of mBSA (100 µg, right knee) on days 21 and 26. From day 21 until day 26, mice were treated daily with an intra‐peritoneal (i.p.) injection of VHHmASC (5 mg kg−1), IL‐1RA (50 µg kg−1), or vehicle (PBS).
- B, C
Mechanical allodynia threshold (B) and edema (C) were evaluated on day 27. Data is displayed as floating bars with the max/min values and mean (thicker band). Biological replicates are: PBS + Vehicle, n = 4; PBS + VHHmASC, n = 3; mBSA + Vehicle, n = 6; mBSA + VHHmASC, n = 6; mBSA + IL‐1RA, n = 5.
- D
Flow cytometric assessment of infiltrating total leukocytes (CD45+), granulocytes (CD45+ Ly6G+ Ly6C−), and inflammatory monocytes (CD45+ Ly6G− Ly6C+) recovered in the synoival fluid of the knee joints of mice treated as in (A). Data is displayed as floating bars with the max/min values and mean (thicker band). Biological replicates are: PBS + Vehicle, n = 4; PBS + VHHmASC, n = 3; mBSA + Vehicle, n = 6; mBSA + VHHmASC, n = 6; mBSA + IL‐1RA, n = 5.
- E
ELISA of IL‐1β, TNFα and IL‐6 in tissue homogenates of knee joints of mice treated as in (A). Data is displayed as floating bars with the max/min values and mean (thicker band). Biological replicates are: PBS + Vehicle, n = 4; PBS + VHHmASC, n = 3; mBSA + Vehicle, n = 6; mBSA + VHHmASC, n = 6; mBSA + IL‐1RA, n = 5.
References
-
- Ahmad F, Mishra N, Ahrenstorf G, Franklin BS, Latz E, Schmidt RE, Bossaller L (2018) Evidence of inflammasome activation and formation of monocyte‐derived ASC specks in HIV‐1 positive patients. AIDS 32: 299–307 - PubMed
-
- Ashour J, Schmidt FI, Hanke L, Cragnolini J, Cavallari M, Altenburg A, Brewer R, Ingram J, Shoemaker C, Ploegh HL (2015) Intracellular expression of camelid single‐domain antibodies specific for influenza virus nucleoprotein uncovers distinct features of its nuclear localization. J Virol 89: 2792–2800 - PMC - PubMed
-
- Baroja‐Mazo A, Martín‐Sánchez F, Gomez AI, Martínez CM, Amores‐Iniesta J, Compan V, Barberà‐Cremades M, Yagüe J, Ruiz‐Ortiz E, Antón J et al (2014) The NLRP3 inflammasome is released as a particulate danger signal that amplifies the inflammatory response. Nat Immunol 15: 738–748 - PubMed
-
- Basiorka AA, McGraw KL, Abbas‐Aghababazadeh F, McLemore AF, Vincelette ND, Ward GA, Eksioglu EA, Sallman DA, Ali NA, Padron E et al (2018) Assessment of ASC specks as a putative biomarker of pyroptosis in myelodysplastic syndromes: an observational cohort study. Lancet Haematol 5: e393–e402 - PMC - PubMed
-
- Ben H (2019) Novartis bets $1.6bn on inflammasome‐focused biotech. Outsourcing‐Pharma https://www.outsourcing‐pharma.com/Article/2019/04/01/Novartis‐acquires‐...
Publication types
MeSH terms
Substances
LinkOut - more resources
Full Text Sources
Other Literature Sources
Miscellaneous
