

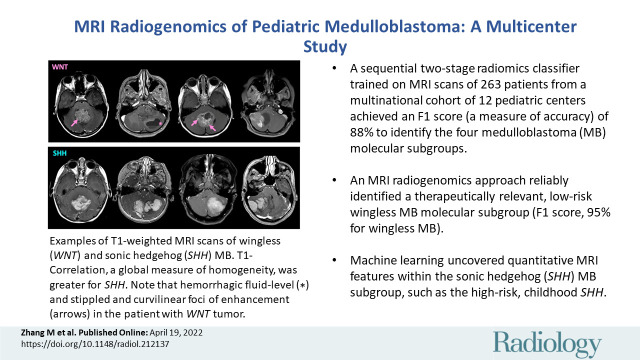
MRI Radiogenomics of Pediatric Medulloblastoma: A Multicenter Study
- PMID: 35438562
- PMCID: PMC9340239
- DOI: 10.1148/radiol.212137
MRI Radiogenomics of Pediatric Medulloblastoma: A Multicenter Study
Abstract
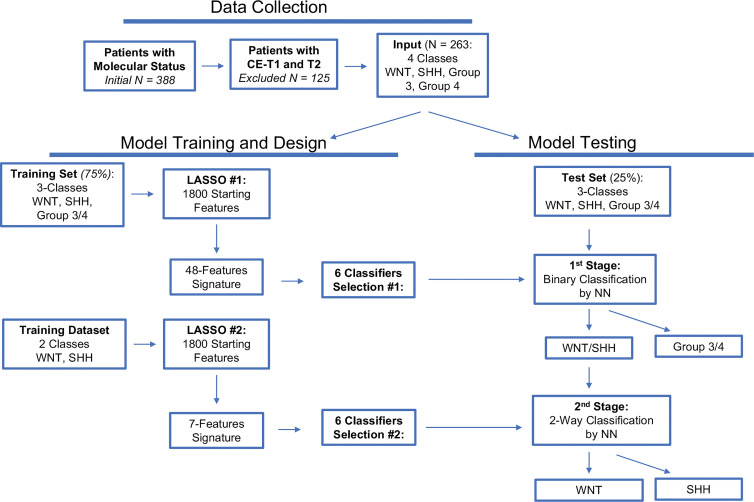
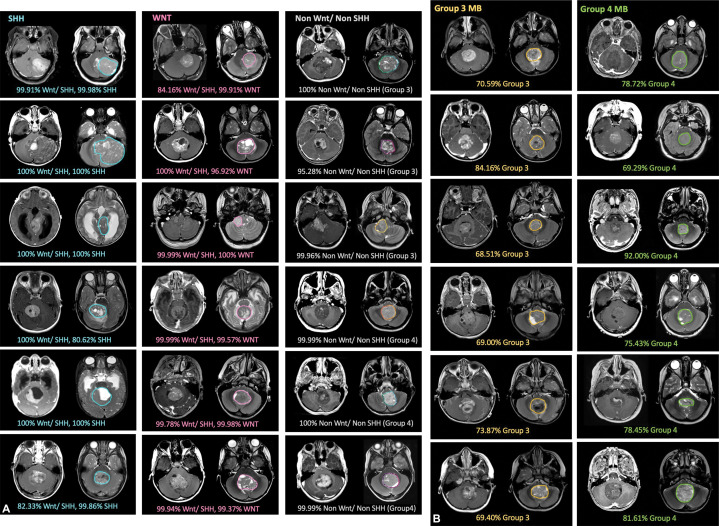
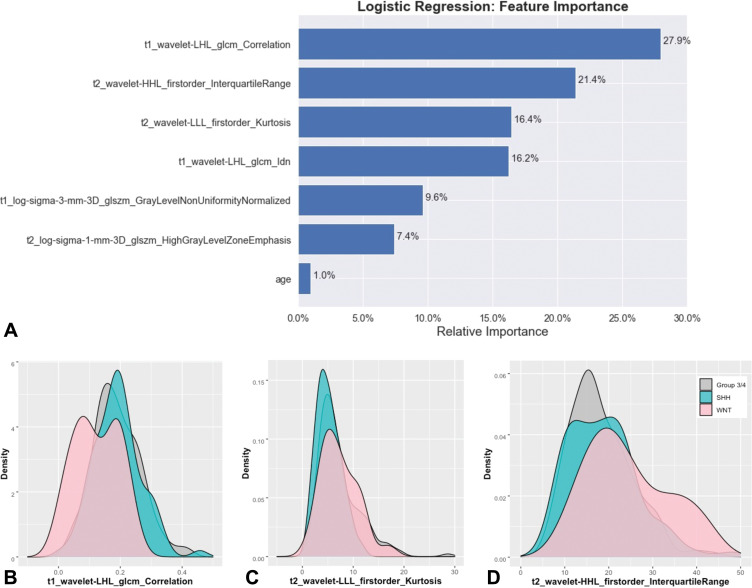
Background Radiogenomics of pediatric medulloblastoma (MB) offers an opportunity for MB risk stratification, which may aid therapeutic decision making, family counseling, and selection of patient groups suitable for targeted genetic analysis. Purpose To develop machine learning strategies that identify the four clinically significant MB molecular subgroups. Materials and Methods In this retrospective study, consecutive pediatric patients with newly diagnosed MB at MRI at 12 international pediatric sites between July 1997 and May 2020 were identified. There were 1800 features extracted from T2- and contrast-enhanced T1-weighted preoperative MRI scans. A two-stage sequential classifier was designed-one that first identifies non-wingless (WNT) and non-sonic hedgehog (SHH) MB and then differentiates therapeutically relevant WNT from SHH. Further, a classifier that distinguishes high-risk group 3 from group 4 MB was developed. An independent, binary subgroup analysis was conducted to uncover radiomics features unique to infantile versus childhood SHH subgroups. The best-performing models from six candidate classifiers were selected, and performance was measured on holdout test sets. CIs were obtained by bootstrapping the test sets for 2000 random samples. Model accuracy score was compared with the no-information rate using the Wald test. Results The study cohort comprised 263 patients (mean age ± SD at diagnosis, 87 months ± 60; 166 boys). A two-stage classifier outperformed a single-stage multiclass classifier. The combined, sequential classifier achieved a microaveraged F1 score of 88% and a binary F1 score of 95% specifically for WNT. A group 3 versus group 4 classifier achieved an area under the receiver operating characteristic curve of 98%. Of the Image Biomarker Standardization Initiative features, texture and first-order intensity features were most contributory across the molecular subgroups. Conclusion An MRI-based machine learning decision path allowed identification of the four clinically relevant molecular pediatric medulloblastoma subgroups. © RSNA, 2022 Online supplemental material is available for this article. See also the editorial by Chaudhary and Bapuraj in this issue.
Conflict of interest statement
Figures
Comment in
-
Radiogenomics for Pediatric Medulloblastoma to Predict Tumor Subtypes and Guide Therapy.Radiology. 2022 Aug;304(2):417-418. doi: 10.1148/radiol.213165. Epub 2022 Apr 19. Radiology. 2022. PMID: 35438567 No abstract available.
References
-
- Das D , Mahanta LB , Ahmed S , Baishya BK . Classification of childhood medulloblastoma into WHO-defined multiple subtypes based on textural analysis . J Microsc 2020. ; 279 ( 1 ): 26 – 38 . - PubMed
Publication types
MeSH terms
Substances
Grants and funding
LinkOut - more resources
Full Text Sources
Medical
Miscellaneous
