

Phase II Clinical and Translational Study of Everolimus ± Paclitaxel as First-Line Therapy in Cisplatin-Ineligible Advanced Urothelial Carcinoma
- PMID: 35438782
- PMCID: PMC9177111
- DOI: 10.1093/oncolo/oyab075
Phase II Clinical and Translational Study of Everolimus ± Paclitaxel as First-Line Therapy in Cisplatin-Ineligible Advanced Urothelial Carcinoma
Abstract
Background: Treatment options have been historically limited for cisplatin-ineligible patients with advanced urothelial carcinoma (UC). Given the need for alternatives to platinum-based chemotherapy, including non-chemotherapy regimens for patients with both impaired renal function and borderline functional status, in 2010 (prior to the immune checkpoint blockade era in metastatic UC), we initiated a phase II trial to test the activity of everolimus or everolimus plus paclitaxel in the cisplatin-ineligible setting.
Methods: This was an open-label phase II trial conducted within the US-based Hoosier Cancer Research Network (ClinicalTrials.gov number: NCT01215136). Patients who were cisplatin-ineligible with previously untreated advanced UC were enrolled. Patients with both impaired renal function and poor performance status were enrolled into cohort 1; patients with either were enrolled into cohort 2. Patients received everolimus 10 mg daily alone (cohort 1) or with paclitaxel 80 mg/m2 on days 1, 8, and 15 of each 28-day cycle (cohort 2). The primary outcome was clinical benefit at 4 months. Secondary outcomes were adverse events, progression-free survival (PFS), and 1-year overall survival (OS). Exploratory endpoints included genomic correlates of outcomes. The trial was not designed for comparison between cohorts.
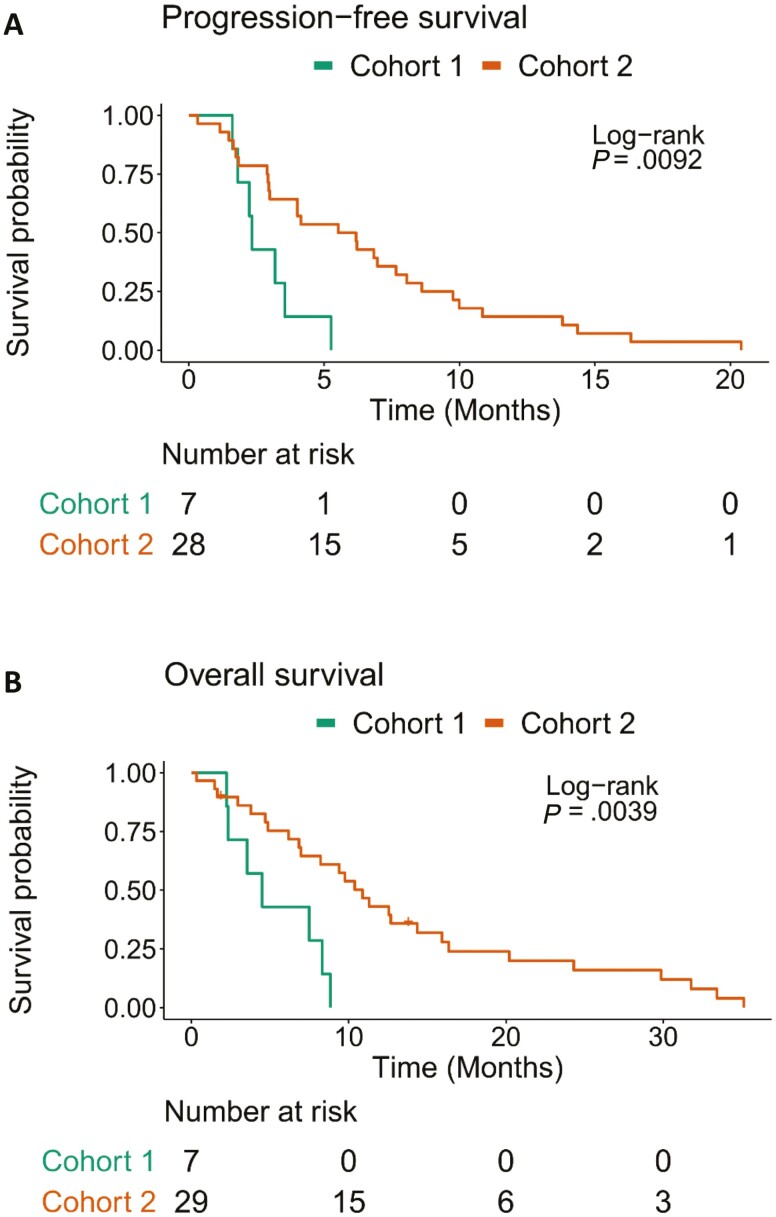
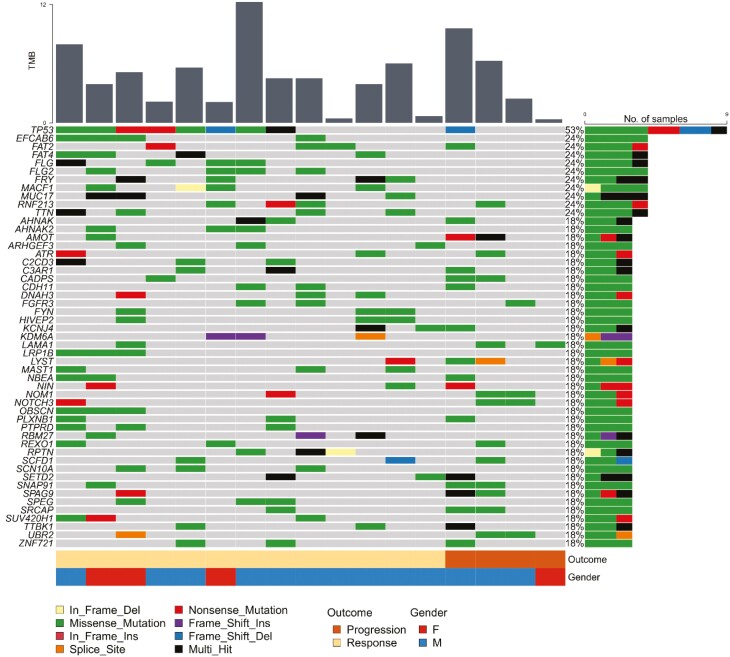
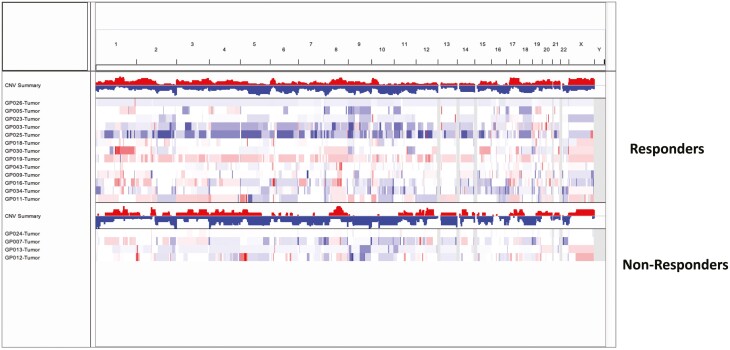
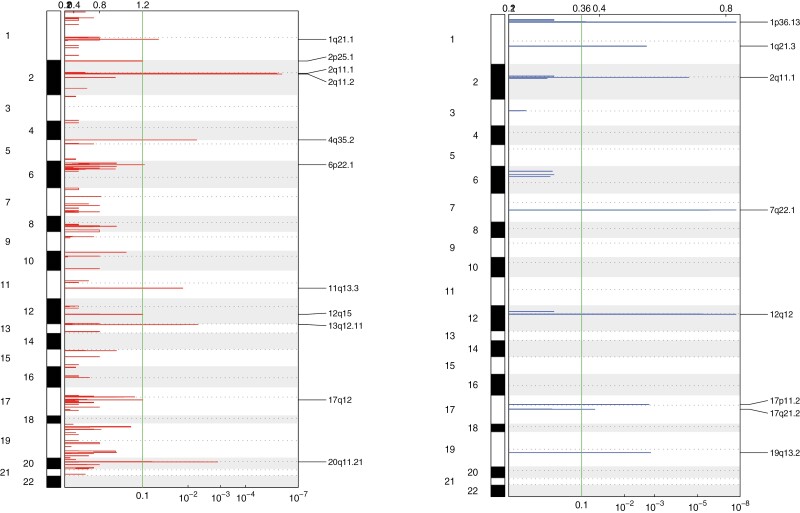
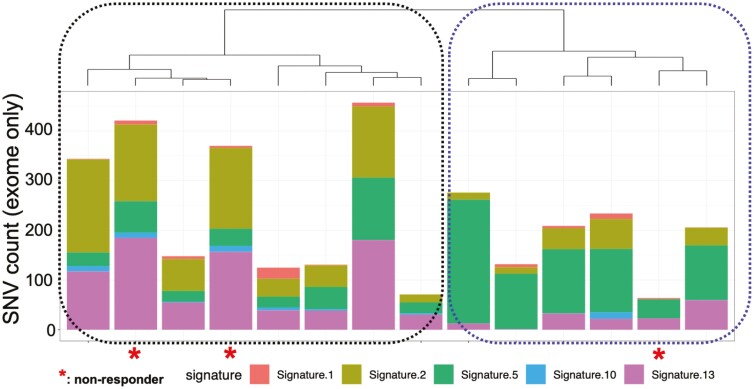
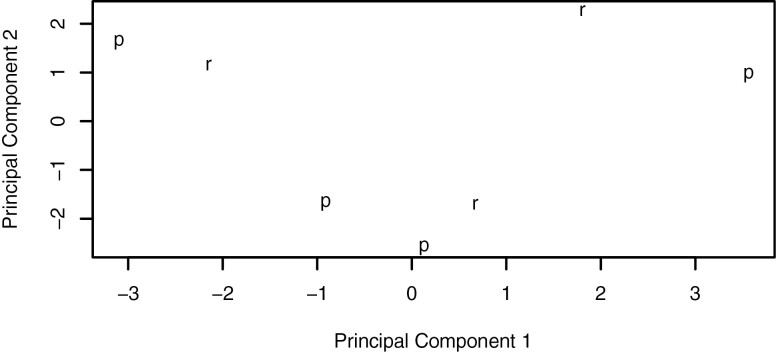
Results: A total of 36 patients were enrolled from 2010 to 2018 (cohort 1, N = 7; cohort 2, N = 29); the trial was terminated due to slow accrual. Clinical benefit at 4 months was attained by 0 (0%, 95% confidence interval [CI] 0-41.0%) patients in cohort 1 and 11 patients (37.9%, 95% CI 20.7-57.7%) in cohort 2. Median PFS was 2.33 (95% CI 1.81-Inf) months in cohort 1 and 5.85 (95% CI 2.99-8.61) months in cohort 2. Treatment was discontinued due to adverse events for 2 patients (29%) in cohort 1 and 11 patients (38%) in cohort 2. Molecular alterations in microtubule associated genes may be associated with treatment benefit but this requires further testing.
Conclusion: Everolimus plus paclitaxel demonstrates clinical activity in cisplatin-ineligible patients with metastatic UC, although the specific contribution of everolimus cannot be delineated. Patients with both impaired renal function and borderline functional status may be difficult to enroll to prospective trials. (ClinicalTrials.gov Identifier NCT01215136).
Keywords: cisplatin-ineligible; everolimus; genomic; paclitaxel; urothelial cancer.
© The Author(s) 2022. Published by Oxford University Press. The data published online to support this summary are the property of the authors. Please contact the authors about reuse rights of the original data.
Figures
References
-
- Dash A, Galsky MD, Vickers AJ, et al. . Impact of renal impairment on eligibility for adjuvant cisplatin-based chemotherapy in patients with urothelial carcinoma of the bladder. Cancer. 2006;107(3):506-513. - PubMed
-
- Galsky MD, Hahn NM, Rosenberg J, et al. . Treatment of patients with metastatic urothelial cancer “unfit” for Cisplatin-based chemotherapy. J Clin Oncol. 2011;29(17):2432-2438. - PubMed
-
- De Santis M, Bellmunt J, Mead G, et al. . Randomized phase II/III trial assessing gemcitabine/ carboplatin and methotrexate/carboplatin/vinblastine in patients with advanced urothelial cancer “unfit” for cisplatin-based chemotherapy: phase II–results of EORTC study 30986. J Clin Oncol. 2009;27(33):5634-5639. - PMC - PubMed
-
- Tickoo SK, Milowsky MI, Dhar N, et al. . Hypoxia-inducible factor and mammalian target of rapamycin pathway markers in urothelial carcinoma of the bladder: possible therapeutic implications. BJU Int. 2011;107(5):844-849. - PubMed
Publication types
MeSH terms
Substances
Associated data
LinkOut - more resources
Full Text Sources
Medical
