. 2022 Apr 26;119(17):e2107394119.
doi: 10.1073/pnas.2107394119. Epub 2022 Apr 19.

Extracellular vesicles from triple negative breast cancer promote pro-inflammatory macrophages associated with better clinical outcome

Affiliations

Extracellular vesicles from triple negative breast cancer promote pro-inflammatory macrophages associated with better clinical outcome

Mercedes Tkach et al. Proc Natl Acad Sci U S A. .

Abstract

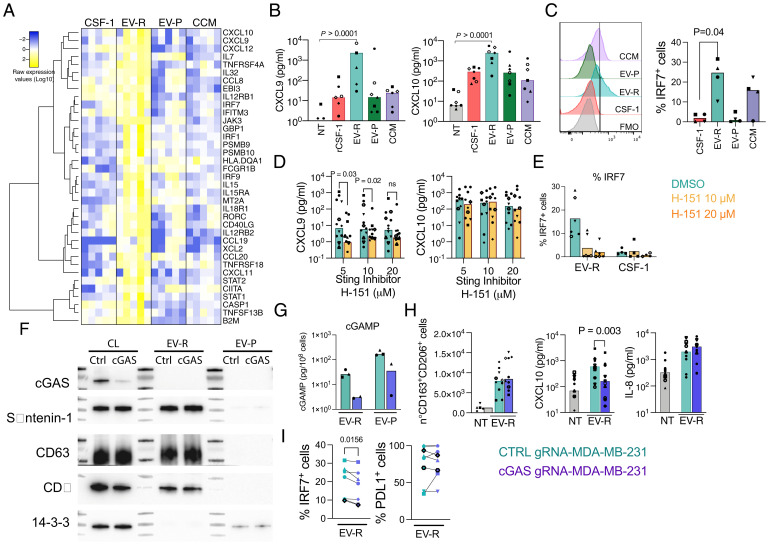
Tumor associated macrophages (TAMs), which differentiate from circulating monocytes, are pervasive across human cancers and comprise heterogeneous populations. The contribution of tumor-derived signals to TAM heterogeneity is not well understood. In particular, tumors release both soluble factors and extracellular vesicles (EVs), whose respective impact on TAM precursors may be different. Here, we show that triple negative breast cancer cells (TNBCs) release EVs and soluble molecules promoting monocyte differentiation toward distinct macrophage fates. EVs specifically promoted proinflammatory macrophages bearing an interferon response signature. The combination in TNBC EVs of surface CSF-1 promoting survival and cargoes promoting cGAS/STING or other activation pathways led to differentiation of this particular macrophage subset. Notably, macrophages expressing the EV-induced signature were found among patients’ TAMs. Furthermore, higher expression of this signature was associated with T cell infiltration and extended patient survival. Together, this data indicates that TNBC-released CSF-1-bearing EVs promote a tumor immune microenvironment associated with a better prognosis in TNBC patients.

Keywords: CSF-1; exosomes; extracellular vesicles; macrophages; triple-negative breast cancer.


Conflict of interest statement

The authors declare no competing interest.

Figures

Fig. 1.
Fig. 1.
Efficient separation of MDA-MB-231-derived secretome into EVs and soluble factors by ultrafiltration and SEC. (A) Scheme of collection of the EV-enriched and EV-poor fractions. Conditioned medium from MDA-MB-231 cells cultured ON in serum free medium was concentrated by ultrafiltration with 100 KDa cutoff filters. 0.5 mL of the concentrated conditioned medium (CCM) was subjected to size exclusion chromatography, and 0.5 mL individual or pooled fractions were collected and concentrated using 10 KDa cutoff filters. (B) Vesicle count and protein quantification on individual fractions is shown. Representative of two independent experiments. (C) WB of EV-associated proteins done on individual fractions and transmission electron microscopy of the pooled EV-rich (EV-R) and EV-poor (EV-P) fractions. (Scale bar: 100 nm.) Representative of three independent experiments. (D) Quantification of IL-6 and IL-8 present in pooled SEC fractions from MDA-MB-231 cells. Representative of two independent experiments. (E) MACSPlex Exosome on EV-containing fractions (F7-10) developed using a mix of antibodies against TSPs (CD9, CD63, and CD81). Results for individual EV isolations are shown (n = 7).
Fig. 2.
Fig. 2.
EVs and soluble factors from MDA-MB-231 cells promote the differentiation of monocytes toward macrophages. (A) Equal amount of proteins (4 µg) from pooled EV-R (F7–F10) or EV-poor (F15–F22) fractions were incubated for 5 d with freshly isolated CD14+ monocytes from healthy donors in the absence of any other stimuli. As control, CD14+ cells were also incubated with 100 ng/mL of rCSF-1 or rGM-CSF. On day 5, live cells were counted on each well by flow cytometry. (B) Mo-derived cells morphology was analyzed by cytospin at the end of the culture (Day 5). (Scale bars: 30 µm.) Representative of two independent experiments. (C) Analysis of macrophage marker expression by flow cytometry. Representative of two (for CD68, CD88, and CD1a expression) and of three to ten independent donors for the other markers (isotype control on CSF-1-treated cells is shown in gray). (D) CD206 vs. CD163 density plot of cells at day 5. Representative of four independent experiments. (E) Quantification of CD206+CD163+ live macrophages on day 5 of culture of monocytes with increasing doses of each pooled fraction (0.5, 1, and 2 µg of proteins). (F) Quantification of CD206+CD163+ live macrophages on day 5 of culture of monocytes with EV-R or EV-P fractions from equal numbers of control (CTRL gRNA) or Rab11a-KO (Rab11 gRNA) MDA-MB-231 cells. Each individual donor is shown (n = 9). Comparison between groups was performed by two-tailed, Wilcoxon test. P values ≤0.05 were considered significant and are indicated for each comparison. Each individual donor is shown. Results shown represent mean ± SEM.
Fig. 3.
Fig. 3.
EVs from TNBC MDA-MB-231 and BT-549 cells but not from luminal MCF-7 cells expose CSF-1 which is required for mo-macs induction. (A) Quantification of cytokines present in pooled SEC fractions from MDA-MB-231 cells measured by flow cytometry bead-based assays. Representative of two independent EV isolations. (B) Recovery of CSF-1 on MDA-MB-231 EVs by pull-down with anti-CD9, anti-CD81, and anti-CD63 (Pan-EV). (C) Presence of CSF-1 on lipid dye positive (membright 488) EVs measured by imaging flow cytometry (ImageStream-X). (D) MACSPlexExo analysis of MDA-MB-231 EV-R fractions, developed using a fluorescently coupled antibody against CSF-1. (E) Quantification of CD206+CD163+ live macrophages on day 5 of culture of monocytes with MDA-MB-231 EV-R in the presence of blocking antibodies against CSF-1 Receptor (CD115) or GM-CSF Receptor (CD116) molecules. Each individual donor is shown (n = 6). Results shown represent mean ± SEM (F) mRNA levels of CSF1 measured by RT-qPCR in MDA-MB-231 cells transduced with CRISPR/Cas9 lentivectors coding for control gRNA or two gRNA against CSF1 (n = 3, one representative experiment is shown). (G) CSF-1 levels in CCM or pooled EV-R fractions from MDA-MB-231 deleted for CSF1 as indicated. Quantification done on independent EV isolations is shown. (H) Number of live CD163+CD206+ mo-macs obtained upon 5-d culture of purified CD14+ monocytes from healthy donors with EV-R fractions from equal number of secreting control or CSF1-deleted MDA-MB-231 cells. Each individual donor is shown (n = 7). (I) CSF-1 levels in CCM or pooled EV-R fractions from MDA-MB-231, BT-549, and MCF-7 cells. Quantification done on independent EV isolations is shown. (J) CD206+CD163+-positive cells recovered after 5 d or culture of equal amounts of proteins from pooled EV-R fractions from MDA-MB-231, BT-549, or MCF-7 cells with freshly isolated CD14+ monocytes from healthy donors. (K) CSF-1 levels in CCM or pooled EV-R fractions from MCF-7 wild-type cells or MCF-7 overexpressing the full-length CSF-1 protein. Quantification done on independent EV isolations is shown. (L) EVs from control MCF-7 cells or MCF-7 expressing full-length CSF-1 were incubated with CD14+ cells for 5 d and the number of CD206+CD163+ cells at the end of the culture is indicated. Comparison between groups was performed by two-tailed, Wilcoxon test. P values ≤ 0.05 were considered significant and are indicated for each comparison. Each individual donor is shown. Results shown represent mean ± SEM.
Fig. 4.
Fig. 4.
Mo-macs induced upon MDA-MB-231 EVs treatment express IFN response genes and are enriched in M1 signature. (A) Number of live CD206+CD163+ cells obtained after 5 d of culture of CD14+ monocytes with equal amounts of CSF-1 on EV-R, EV-P, or CCM (0.02 ng/mL) or with rCSF-1 (100 ng/mL) (n = 5). (B) Transcriptomic analysis of mo-macrophages differentiated as indicated in (A). Principal component analysis on the 5,000 most variant genes. (C) K-means clustering of differentially expressed genes. (D) Gene Ontology analysis of biological processes enriched in the clusters specific for each type of macrophage (cluster 5 for EV-R-mo-macs, cluster 4 for EV-P-mo-macs, cluster 6 for CSF-1-mo-macs, and cluster 7 for CCM-mo-macs). (E) Scatter plot of normalized mean expression of M1 and M2 signatures per group.
Fig. 5.
Fig. 5.
Role of STING in recipient monocytes and cGAS in EV-producing tumor cells in IFN response in EV-R-mo-macs. (A) Heat map of ISGs present in cluster 5 from RNA-seq K-means clustering analysis (EV-R-mo-macs specific cluster) identified as IFN-related in the GO biological processes analysis. (B) Quantification of CXCL9 and CXCL10 present at day 5 in the supernatant of monocytes treated with rCSF-1, EV-R, EV-P, or CCM was evaluated by cytometric bead array (CBA). (C) Expression of IRF7 (Left) and percentage of IRF7 positive cells (Right) in monocytes treated for 5 d with rCSF-1, EV-R, EV-P, or CCM, measured by intracellular staining. (D) Quantification of CXCL9 (Left) and CXCL10 (Right) present at day 5 in the supernatant of monocytes treated with EV-R with or without STING inhibitor was evaluated by CBA. (E) Percentage of IRF7 positive CD163+CD206+ cells at day 5 in culture of monocytes treated with EV-R or rCSF1 with or without STING inhibitor. (F) WB for cGAS and EV-associated proteins done on cell lysates (CL), EV-R, and EV-P fractions of MDA-MB-231-SCR-gRNA (Ctrl) or MDA-MB-231-cGAS-gRNA (cGAS). (G) Measurement of cGAMP levels in EV-R and EV-P SEC fractions of MDA-MB-231 control cells or cGAS-deleted cells. (H) EV-R from an equal amount of MDA-MB-231 control (CTRL gRNA) or cGAS-deleted (cGAS gRNA) cells were incubated with CD14+ monocytes for 5 d. At the end of the culture the number of CD163+CD206+ cells was evaluated by FACS (Left) and secretion of CXCL10 (Middle) and IL-8 (Right) was measured by CBA. (I) Percentage of IRF7 and PDL1 positive cells among CD163+CD206+ at the end of the culture of monocytes treated as in (H) with EVs from control cells or cGAS-deleted cells. For (D), (E), (H), and (I), comparison between groups was performed by two-tailed, Wilcoxon test. P values ≤0.05 were considered significant and are indicated for each comparison. For (A) and (B), Friedman test for comparison among groups was performed.
Fig. 6.
Fig. 6.
TNBC human tumors release EVs containing CSF-1 and their infiltration with macs containing an EV-R-mo-macs signature confers them better survival probability. (A) Scheme of tissue-explant culture method for EV isolation from paired tumor tissue and juxta-tumor tissue. EVs were isolated from small volumes of prefiltered CM by ultracentrifugation. (B) Absolute CSF-1 pg present in 400 µL of conditioned medium as described in (A) or in EVs obtained from 400 µL of conditioned medium. (C) Heat map of the genes with the strongest up-regulation (log2 fold change >2) in the EV-R-mo-macs when compared to all the other conditions. These 23 genes constitute the EV-R-signature used to analyze RNA from patients’ tumor samples. (D) Expression of EV-R-mo-macs- or EV-P-mo-macs-enriched genes in TNBC tumor-infiltrating HLA-DR+CD11c+ cells as determined by scRNA-seq. UMAP embedding of single cells as per the original study are shown, with color intensity representing normalized signature expression level. (Right Panel) UMAP map of macrophage and monocytes clusters from the HLA-DR+CD11c+cells scRNA-seq analysis from all seven TNBC patients with the identified clusters is shown. Each dot represents a cell, colored by clusters. EV-R and EV-P gene signatures (E) EV-R-mo-macs and EV-P-mo-macs signature expression across breast cancer subsets on the METABRIC cohort (Luminal, n = 1,314; Her2, n = 243; TNBC, n = 330). (F) Correlation of the EV-R-signature and the EV-P-signature with established signatures for CD8 cytotoxic, CD8 memory, CD8 exhausted, and CD4 T regulatory cells and NK cells in the METABRIC cohort. (G) Assay for migration of total T cells using xCELLigence. T cells were seeded in the upper chamber, and supernatant from rCSF-1-mo-macs or EV-R-mo-macs or EV-P-mo-macs or rCXCL10 in the lower chamber of CIM-plates. Migration was evaluated for 24 h. (H) Kaplan-Meier curves showing overall survival of TNBC patients from the METABRIC cohort stratified by high (red) and low (blue) expressions of EV-R-mo-macs (Left), EV-P-mo-macs (Middle), or of a canonical IFN signature (Right). Survival curves were compared with the log-rank test (n = 330).

References

    1. Cassetta L., Pollard J. W., Targeting macrophages: Therapeutic approaches in cancer. Nat. Rev. Drug Discov. 17, 887–904 (2018). - PubMed
    1. Azizi E., et al. , Single-cell map of diverse immune phenotypes in the breast tumor microenvironment. Cell 174, 1293–1308.e36 (2018). - PMC - PubMed
    1. Chevrier S., et al. , An immune atlas of clear cell renal cell carcinoma. Cell 169, 736–749.e18 (2017). - PMC - PubMed
    1. Lavin Y., et al. , Innate immune landscape in early lung adenocarcinoma by paired single-cell analyses. Cell 169, 750–765.e17 (2017). - PMC - PubMed
    1. Qian B.-Z., et al. , CCL2 recruits inflammatory monocytes to facilitate breast-tumour metastasis. Nature 475, 222–225 (2011). - PMC - PubMed

Publication types

MeSH terms