. 2022 Apr 26;119(17):e2113675119.
doi: 10.1073/pnas.2113675119. Epub 2022 Apr 19.

An epilepsy-associated KV1.2 charge-transfer-center mutation impairs KV1.2 and KV1.4 trafficking

Affiliations

An epilepsy-associated KV1.2 charge-transfer-center mutation impairs KV1.2 and KV1.4 trafficking

Michelle Nilsson et al. Proc Natl Acad Sci U S A. .

Abstract

We report on a heterozygous KCNA2 variant in a child with epilepsy. KCNA2 encodes KV1.2 subunits, which form homotetrameric potassium channels and participate in heterotetrameric channel complexes with other KV1-family subunits, regulating neuronal excitability. The mutation causes substitution F233S at the KV1.2 charge transfer center of the voltage-sensing domain. Immunocytochemical trafficking assays showed that KV1.2(F233S) subunits are trafficking deficient and reduce the surface expression of wild-type KV1.2 and KV1.4: a dominant-negative phenotype extending beyond KCNA2, likely profoundly perturbing electrical signaling. Yet some KV1.2(F233S) trafficking was rescued by wild-type KV1.2 and KV1.4 subunits, likely in permissible heterotetrameric stoichiometries: electrophysiological studies utilizing applied transcriptomics and concatemer constructs support that up to one or two KV1.2(F233S) subunits can participate in trafficking-capable heterotetramers with wild-type KV1.2 or KV1.4, respectively, and that both early and late events along the biosynthesis and secretion pathway impair trafficking. These studies suggested that F233S causes a depolarizing shift of ∼48 mV on KV1.2 voltage dependence. Optical tracking of the KV1.2(F233S) voltage-sensing domain (rescued by wild-type KV1.2 or KV1.4) revealed that it operates with modestly perturbed voltage dependence and retains pore coupling, evidenced by off-charge immobilization. The equivalent mutation in the Shaker K+ channel (F290S) was reported to modestly affect trafficking and strongly affect function: an ∼80-mV depolarizing shift, disrupted voltage sensor activation and pore coupling. Our work exposes the multigenic, molecular etiology of a variant associated with epilepsy and reveals that charge-transfer-center disruption has different effects in KV1.2 and Shaker, the archetypes for potassium channel structure and function.

Keywords: channelopathy; dominant negative; fluorometry; ion channel; trafficking.


Conflict of interest statement

The authors declare no competing interest.

Figures

Fig. 1.
Fig. 1.
Discovery of a KCNA2 mutation in a patient with epilepsy. (A) Membrane topology of the KV1.2 subunit and model of a homotetrameric KV1.2 channel (8). F233S is on helix S2, within the VSD. (B) Model of KV1.2 VSD activation and deactivation (8). The electric field is focused on F233 (magenta, star symbol), which is part of the charge transfer center (11). Upon membrane depolarization (+Vm), positively charged residues on S4 [side chains in dark blue (12)], traverse the membrane electric field, compelling S4 to move outward. Movement of the fourth conserved arginine R4 is thought to couple VSD activation to pore opening (13, 14). Upon membrane repolarization (−Vm), S4 returns to its resting state, inducing pore closure (–19). (C) Partial EEG of the sleeping patient, showing right posterior epileptiform discharges (red X). (D) Sequencing chromatograms of the patient and his healthy parents. Inset: Magnified view at the mutation site (KCNA2 c.698T > C, heterozygous).
Fig. 2.
Fig. 2.
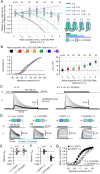
F233S completely prevents the cell-surface trafficking of KV1.2 channels. (A) Cut-open oocyte Vaseline gap (COVG) experiments showing that Xenopus oocytes injected with KV1.2(F233S) cRNA exhibit no voltage-dependent currents, even upon strong depolarization (red). Vm, membrane potential; Im, membrane current. (B) Fluorescent KV1.2 constructs to investigate trafficking. Top: WT KV1.2 with N-terminally fused enhanced green fluorescent protein (EGFP), reporting total protein, and extracellularly accessible hemagglutinin (HA) tag, reporting surface protein. Bottom: As on top, with F233S. (C) Confocal micrographs of nonpermeabilized COS-7 cells transfected with the constructs in B. (D) Flow cytometry of live COS-7 cells transfected with the constructs in B. Left: Cell-density plots of log(EGFP) (total protein) against log(α-HA) (cell-surface expression). The vertical solid line separates low- and high-EGFP cells (Left and Right). The horizontal dashed line separates high-EGFP cells into α-HA negative (Bottom) and α-HA positive (Top). Right: Percentage of α-HA-positive cells, normalized to cells expressing KV1.2(WT). Errors are SEM.
Fig. 3.
Fig. 3.
F233S subunits cause a dominant-negative suppression of KV1.2 channel conductance. (A) Representative OpusXpress (TEVC) current traces from cells injected with KV1.2 WT and F233S cRNA. 1×RNA = 0.5 ng/oocyte. (B) Macroscopic conductance (Gtotal) relative to 2× (homozygous) WT (1.0 ± 0.098); 1×WT (0.57 ± 0.073); 1×WT + 1×F233S (0.19 ± 0.022). (C) Voltage dependence of 2×WT (V0.5 = −5.8 ± 0.78 mV; zeff = 2.3 ± 0.12 e0); 1×WT (V0.5 = −7.6 ± 0.90 mV; zeff = 2.7 ± 0.15 e0); 1×WT + 1×F233S (V0.5 = −8.3 ± 0.66 mV; zeff = 3.3 ± 0.13 e0). (D) Current evoked by depolarization to 100 mV in homozygous mutant (2×F233S; 300 ± 31 nA) and sham-injected cells (450 ± 95 nA); P = 0.15. Errors are SEM.
Fig. 4.
Fig. 4.
KV1.2(F233S) subunits sequester, and are concomitantly rescued by, KV1.2(WT). (A) Constructs used to evaluate KV1.2 cell-surface trafficking. Each construct emulates one allele. KV1.2 with N-terminally fused EGFP, reporting total protein production; an extracellular HA tag (as in Fig. 2B) cotransfected with KV1.2 with N-terminally fused mRFP1, reporting total protein production; and an extracellular bungarotoxin (BTX) binding-site (BBS) tag. (B) Flow cytometry experiments on cells transfected with the constructs in A. The cell-density plots show total protein [log(EGFP)] and surface staining [log(α-HA)] in live cells positive for mRFP1. The vertical dashed lines separate negative (Left) and positive (Right) EGFP cells. Percentage of cells with a positive surface (α-HA) signal (normalized to WT*|WT, i.e., 100 ± 0.85%): WT*|F233S: 55 ± 2.0%; F233S*|WT: 22 ± 1.5%; F233S*|F233S: 1.3 ± 0.27%. Signals from mRFP1 and BTX in EGFP-positive cells are in SI Appendix, Fig. S1. Errors are SEM. n.s.= not significant.
Fig. 5.
Fig. 5.
Only 3WT:1F233S heterotetramers are trafficking capable. (A) Relative conductance in cells injected with KV1.2(WT) cRNA and increasing proportion of KV1.2(F233S) cRNA. The voltage dependence in all conditions is in SI Appendix, Fig. S2. Superimposed curves show number of tetramers of specified composition, relative to the 0-F233S condition, generated by a model assuming binomially distributed tetramerization. (B) Representative COVG current traces from cells injected with dimeric KV1.2 concatemer cRNA. Relative macroscopic conductance (C) and voltage dependence (D) of cells injected with KV1.2(WT)-KV1.2(WT) (WT-WT) cRNA (relative Gtotal = 1.0 ± 0.25; V0.5 = −3.3 ± 1.5 mV; zeff = 2.3 ± 0.16e0), WT-F233S (relative Gtotal = 0.053 ± 0.017; V0.5 = 19 ± 0.29 mV; zeff = 2.7 ± 0.083e0) or F233S-WT (relative Gtotal = 0.068 ± 0.014; V0.5 = 22 ± 0.59 mV; zeff = 2.3 ± 0.10e0). (E) No current was observed in cells injected with F233S-F233S up to 200 mV (450 ± 48 nA) compared to uninjected cells (560 ± 150 nA; P = 0.53). Errors are 95% CI (A) or SEM (BE).
Fig. 6.
Fig. 6.
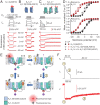
KV1.2(F233S) subunits concomitantly suppress and are rescued by KV1.4. (A) Constructs used to evaluate KV1.2 and KV1.4 cell-surface trafficking. KV1.4 with N-terminally fused EGFP, reporting total protein production; an extracellular HA tag cotransfected with KV1.2 with N-terminally fused mRFP1, reporting total protein production; and an extracellular BBS tag. (B) Flow cytometry experiments on cells transfected with constructs in A. The cell-density plots show total protein [log(EGFP)] and surface staining [log(α-HA)] in live cells positive for mRFP1. The vertical dashed line separates negative (Left) and positive (Right) EGFP. Percentage of cells with a positive surface (α-HA) signal [normalized to KV1.4*|KV1.2(WT), i.e., 100 ± 2.4%]: KV1.4*|KV1.2(F233S): 8.5 ± 1.9%. (C) As in B, showing the signals from KV1.2 constructs cotransfected with KV1.4. Plots of log(mRFP1) (total protein) against log(BTX) (cell-surface expression). The vertical dashed line separates negative (Left) and positive (Right) mRFP1 cells among the plotted live, EGFP-positive cells. Percentage of cells with a positive surface (BTX) signal [normalized to KV1.2(WT)*|KV1.4, i.e., 100 ± 2.7%]: KV1.2(F233S)*|KV1.2(F233S): 3.7 ± 0.36%; KV1.2(F233S)*|KV1.4: 16 ± 3.1%. Errors are SEM.
Fig. 7.
Fig. 7.
KV1.4 and KV1.2(F233S) subunits form 3:1 and 2:2 heteromeric channels. (A) Relative peak conductance in cells injected with KV1.4 cRNA and increasing molar proportion of KV1.2(F233S) cRNA. Superimposed curves show the number of tetramers of specified composition relative to the 0-F233S condition, generated by a model assuming binomially distributed tetramerization. (B) Fitted Boltzmann distributions of peak macroscopic conductance from the same cells as in A. Data, parameters, and individual curves in SI Appendix, Fig. S3. The potential of 20% activation (V0.2) best shows the F233S-dependent shift in voltage dependence on the right. Error bars are ±95% CI. (C) Representative TEVC current traces demonstrate altered voltage-dependent properties in heteromeric channels. (D) Representative COVG current traces from cells injected with dimeric KV1.4/KV1.2 concatemer cRNA. Relative macroscopic conductance (E and F) and voltage dependence (G) of cells injected with 1.4-1.2(WT) (relative Gtotal = 1.0 ± 0.29; V0.5 = −4.8 ± 1.3 mV; zeff = 1.6 ± 0.038 e0); 1.4-1.2(F233S) (relative Gtotal = 1.1 ± 0.23; V0.5 = 23 ± 1.2 mV; zeff = 1.2 ± 0.027 e0); 1.2(WT)-1.4 (relative Gtotal = 1.0 ± 0.15; V0.5 = −8.2 ± 0.95 mV; zeff = 1.9 ± 0.12 e0); 1.2(F233S)-1.4 (relative Gtotal = 0.062 ± 0.012; V0.5 = 24 ± 1.2 mV; zeff = 1.8 ± 0.044 e0). Conductance for 1.4-1.2 constructs, which exhibit fast inactivation, was calculated at peak current. Errors are SEM.
Fig. 8.
Fig. 8.
Operation of the KV1.2(F233S) VSD. (A) VCF experiments on KV1.2 homotetramers, fluorescently labeled outside the S4 helix (A291C) to optically track the voltage-dependent activation of the VSD (Fig. 1B) Vm, Im (black), and simultaneously acquired fluorescence deflections (ΔF, red). VSD activation causes fluorophore quenching, reported as negative ΔF (8). (B and C) As in A, but the fluorescence label is in KV1.2(F233S) subunits rescued by WT KV1.2 (B) or KV1.4 (C). Note that VSD deactivation is delayed in C (interpreted below). (D) Normalized macroscopic conductance (G, black) and VSD activation (ΔF, red), fit to Boltzmann distributions. KV1.2(A291C) G: V0.5 = 14 ± 2.8 mV, zeff = 1.6 ± 0.14 e0; ΔF: V0.5 = −50 ± 1.8 mV, zeff = 1.3 ± 0.22 e0; n = 4. KV1.2/1.2(F233S,A291C) G: V0.5 = −0.89 ± 2.4 mV, zeff = 1.6 ± 0.074 e0; ΔF: V0.5 = −64 ± 4.0 mV, zeff = 1.2 ± 0.11 e0; n = 6. KV1.4/1.2(F233S,A291C) G: V0.5 = 16 ± 0.75 mV, zeff = 1. 1 ± 0.039 e0; ΔF: V0.5 = −56 ± 1.0 mV, zeff = 1.6 ± 0.13 e0; n = 6. Errors are SEM. Note that the KV1.2(A291C) conductance (black filled circles) is right shifted by ∼15 mV compared to WT due to the A291C mutation (8); the KV1.2/1.2(F233S,A291C) conductance (black open circles) has a large contribution from WT homotetramers, so it is relatively left shifted. (E and F) Interpretation of data from KV1.4/1.2(F233S,A291C) heterotetramers (C). The diagrams in E show pore and VSD states in a hypothetical KV1.4/1.2(F233S,A291C) heterotetramer (only two subunits shown). Numbered transitions are registered on the exemplary current and fluorescence traces in F. (E) Top Left: The Vm is negative; the VSDs are resting (label in high-fluorescence state), and the pore is closed (no current). Upon depolarization (transition 1) VSDs activate and the channel opens (Top Right), reported as current onset and downward ΔF in F. Next (transition 2), KV1.4 inactivation particles block the channels (Bottom Right), reported as current reduction. Following membrane repolarization, the inactivation particle persists in the pore, preventing its closure (Bottom Left). It takes time for the particle to dissociate (transition 3), delaying VSD deactivation (off-charge immobilization), reported as slow ΔF recovery. In the absence of an inactivation particle, the VSD deactivates with fast kinetics (SI Appendix, Fig. S4B).

References

    1. Stühmer W., et al. , Molecular basis of functional diversity of voltage-gated potassium channels in mammalian brain. EMBO J. 8, 3235–3244 (1989). - PMC - PubMed
    1. Trimmer J. S., Subcellular localization of K+ channels in mammalian brain neurons: Remarkable precision in the midst of extraordinary complexity. Neuron 85, 238–256 (2015). - PMC - PubMed
    1. Bean B. P., The action potential in mammalian central neurons. Nat. Rev. Neurosci. 8, 451–465 (2007). - PubMed
    1. Kole M. H., Letzkus J. J., Stuart G. J., Axon initial segment Kv1 channels control axonal action potential waveform and synaptic efficacy. Neuron 55, 633–647 (2007). - PubMed
    1. Sheng M., Liao Y. J., Jan Y. N., Jan L. Y., Presynaptic A-current based on heteromultimeric K+ channels detected in vivo. Nature 365, 72–75 (1993). - PubMed