. 2022 May 23;7(10):e150070.
doi: 10.1172/jci.insight.150070.

T cell receptor sequencing identifies prior SARS-CoV-2 infection and correlates with neutralizing antibodies and disease severity

Affiliations

T cell receptor sequencing identifies prior SARS-CoV-2 infection and correlates with neutralizing antibodies and disease severity

Rebecca Elyanow et al. JCI Insight. .

Abstract

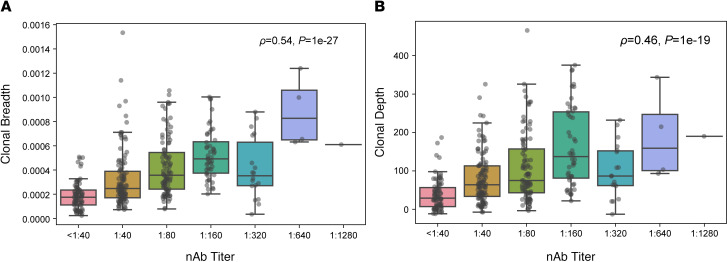
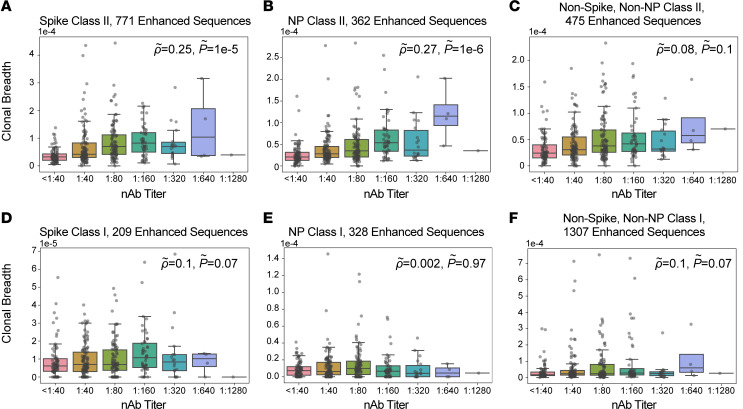
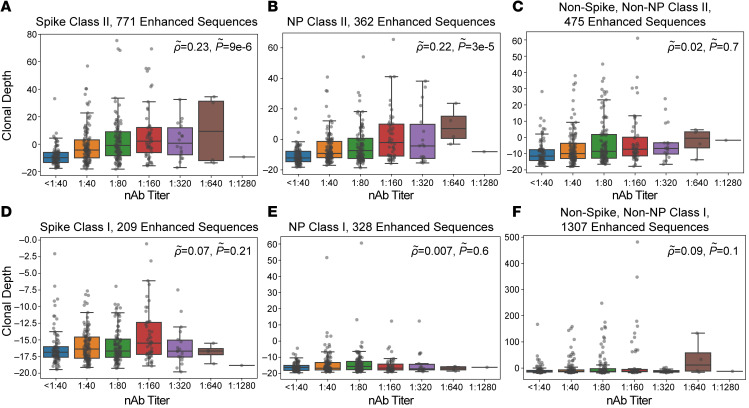
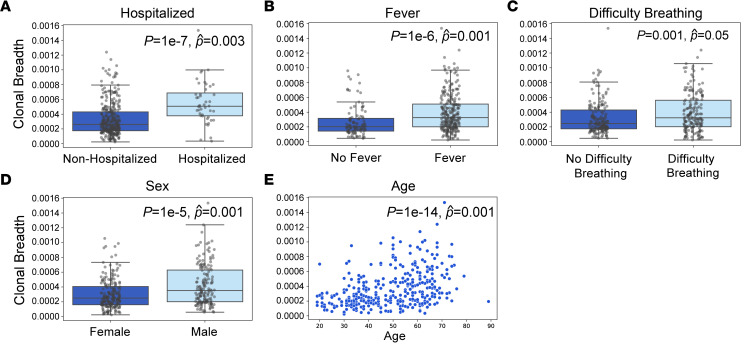
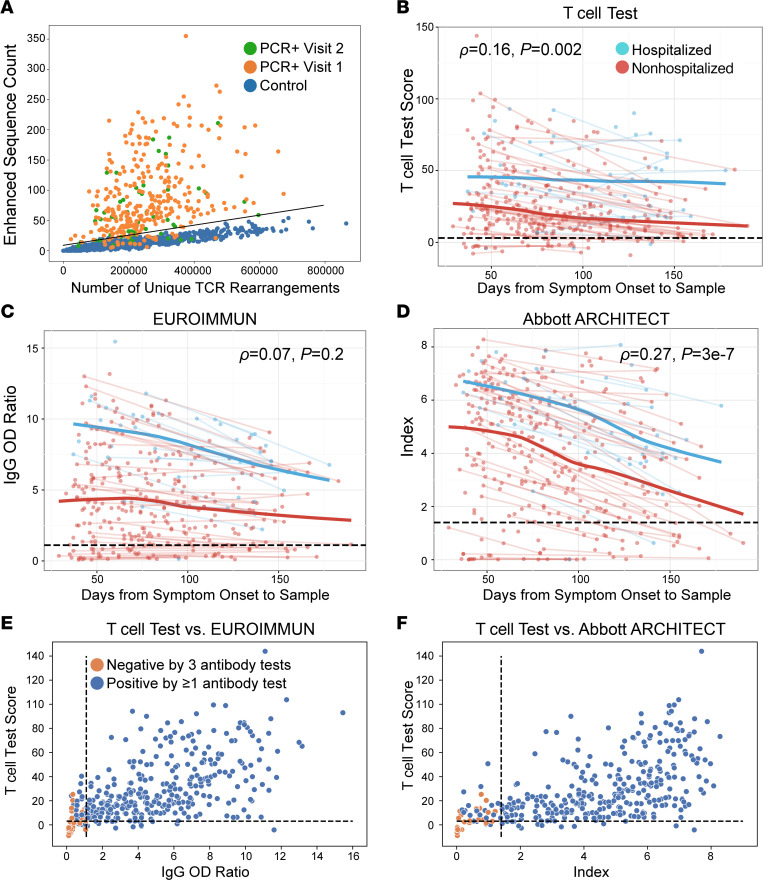
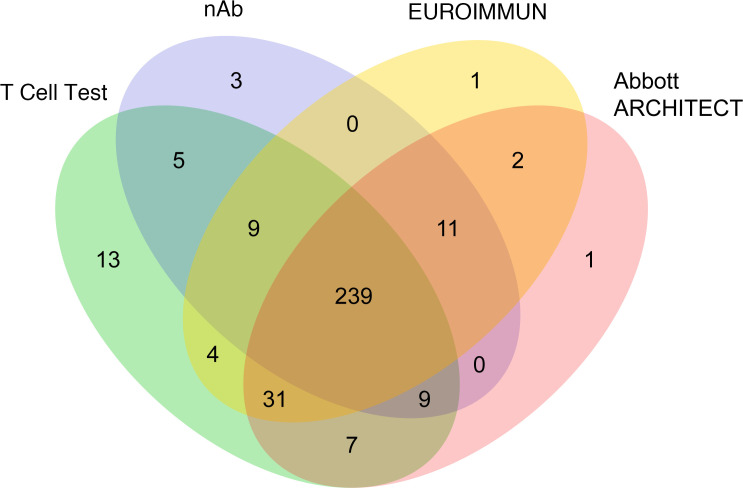
BACKGROUNDMeasuring the immune response to SARS-CoV-2 enables assessment of past infection and protective immunity. SARS-CoV-2 infection induces humoral and T cell responses, but these responses vary with disease severity and individual characteristics.METHODSA T cell receptor (TCR) immunosequencing assay was conducted using small-volume blood samples from 302 individuals recovered from COVID-19. Correlations between the magnitude of the T cell response and neutralizing antibody (nAb) titers or indicators of disease severity were evaluated. Sensitivity of T cell testing was assessed and compared with serologic testing.RESULTSSARS-CoV-2-specific T cell responses were significantly correlated with nAb titers and clinical indicators of disease severity, including hospitalization, fever, and difficulty breathing. Despite modest declines in depth and breadth of T cell responses during convalescence, high sensitivity was observed until at least 6 months after infection, with overall sensitivity ~5% greater than serology tests for identifying prior SARS-CoV-2 infection. Improved performance of T cell testing was most apparent in recovered, nonhospitalized individuals sampled > 150 days after initial illness, suggesting greater sensitivity than serology at later time points and in individuals with less severe disease. T cell testing identified SARS-CoV-2 infection in 68% (55 of 81) of samples with undetectable nAb titers (<1:40) and in 37% (13 of 35) of samples classified as negative by 3 antibody assays.CONCLUSIONThese results support TCR-based testing as a scalable, reliable measure of past SARS-CoV-2 infection with clinical value beyond serology.TRIAL REGISTRATIONSpecimens were accrued under trial NCT04338360 accessible at clinicaltrials.gov.FUNDINGThis work was funded by Adaptive Biotechnologies, Frederick National Laboratory for Cancer Research, NIAID, Fred Hutchinson Joel Meyers Endowment, Fast Grants, and American Society for Transplantation and Cell Therapy.

Keywords: Adaptive immunity; COVID-19; Diagnostics; Infectious disease; T cell receptor.


Figures

Figure 1
Figure 1. SARS-CoV-2–specific T cell responses correlate with nAb titers.
(A and B) Correlation of T cell clonal breadth (A) and depth (B) with nAb titers in samples from individuals with a prior positive SARS-CoV-2 RT-PCR test (n = 357). Significance was evaluated by Spearman’s rank-order correlation. Data are expressed as median ± IQR.
Figure 2
Figure 2. Correlation of TCR clonal breadth with nAb titers.
(AF) Class II HLA–restricted TCRs (AC) or class I HLA–restricted TCRs (DF) were assigned to antigens from the SARS-CoV-2 spike protein (A and D), nucleocapsid phosphoprotein (NP; B and E), and other viral proteins (C and F), and clonal breadth of assigned sequences was correlated with nAb titers. Correlations for spike class II–associated T cells (A); NP class II–associated T cells (B); other class II T cells (C); spike class I–associated T cells (D); NP class I–associated T cells (E); and other class I T cells (F) with nAb titer. Data are expressed as median ± IQR (n = 357). Partial correlations were assessed by Spearman’s rank-order correlation.
Figure 3
Figure 3. Correlation of TCR clonal depth with nAb titers.
Class II HLA–restricted TCRs (AC) or class I HLA–restricted TCRs (DF) were assigned to antigens from the SARS-CoV-2 spike protein (A and D), nucleocapsid phosphoprotein (NP; B and E), and other viral proteins (C and F), and clonal depth of assigned sequences was correlated with nAb titers. Correlations for spike class II–associated T cells (A); NP class II–associated T cells (B); other class II T cells (C); spike class I–associated T cells (D); NP class I–associated T cells (E); and other class I T cells (F) with nAb titer. Data are expressed as median ± IQR (n = 357). Partial correlations were assessed by Spearman’s rank-order correlation.
Figure 4
Figure 4. Association of T cell clonal breadth with clinical variables.
(AE) Correlation of clonal breadth with hospitalization (A), fever (B), difficulty breathing (C), sex (D), and age (E) was evaluated by univariate Mann-Whitney U test (P) and multivariate linear regression with age, sex, hospitalization, fever, difficulty breathing, and TCR rearrangements as variables. Data are expressed as median ± IQR (n = 302 convalescent individuals). Population means and 95% CI values for (AD) were as follows: (A) nonhospitalized, 3.4 × 10⁻⁴ (3.1 × 10⁻⁴ to 3.7 × 10⁻⁴); hospitalized, 6.3 × 10⁻⁴ (5.1 × 10⁻⁴ to 7.5 × 10⁻⁴); (B) no fever, 2.8 × 10⁻⁴ (2.3 × 10⁻⁴ to 3.2 × 10⁻⁴); fever, 4.0 × 10⁻⁴ (3.7 × 10⁻⁴ to 4.4 × 10⁻⁴); (C) no difficulty breathing, 3.3 × 10⁻⁴ (3.0 × 10⁻⁴ to 3.6 × 10⁻⁴); difficulty breathing, 4.0 × 10⁻⁴ (3.6 × 10⁻⁴ to 4.4 × 10⁻⁴); (D) female, 3.1 × 10⁻⁴ (3.0 × 10⁻⁴ to 3.4 × 10⁻⁴); male, 4.4 × 10⁻⁴ (3.9 × 10⁻⁴ to 4.8 × 10⁻⁴).
Figure 5
Figure 5. Comparison of TCR-based assay and serological assays.
(A) Number of SARS-CoV-2 enhanced sequences (of 4287 possible) verus number of unique TCR rearrangements for RT-PCR–confirmed samples collected at visit 1 (n = 302; orange) or visit 2 (n = 55; green) or control samples (n = 1657; blue). Line indicates the classifier threshold. (BD) T cell test score, defined as log-odds of the probability of the logistic regression model (B), EUROIMMUN IgG OD ratio (C), and Abbott ARCHITECT assay index (D) as a function of time from symptom onset for hospitalized (blue) or nonhospitalized (red) individuals for 357 samples from 302 convalescent individuals. Trend lines connect visit 1 and visit 2 samples from the same individual. Blue and red bold trend lines indicate smoothed means (locally estimated scatterplot smoothing, LOESS; ref. 56) for hospitalized and nonhospitalized individuals. Significance was evaluated by Spearman’s rank-order correlation. (E and F) T cell test scores versus EUROIMMUN IgG OD ratio (E) or Abbott ARCHITECT index (F) for 357 samples from 302 convalescent individuals. Samples classified negative by all 3 antibody tests (EUROIMMUN, Abbott ARCHITECT, nAb titer) are highlighted in orange. Black dashed lines indicate cutoffs for positivity/negativity. The cutoff for nAb positivity was 1:40 (24).
Figure 6
Figure 6. Concordance among T cell, EUROIMMUN, Abbott ARCHITECT, and nAb assays.
Schematic showing overlapping SARS-CoV-2+ test results obtained using the T cell (green), EUROIMMUN (yellow), Abbott ARCHITECT (pink), and nAb (blue) assays (n = 357).

Update of

References

    1. Alter G, Seder R. The power of antibody-based surveillance. N Engl J Med. 2020;383(18):1782–1784. doi: 10.1056/NEJMe2028079. - DOI - PMC - PubMed
    1. Dan JM, et al. Immunological memory to SARS-CoV-2 assessed for up to 8 months after infection. Science. 2021;371(6529):eabf4063. doi: 10.1126/science.abf4063. - DOI - PMC - PubMed
    1. Zuo J, et al. Robust SARS-CoV-2-specific T-cell immunity is maintained at 6 months following primary infection. Nat Immunol. 2021;22(5):620–626. doi: 10.1038/s41590-021-00902-8. - DOI - PMC - PubMed
    1. Gudbjartsson DF, et al. Humoral immune response to SARS-CoV-2 in Iceland. N Engl J Med. 2020;383(18):1724–1734. doi: 10.1056/NEJMoa2026116. - DOI - PMC - PubMed
    1. Ewer KJ, et al. T cell and antibody responses induced by a single dose of ChAdOx1 nCoV-19 (AZD1222) vaccine in a phase 1/2 clinical trial. Nat Med. 2021;27(2):270–278. doi: 10.1038/s41591-020-01194-5. - DOI - PubMed

Publication types

Associated data