. 2022 Jun 15;132(12):e156821.
doi: 10.1172/JCI156821.

PD-1 and ICOS coexpression identifies tumor-reactive CD4+ T cells in human solid tumors

Affiliations

PD-1 and ICOS coexpression identifies tumor-reactive CD4+ T cells in human solid tumors

Rebekka Duhen et al. J Clin Invest. .

Abstract

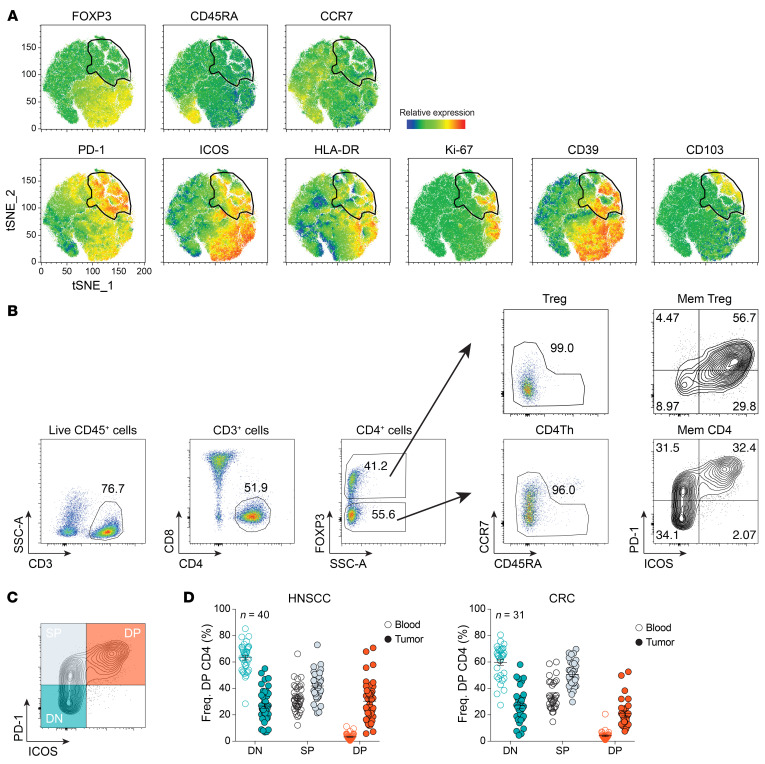
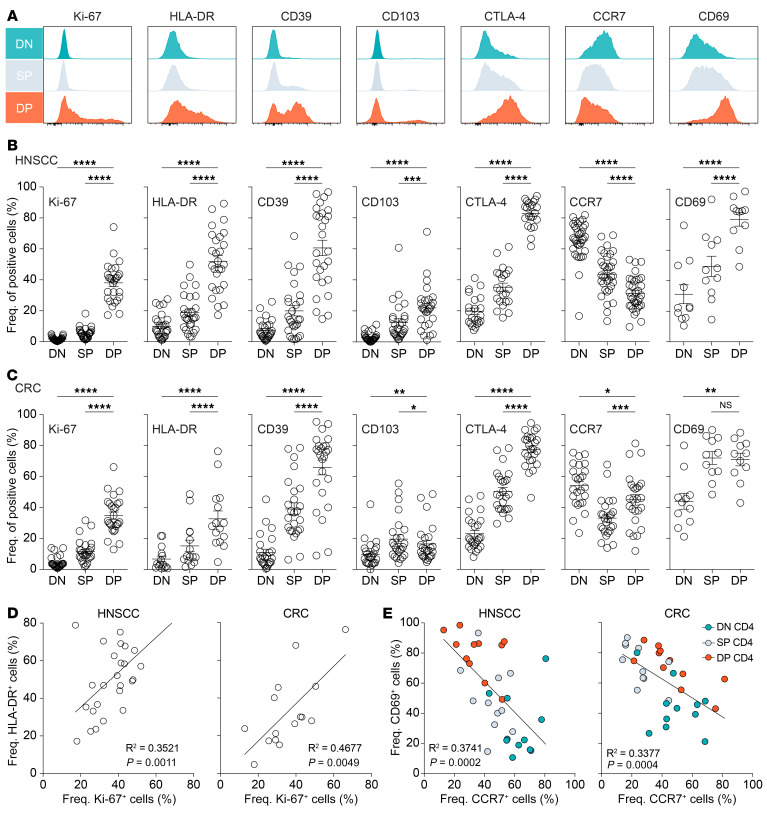
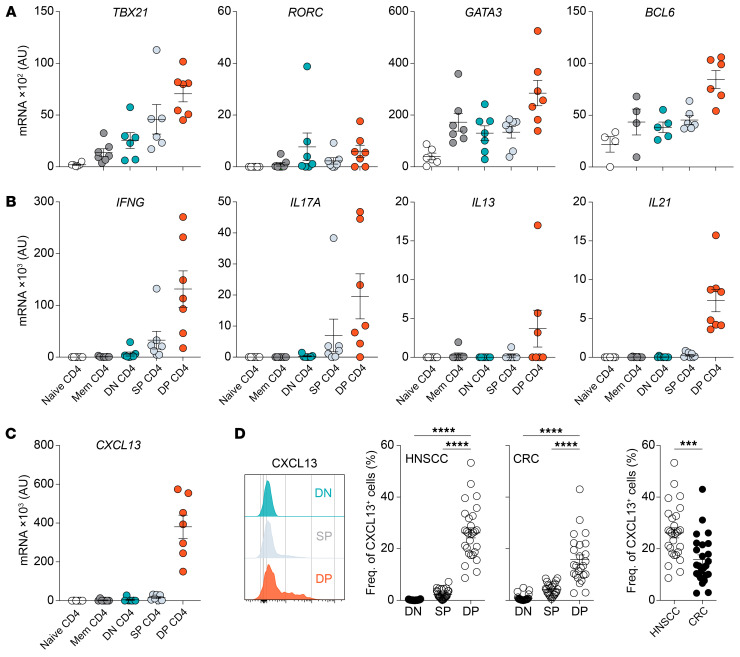
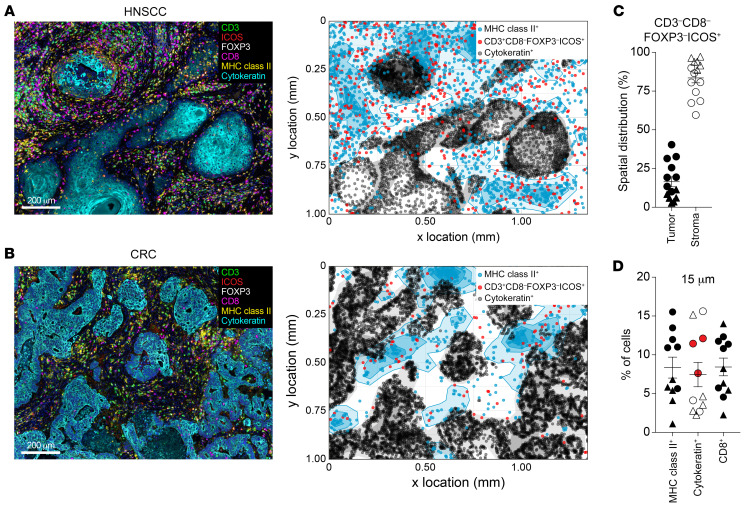
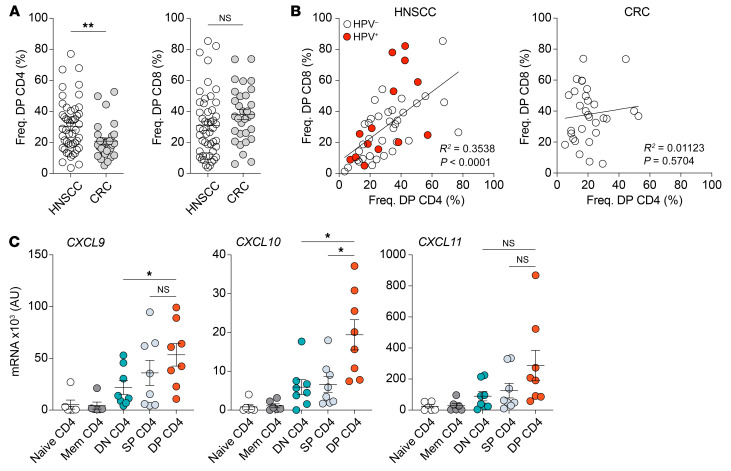
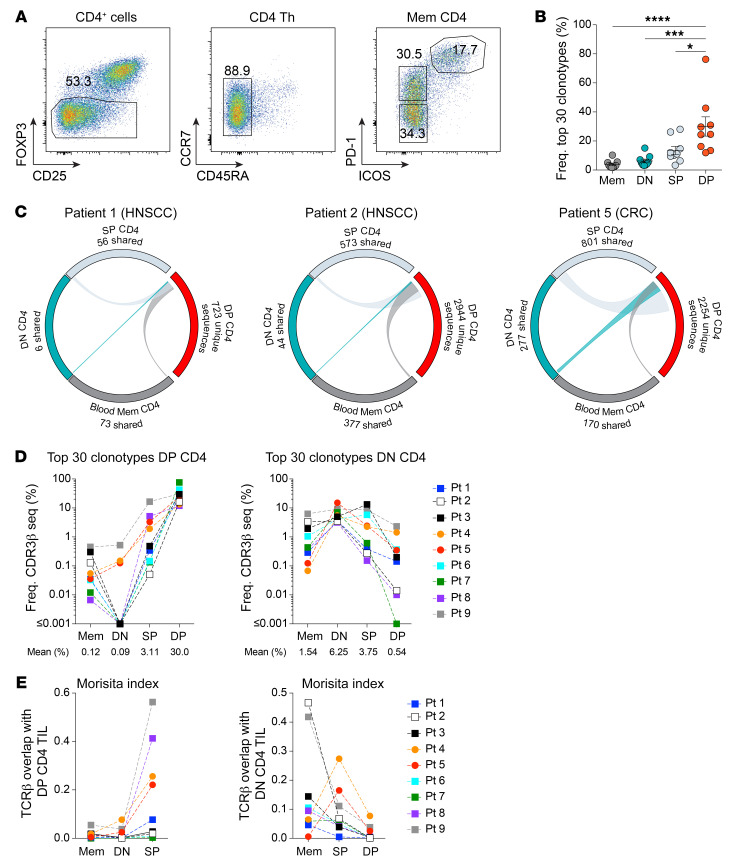
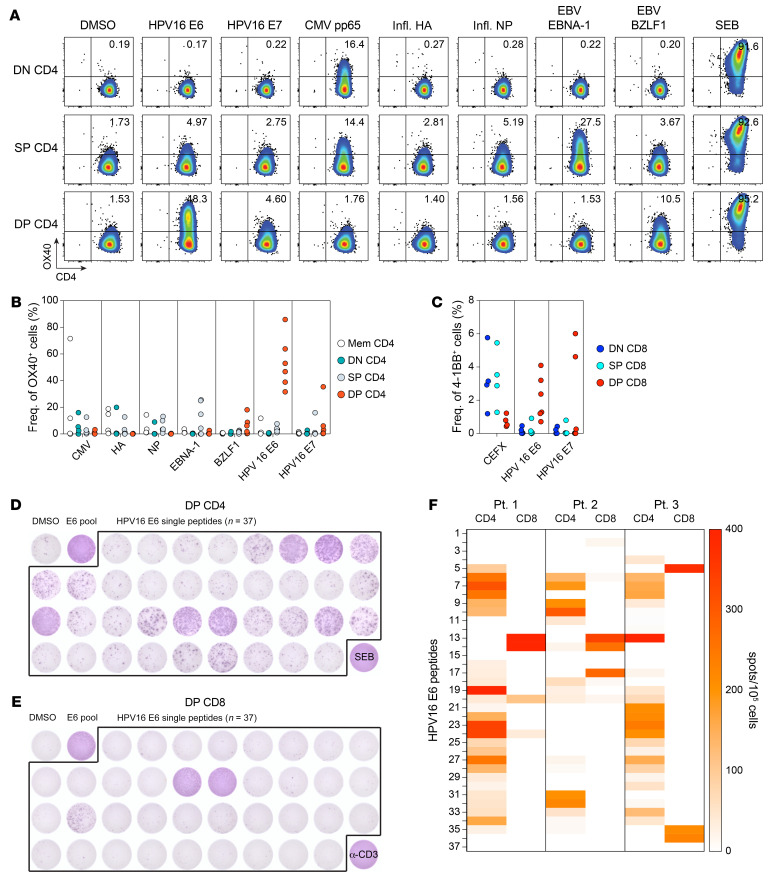
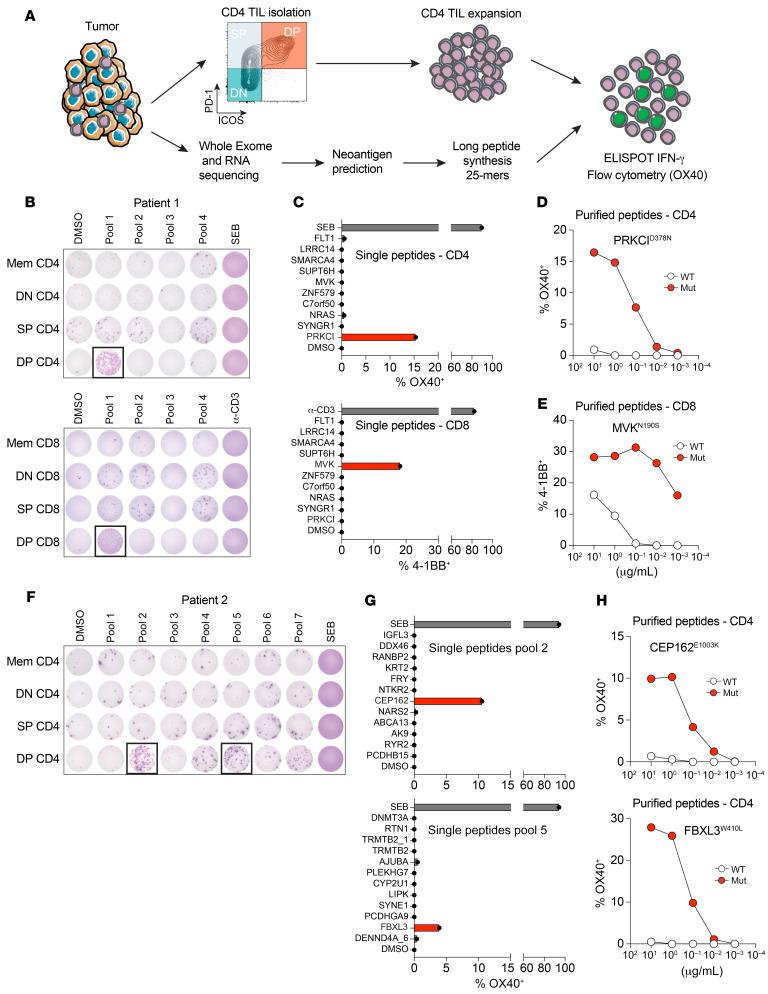
CD4+ Th cells play a key role in orchestrating immune responses, but the identity of the CD4+ Th cells involved in the antitumor immune response remains to be defined. We analyzed the immune cell infiltrates of head and neck squamous cell carcinoma and colorectal cancers and identified a subset of CD4+ Th cells distinct from FOXP3+ Tregs that coexpressed programmed cell death 1 (PD-1) and ICOS. These tumor-infiltrating lymphocyte CD4+ Th cells (CD4+ Th TILs) had a tissue-resident memory phenotype, were present in MHC class II-rich areas, and proliferated in the tumor, suggesting local antigen recognition. The T cell receptor repertoire of the PD-1+ICOS+ CD4+ Th TILs was oligoclonal, with T cell clones expanded in the tumor, but present at low frequencies in the periphery. Finally, these PD-1+ICOS+ CD4+ Th TILs were shown to recognize both tumor-associated antigens and tumor-specific neoantigens. Our findings provide an approach for isolating tumor-reactive CD4+ Th TILs directly ex vivo that will help define their role in the antitumor immune response and potentially improve future adoptive T cell therapy approaches.

Keywords: Cancer; Immunology; Immunotherapy; Oncology; T cells.


Figures

Figure 1
Figure 1. PD-1 and ICOS identify distinct subsets of CD4+ Th TILs.
(A) t-SNE analysis of tumor-infiltrating CD3+CD4+ T cells isolated from 22 patients with HNSCC. The gate identified PD-1+ cells and gate was applied to all plots. (B) Flow cytometric analysis of CD4+ TILs and the gating strategy are shown for a representative patient with HNSCC. Mem, memory. (C) Subsets of CD4+ Th cells (DN, SP, and DP) were defined on the basis of differential expression of PD-1 and ICOS. (D) A summary of the frequency (Freq.) of DN, SP, and DP CD4+ Th cells in the blood and tumor of patients with HNSCC (left, n = 40) or CRC (right, n = 31) is shown. The DN (teal), SP (gray), and DP (orange) CD4+ Th cell subsets for each patient are highlighted on the graphs in C and D. Small horizontal lines indicate the mean ± SEM.
Figure 2
Figure 2. Phenotypic properties of DN, SP, and DP CD4+ Th TILs.
(A) Ex vivo phenotypic analysis of the expression of Ki-67, HLA-DR, CD39, CD103, CTLA-4, CCR7, and CD69 on the 3 CD4+ TIL subsets of 1 representative patient with HNSCC. (B) Summary of the percentages of the above-mentioned markers among multiple patients with HNSCC (n = 27 for Ki-67, HLA-DR, CD39, and CD103; n = 22 for CTLA-4; n = 34 for CCR7; and n = 11 for CD69). (C) Summary of the percentages of the above-mentioned markers among multiple patients with CRC (n = 26 for Ki-67 and CCR7; n = 15 for HLA-DR; n = 25 for CD39, CD103, CTLA-4; and n = 11 for CD69). (D) Correlation between the percentages of HLA-DR+ cells and Ki-67+ cells in DP CD4+ TILs from patients with HNSCC (left, n = 27) or CRC (right, n = 15). (E) Correlation between the percentages of CD69+ cells and CCR7+ cells in the different CD4+ TIL subsets in patients with HNSCC (n = 11) or CRC (n = 11). Horizontal lines indicate the mean ± SEM. *P < 0.05, **P < 0.01, ***P < 0.001, and ****P < 0.0001, by 1-way ANOVA with Tukey’s post hoc test.
Figure 3
Figure 3. Functional properties of DN, SP, and DP CD4+ Th TILs.
qPCR analysis of the expression of mRNA transcripts of transcription factors (A), cytokines (B), and CXCL13 (C) by the indicated CD4+ Th cell subsets isolated from patients with HNSCC or CRC directly ex vivo. (D) Left: Flow cytometric analysis of CXCL13 production by the different CD4+ TIL subsets directly ex vivo from 1 representative patient with HNSCC. Right: Summary of the frequency of CXCL13-producing cells in each CD4+ TIL subset in patients with HNSCC (n = 28) or CRC (n = 25). Horizontal lines indicate the mean ± SEM. ***P < 0.001 and ****P < 0.0001, by 1-way ANOVA with Tukey’s post hoc test (D, left and middle graphs) or unpaired t test (D, far right graph).
Figure 4
Figure 4. DP CD4+ Th cells are in the tumor stroma proximal to MHC class II+ cells.
mIHC for CD3, CD8, FOXP3, ICOS, MHC class II, and cytokeratin on FFPE tissue sections from HNSCC and CRC tumors. Representative ROIs (left) from an HNSCC tumor (A) and a CRC tumor (B) and the corresponding cellular spatial relationship maps (right). Scale bars: 200 μm. The maps show cytokeratin+ cells (tumor) in black, MHC class II+ cells in blue, and CD3+CD8FOXP3ICOS+ (DP CD4+ Th cells) in red. (C) Analysis of the distribution of CD3+CD8FOXP3ICOS+ (DP CD4+ Th cells) in the tumor stroma and tumor epithelium in 14 tumors (n = 8 HNSCC and n = 6 CRC). (D) Neighbor’s cell analysis was performed on 11 tumors (n = 6 HNSCC and n = 5 CRC). The proportion of MHC class II+ cells in the stroma and cytokeratin+ cells detected within a 15 μm radius from CD3+CD8FOXP3ICOS+ (DP CD4+ Th) cells is indicated as the frequency of total cells. Circles represent HNSCC tumors, and triangles represent CRC tumors. Horizontal lines indicate the mean ± SEM. Data for patients with MHC class II–expressing tumor cells are shown in red in D.
Figure 5
Figure 5. The presence of DP CD4+ Th cells positively correlates with DP CD8+ T cells in HNSCC, but not in CRC.
(A) Comparison of the percentage of DP CD4+ and DP CD8+ cells between HNSCC (n = 49) and CRC (n = 31) tumors. (B) Correlation between the frequencies of DP CD4+ and DP CD8+ cells in patients with HNSCC (n = 49) or CRC (n = 31). Red circles represent HPV+ HNSCC tumors. (C) qPCR analysis of CXCL9, CXCL10, and CXCL11 mRNA expression by the indicated CD4+ T cell subsets isolated from patients with HNSCC or CRC directly ex vivo. Horizontal lines indicate the mean ± SEM. *P < 0.05 and **P < 0.01, by unpaired 2-tailed t test (A) or 1-way ANOVA with Tukey’s post hoc test (C).
Figure 6
Figure 6. DP CD4+ Th TILs have a unique and oligoclonal TCR repertoire.
(A) Gating strategy for the TCR repertoire analysis. (B) Cumulative frequencies of the top 30 clonotypes for each CD4+ Th subset in 9 patients with cancer. (C) Circos plots of unique productive TCRβ nucleotide sequences from each of the indicated cell subsets. Connections highlight sequences from DP CD4+ TILs found in the other CD4+ Th cell populations. The number of shared sequences is indicated. Circos plots for 2 patients with HNSCC and 1 patient with CRC are shown. (D) Cumulative frequencies of the top 30 clonotypes from DP CD4+ TILs (left) and DN CD4+ TILs (right) in 9 patients (Pt) with cancer. Their frequencies in blood memory CD4+, DN, SP, and DP CD4+ TILs are represented. (E) Similarity between the TCR repertoires of the different CD4+ T cell subsets was measured using the Morisita-Horn index for 9 patients with cancer. Each color represents a distinct patient connected with a dashed line (D and E). Horizontal lines indicate the mean ± SEM. *P < 0.05, ***P < 0.001, and ****P < 0.0001, by 1-way ANOVA with Tukey’s post hoc test (B).
Figure 7
Figure 7. DP CD4+ Th TILs recognize HPV-associated antigens.
(A) In vitro–expanded CD4+ TIL subsets (DN, SP, and DP) were cocultured with autologous B cells pulsed with DMSO or the indicated peptide pools. T cell reactivity was assessed by OX40 upregulation after 24 hours of culturing. Data for 1 representative patient with HPV+ HNSCC are shown. (B) Summary of the reactivity of CD4+ Th subsets to the indicated peptide pools for 6 patients with HPV+ HNSCC. (C) Summary of the reactivity of CD8+ T cells to HPV16 E6, HPV16 E7, and CEFX peptide pools for the same 6 patients with HPV+ HNSCC. CD8+ T cell activation was assessed by 4-1BB upregulation. DP CD4+ (D) and DP CD8+ (E) TILs isolated from 1 patient with HPV+ HNSCC were cultured with autologous B cells pulsed with DMSO, the HPV16 E6 peptide pool, or the individual overlapping peptides contained in the HPV16 E6 peptide pool (n = 37). Reactivity was measured by IFN-γ ELISPOT assay. SEB or anti-CD3 antibodies were used as positive controls for CD4+ and CD8+ T cells, respectively. (F) Summary of the reactivity of DP CD4+ and DP CD8+ TILs to HPV16 E6 individual peptides for 3 different patients with HPV+ HNSCC, as measured by IFN-γ ELISPOT assay. The colors in the heatmap legend represent the number of detected spots/105 cells.
Figure 8
Figure 8. DP CD4+ Th TILs recognize tumor-specific neoantigens.
(A) Schematic representation of the methodology used to identify neoantigen-reactive CD4+ Th cells. (B) In vitro–expanded CD4+ and CD8+ T cell subsets (DN, SP, and DP) from patient 1 were cocultured with autologous B cells pulsed with DMSO or the indicated peptide pools. T cell reactivity was measured by IFN-γ ELISPOT assay. (C) Reactivity of DP CD4+ and DP CD8+ TILs to B cells pulsed with individual 25 mer peptides from pool 1. Flow cytometric analysis of OX40 or 4-1BB upregulation on CD4+ or CD8+ T cells, respectively is shown. The mutations recognized are highlighted in red. (D) DP CD4+ Th TILs were cocultured with autologous B cells pulsed with decreasing concentrations of WT or mutated (Mut) PRKCID378N 25 mer peptides. Reactivity was measured by flow cytometric analysis of OX40 upregulation on CD4 cells. (E) DP CD8+ TILs were cocultured with autologous B cells pulsed with decreasing concentrations of WT or mutated 8 mer MVKN190S peptides. Reactivity was measured by flow cytometric analysis of 4-1BB upregulation on CD8+ T cells. (F) In vitro–expanded CD4+ T cell subsets (DN, SP, and DP) from patient 2 were cocultured with autologous B cells pulsed with DMSO or the indicated peptide pools. T cell reactivity was measured by IFN-γ ELISPOT assay. (G) Reactivity of DP CD4+ Th TILs to B cells pulsed with individual 25 mer peptides from peptide pools 2 and 5. Flow cytometric analysis of OX40 upregulation on CD4+ cells is shown. The mutations recognized are highlighted in red. (H) DP CD4+ Th TILs were cocultured with autologous B cells pulsed with decreasing concentrations of WT or mutated CEP162E1003K or FBXL3W410L 25 mer peptides. Reactivity was measured by flow cytometric analysis of OX40 upregulation on CD4+ cells.

Comment in

References

    1. Le DT, et al. PD-1 blockade in tumors with mismatch-repair deficiency. N Engl J Med. 2015;372(26):2509–2520. doi: 10.1056/NEJMoa1500596. - DOI - PMC - PubMed
    1. Le DT, et al. Mismatch repair deficiency predicts response of solid tumors to PD-1 blockade. Science. 2017;357(6349):409–413. doi: 10.1126/science.aan6733. - DOI - PMC - PubMed
    1. Overman MJ, et al. Nivolumab in patients with metastatic DNA mismatch repair-deficient or microsatellite instability-high colorectal cancer (CheckMate 142): an open-label, multicentre, phase 2 study. Lancet Oncol. 2017;18(9):1182–1191. doi: 10.1016/S1470-2045(17)30422-9. - DOI - PMC - PubMed
    1. Addeo R, et al. CheckMate 141 trial: all that glitters is not gold. Expert Opin Biol Ther. 2019;19(3):169–171. doi: 10.1080/14712598.2019.1570498. - DOI - PubMed
    1. Galon J, et al. Type, density, and location of immune cells within human colorectal tumors predict clinical outcome. Science. 2006;313(5795):1960–1964. doi: 10.1126/science.1129139. - DOI - PubMed

Publication types

MeSH terms

Substances